Miami, FL Investment Properties for Sale
Browse homes for sale and investment properties in Miami, FL. Refine your search by price, property type, or more.
Best cash flowing properties in Miami, FL

Active
$234,900
1
bds
|
1
ba
|
726
sqft
|
built
1973
900 SW 84th Ave, Miami, FL 33144
$-112
Cash flow
-2.5%
Cash-on-Cash Return
5.6%
Cap rate
0.9%
Rent to Value Ratio
Active
$249,900
2
bds
|
2
ba
|
882
sqft
|
built
1973
5050 NW 7th St, Miami, FL 33126
$-173
Cash flow
-3.6%
Cash-on-Cash Return
5.3%
Cap rate
0.9%
Rent to Value Ratio
6,163 out of 6,996 properties for sale in Miami, FL
Limited Results Shown
Create a free account, or log in to reveal all property listings and enjoy the complete experience.
Active
$628,000
2
bds
|
2
ba
|
1,129
sqft
|
built
2008
90 SW 3rd St, Miami, FL 33130
$-2,181
Cash flow
-18.1%
Cash-on-Cash Return
2.0%
Cap rate
0.6%
Rent to Value Ratio
Active
$710,000
3
bds
|
2
ba
|
1,222
sqft
|
built
1979
11921 SW 122nd Ave, Miami, FL 33186
$-1,084
Cash flow
-8.0%
Cash-on-Cash Return
4.3%
Cap rate
0.5%
Rent to Value Ratio
Active
$330,000
2
bds
|
2
ba
|
1,170
sqft
|
built
1983
1350 SW 122nd Ave, Miami, FL 33184
$-489
Cash flow
-7.7%
Cash-on-Cash Return
4.4%
Cap rate
0.8%
Rent to Value Ratio
Active
$670,000
2
bds
|
2
ba
|
1,214
sqft
|
built
1982
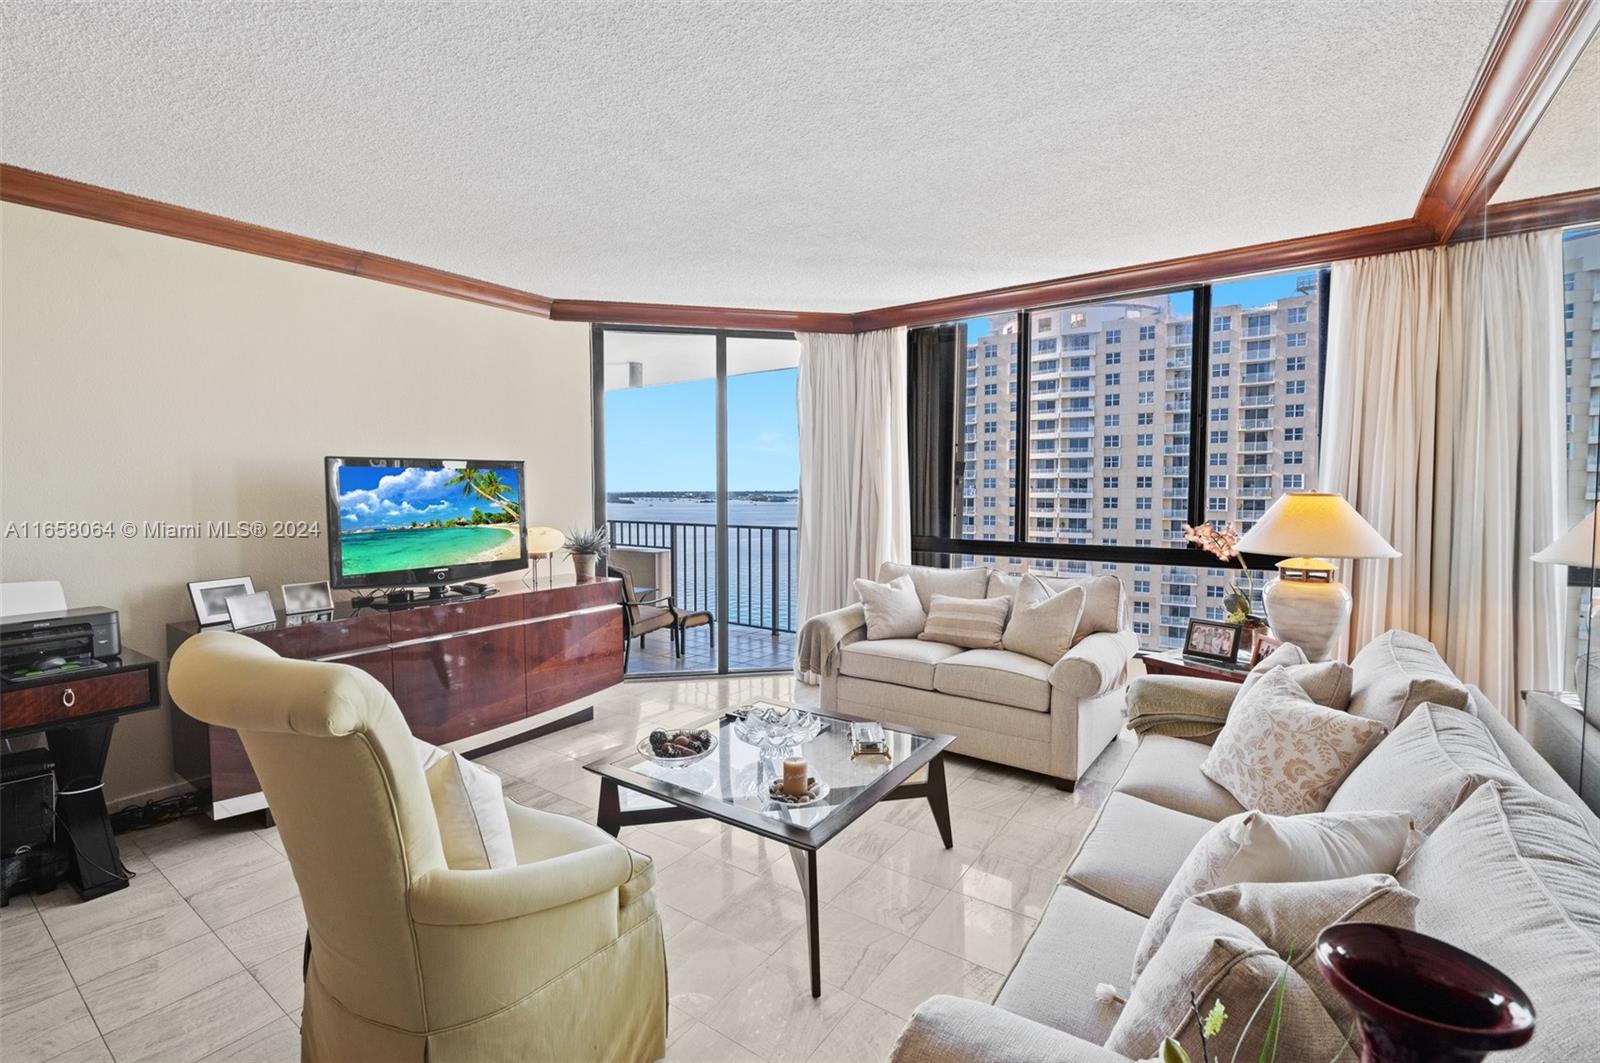
520 Brickell Key Dr, Miami, FL 33131
$-2,558
Cash flow
-19.9%
Cash-on-Cash Return
1.6%
Cap rate
0.7%
Rent to Value Ratio
Active
$460,000
4
bds
|
2
ba
|
1,400
sqft
|
built
2020
8020 NW 9th Ave, Miami, FL 33150
$-557
Cash flow
-6.3%
Cash-on-Cash Return
4.7%
Cap rate
0.7%
Rent to Value Ratio
Active
$249,900
2
bds
|
2
ba
|
882
sqft
|
built
1973
5050 NW 7th St, Miami, FL 33126
$-173
Cash flow
-3.6%
Cash-on-Cash Return
5.3%
Cap rate
0.9%
Rent to Value Ratio
Active
$2,225,000
4
bds
|
5
ba
|
1,871
sqft
|
built
2019
480 NE 31st St, Miami, FL 33137
$-8,423
Cash flow
-19.8%
Cash-on-Cash Return
1.6%
Cap rate
0.5%
Rent to Value Ratio
Active
$234,900
1
bds
|
1
ba
|
726
sqft
|
built
1973
900 SW 84th Ave, Miami, FL 33144
$-112
Cash flow
-2.5%
Cash-on-Cash Return
5.6%
Cap rate
0.9%
Rent to Value Ratio
Active
$1,190,000
2
bds
|
3
ba
|
1,202
sqft
|
built
2016
88 SW 7th St, Miami, FL 33130
$-4,322
Cash flow
-18.9%
Cash-on-Cash Return
1.8%
Cap rate
0.6%
Rent to Value Ratio

Active
$1,250,000
1
bds
|
2
ba
|
1,022
sqft
|
built
2019
1000 Brickell Ave, Miami, FL 33131
$-5,293
Cash flow
-22.1%
Cash-on-Cash Return
1.1%
Cap rate
0.4%
Rent to Value Ratio
Active
$755,000
4
bds
|
3
ba
|
2,060
sqft
|
built
2002
14028 SW 156th Ave, Miami, FL 33196
$-1,757
Cash flow
-12.1%
Cash-on-Cash Return
3.4%
Cap rate
0.5%
Rent to Value Ratio
Active
$849,999
6
bds
|
0
ba
|
2,300
sqft
|
built
2004
1330 NE 117th Ter, Miami, FL 33161
$-3,165
Cash flow
-19.4%
Cash-on-Cash Return
1.7%
Cap rate
0.3%
Rent to Value Ratio

Active
$1,890,000
2
bds
|
3
ba
|
1,747
sqft
|
built
2003
1435 Brickell Ave, Miami, FL 33131
$-9,281
Cash flow
-25.6%
Cash-on-Cash Return
0.3%
Cap rate
0.4%
Rent to Value Ratio
Active
$359,000
2
bds
|
2
ba
|
848
sqft
|
built
1989
850 N Miami Ave, Miami, FL 33136
$-1,245
Cash flow
-18.1%
Cash-on-Cash Return
2.0%
Cap rate
0.8%
Rent to Value Ratio

Active
$715,000
2
bds
|
3
ba
|
1,123
sqft
|
built
2007
1040 Biscayne Blvd, Miami, FL 33132
$-3,312
Cash flow
-24.2%
Cash-on-Cash Return
0.6%
Cap rate
0.6%
Rent to Value Ratio

Active
$830,000
3
bds
|
2
ba
|
1,373
sqft
|
built
1955
650 NE 178th St, Miami, FL 33162
$-2,438
Cash flow
-15.3%
Cash-on-Cash Return
2.6%
Cap rate
0.5%
Rent to Value Ratio
Active
$850,000
4
bds
|
3
ba
|
1,554
sqft
|
built
1957
685 NE 172nd St, Miami, FL 33162
$-1,478
Cash flow
-9.1%
Cash-on-Cash Return
4.1%
Cap rate
0.6%
Rent to Value Ratio
Active
$545,000
2
bds
|
2
ba
|
1,049
sqft
|
built
2004
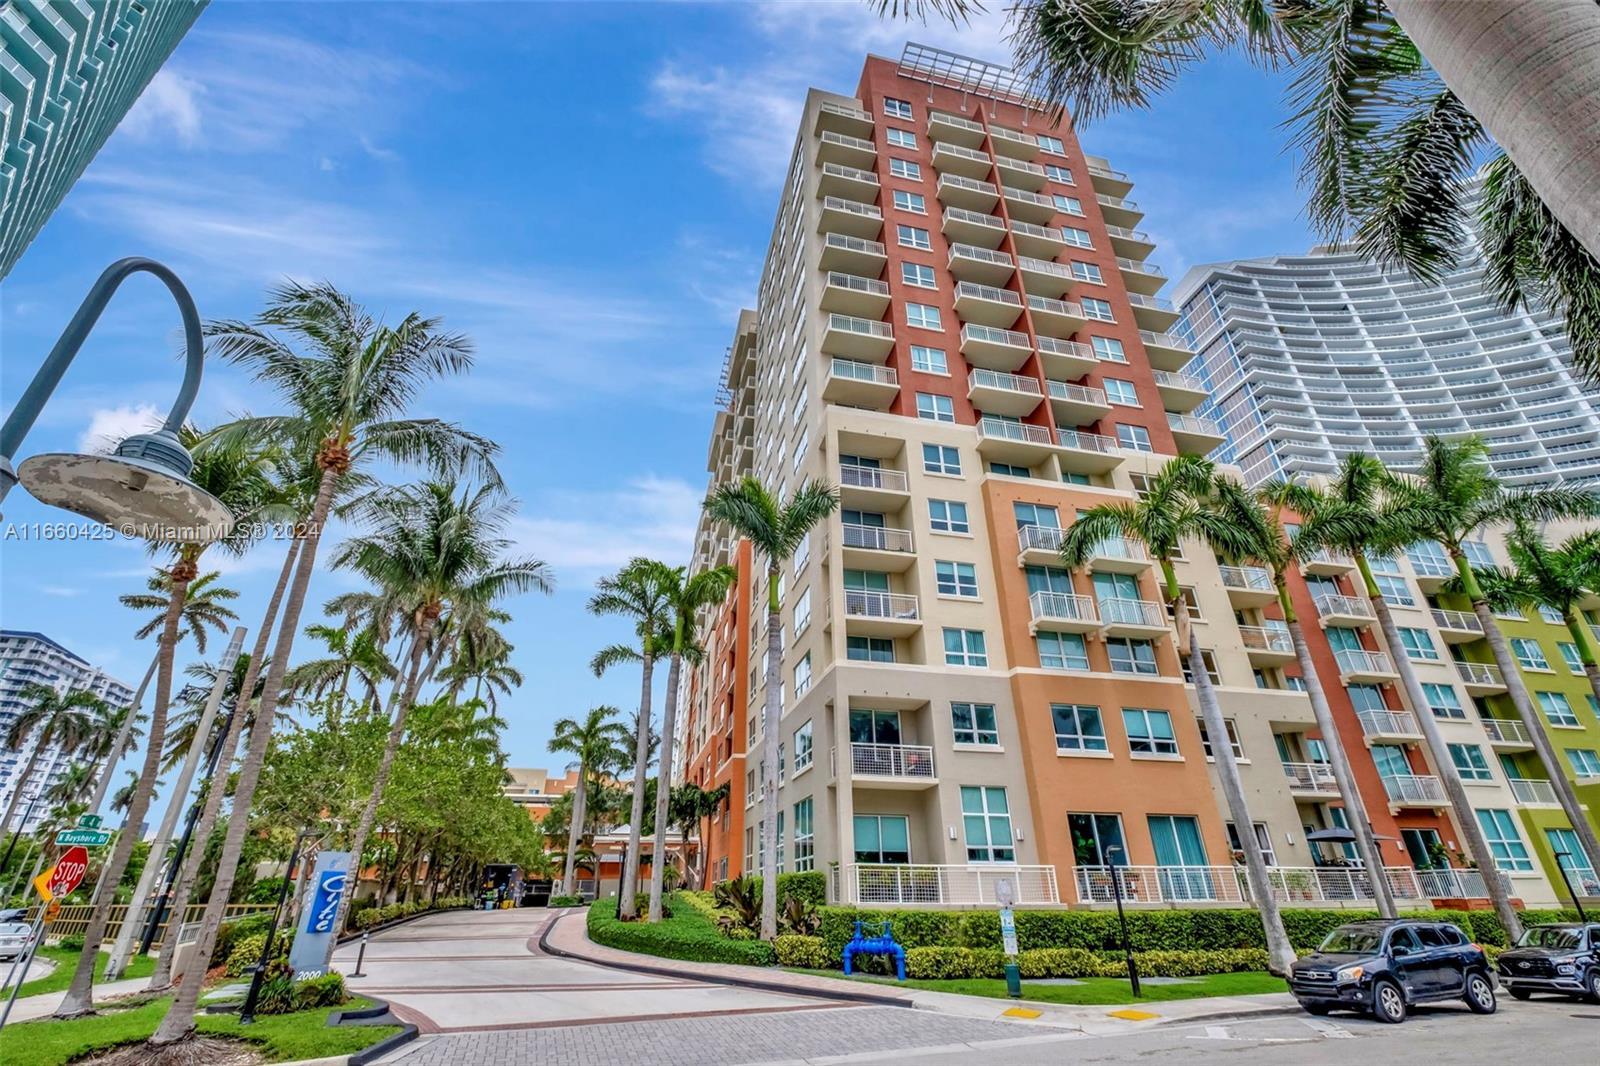
2000 N Bayshore Dr, Miami, FL 33137
$-2,150
Cash flow
-20.6%
Cash-on-Cash Return
1.4%
Cap rate
0.6%
Rent to Value Ratio
Active
$3,250,000
5
bds
|
4
ba
|
3,702
sqft
|
built
2007
433 NW 127th Ave, Miami, FL 33182
$-10,536
Cash flow
-16.9%
Cash-on-Cash Return
2.3%
Cap rate
0.3%
Rent to Value Ratio
Active
$2,675,000
4
bds
|
4
ba
|
4,849
sqft
|
built
1979
4020 SW 129th Ave, Miami, FL 33175
$-8,219
Cash flow
-16.0%
Cash-on-Cash Return
2.5%
Cap rate
0.4%
Rent to Value Ratio
Active
$400,000
bds
|
1
ba
|
638
sqft
|
built
2006
690 SW 1st Ct, Miami, FL 33130
$-539
Cash flow
-7.0%
Cash-on-Cash Return
4.5%
Cap rate
0.7%
Rent to Value Ratio

Active
$595,000
2
bds
|
2
ba
|
1,560
sqft
|
built
1984
20281 E Country Club Dr, Miami, FL 33180
$-992
Cash flow
-8.7%
Cash-on-Cash Return
4.1%
Cap rate
0.7%
Rent to Value Ratio
Active
$775,000
4
bds
|
2
ba
|
1,057
sqft
|
built
1951
280 NW 51st St, Miami, FL 33127
$-1,955
Cash flow
-13.2%
Cash-on-Cash Return
3.1%
Cap rate
0.5%
Rent to Value Ratio
Active
$520,000
3
bds
|
2
ba
|
1,200
sqft
|
built
2017
1933 NW 85th St, Miami, FL 33147
$-908
Cash flow
-9.1%
Cash-on-Cash Return
4.1%
Cap rate
0.6%
Rent to Value Ratio
Active
$565,000
1
bds
|
2
ba
|
952
sqft
|
built
2006
41 SE 5th St, Miami, FL 33131
$-1,983
Cash flow
-18.3%
Cash-on-Cash Return
1.9%
Cap rate
0.6%
Rent to Value Ratio

Active
$895,000
5
bds
|
3
ba
|
1,572
sqft
|
built
1949
530 NW 53rd St, Miami, FL 33127
$-2,816
Cash flow
-16.4%
Cash-on-Cash Return
2.4%
Cap rate
0.4%
Rent to Value Ratio
Active
$1,190,000
2
bds
|
3
ba
|
1,547
sqft
|
built
2019
851 NE 1st Ave, Miami, FL 33132
$-4,764
Cash flow
-20.9%
Cash-on-Cash Return
1.3%
Cap rate
0.7%
Rent to Value Ratio
Active
$640,000
1
bds
|
2
ba
|
826
sqft
|
built
2017
55 SW 9th St, Miami, FL 33130
$-2,042
Cash flow
-16.6%
Cash-on-Cash Return
2.3%
Cap rate
0.6%
Rent to Value Ratio
Active
$715,000
2
bds
|
2
ba
|
1,267
sqft
|
built
2006
41 SE 5th St, Miami, FL 33131
$-2,708
Cash flow
-19.8%
Cash-on-Cash Return
1.6%
Cap rate
0.6%
Rent to Value Ratio
Active
$475,000
1
bds
|
2
ba
|
825
sqft
|
built
2007
185 SW 7th St, Miami, FL 33130
$-1,485
Cash flow
-16.3%
Cash-on-Cash Return
2.4%
Cap rate
0.7%
Rent to Value Ratio

Active
$775,000
2
bds
|
3
ba
|
1,237
sqft
|
built
2007
665 NE 25th St, Miami, FL 33137
$-3,114
Cash flow
-21.0%
Cash-on-Cash Return
1.3%
Cap rate
0.6%
Rent to Value Ratio
Active
$1,250,000
6
bds
|
0
ba
|
2,723
sqft
|
built
2008
415 NW 52nd St, Miami, FL 33127
$-5,110
Cash flow
-21.3%
Cash-on-Cash Return
1.2%
Cap rate
0.3%
Rent to Value Ratio

Active
$370,000
4
bds
|
2
ba
|
1,282
sqft
|
built
1992
15241 SW 80th St, Miami, FL 33193
$-651
Cash flow
-9.2%
Cash-on-Cash Return
4.0%
Cap rate
0.8%
Rent to Value Ratio
Active
$2,399,000
4
bds
|
3
ba
|
2,189
sqft
|
built
1957
3551 E Glencoe St, Miami, FL 33133
$-6,720
Cash flow
-14.6%
Cash-on-Cash Return
2.8%
Cap rate
0.4%
Rent to Value Ratio
Active
$749,000
1
bds
|
2
ba
|
810
sqft
|
built
2016
68 SE 6th St, Miami, FL 33131
$-2,477
Cash flow
-17.3%
Cash-on-Cash Return
2.2%
Cap rate
0.7%
Rent to Value Ratio
Active
$825,000
2
bds
|
2
ba
|
1,095
sqft
|
built
2015
460 NE 28th St, Miami, FL 33137
$-3,314
Cash flow
-21.0%
Cash-on-Cash Return
1.3%
Cap rate
0.6%
Rent to Value Ratio
Active
$2,249,999
5
bds
|
4
ba
|
4,078
sqft
|
built
1973
19400 SW 232nd St, Miami, FL 33170
$-5,961
Cash flow
-13.8%
Cash-on-Cash Return
3.0%
Cap rate
0.4%
Rent to Value Ratio
Active
$299,000
1
bds
|
1
ba
|
784
sqft
|
built
2005
234 NE 3rd St, Miami, FL 33132
$-1,101
Cash flow
-19.2%
Cash-on-Cash Return
1.7%
Cap rate
0.7%
Rent to Value Ratio
Active
$490,000
1
bds
|
2
ba
|
610
sqft
|
built
2018
501 NE 31st St, Miami, FL 33137
$-1,710
Cash flow
-18.2%
Cash-on-Cash Return
2.0%
Cap rate
0.6%
Rent to Value Ratio

Active
$570,000
5
bds
|
3
ba
|
936
sqft
|
built
1951
14025 Jackson St, Miami, FL 33176
$-1,173
Cash flow
-10.7%
Cash-on-Cash Return
3.7%
Cap rate
0.5%
Rent to Value Ratio