Miami, FL Investment Properties for Sale
Browse homes for sale and investment properties in Miami, FL. Refine your search by price, property type, or more.
Best cash flowing properties in Miami, FL
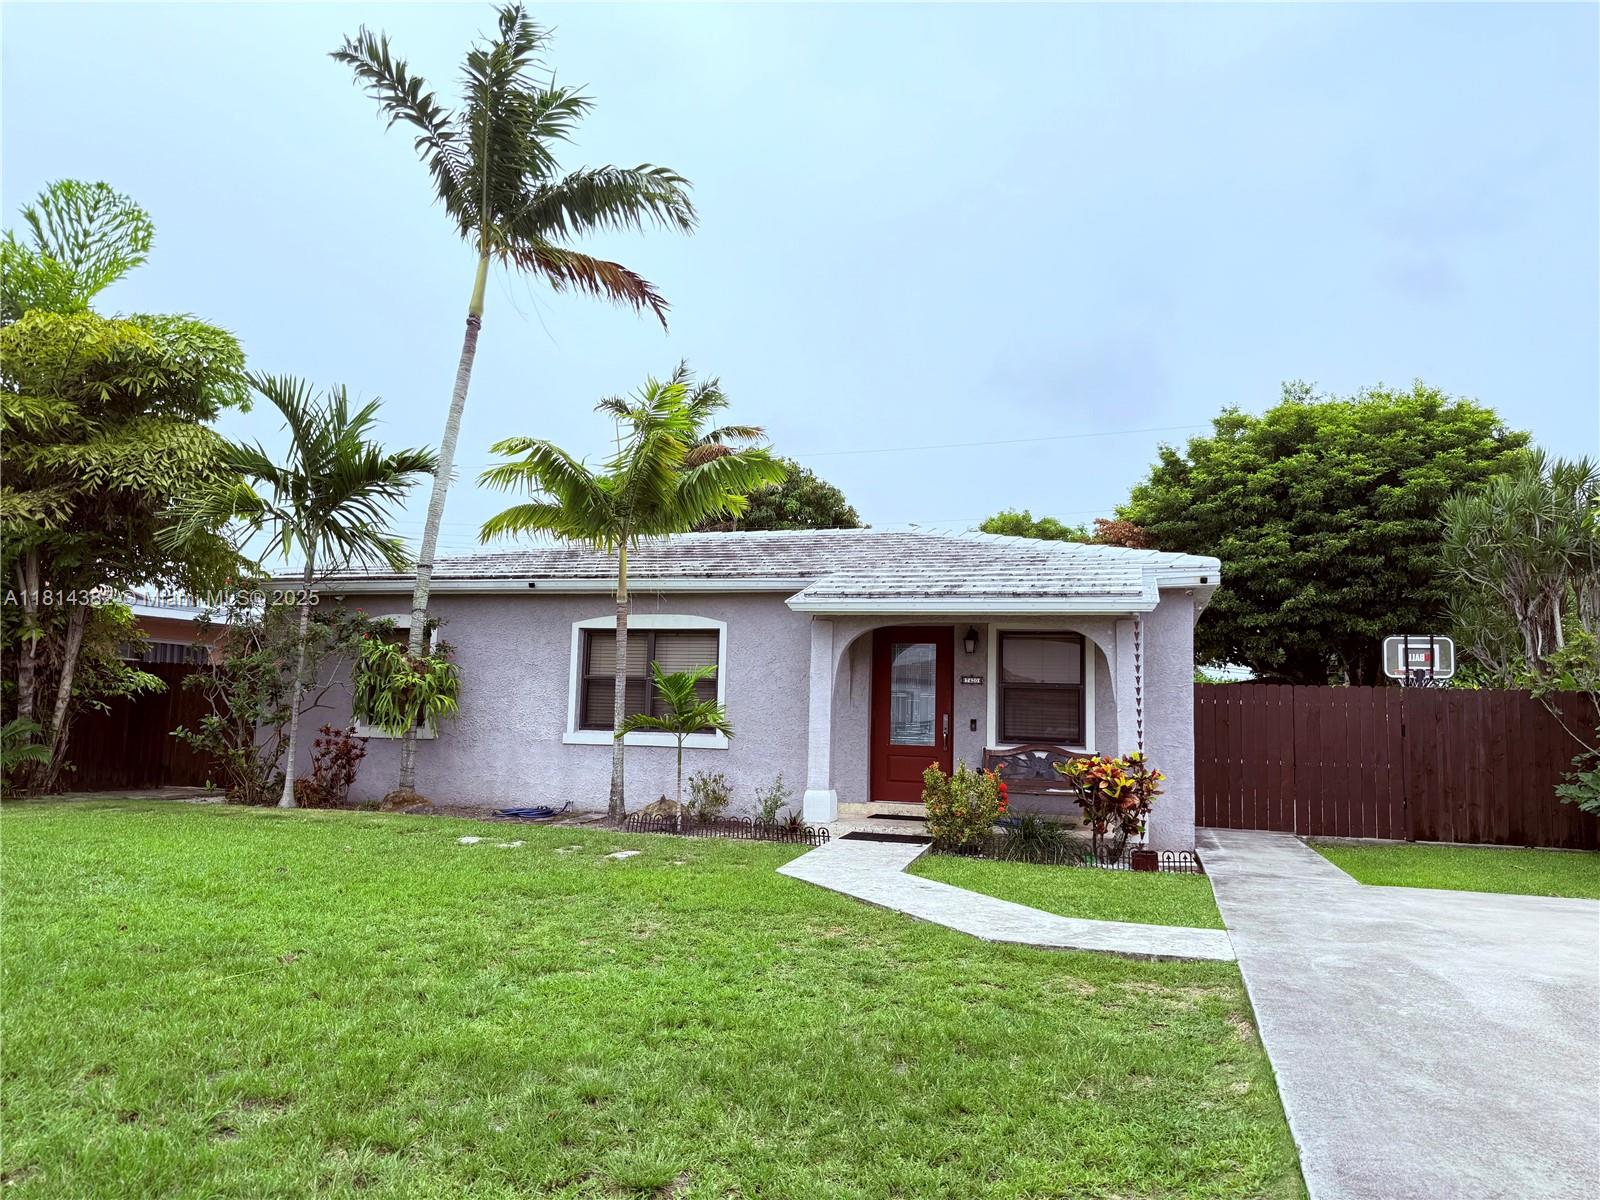
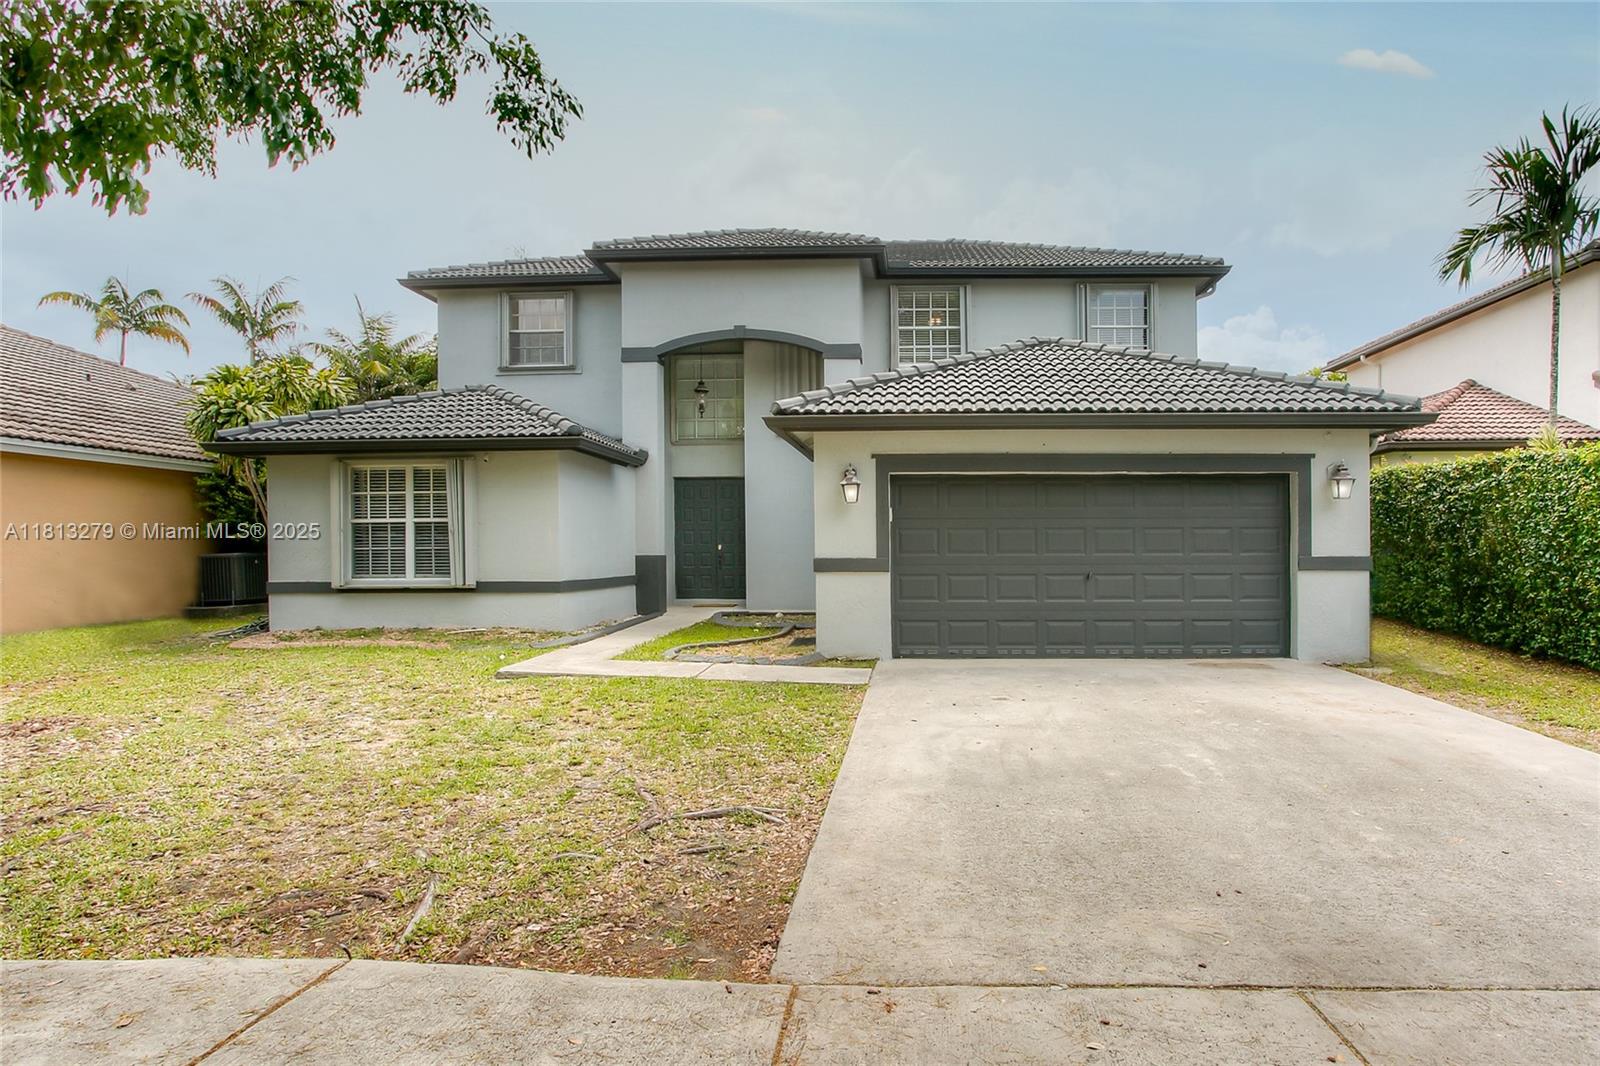
Active
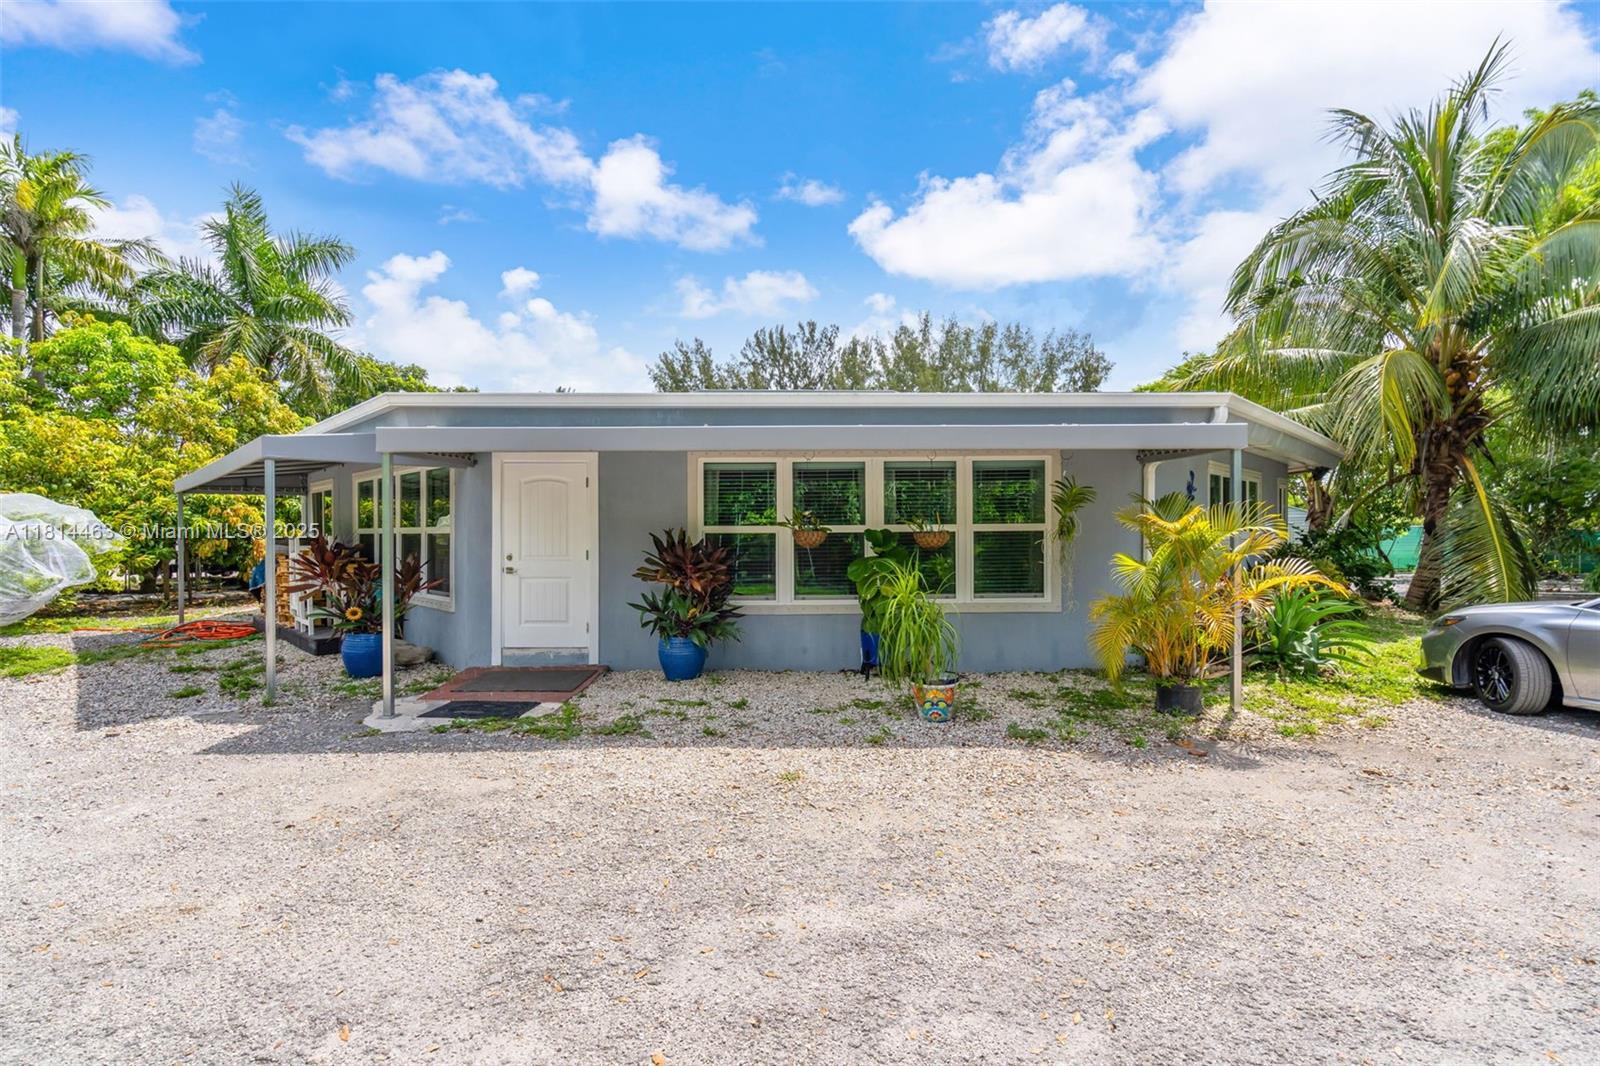
$270,000
2
bds
|
2
ba
|
750
sqft
|
built
1982
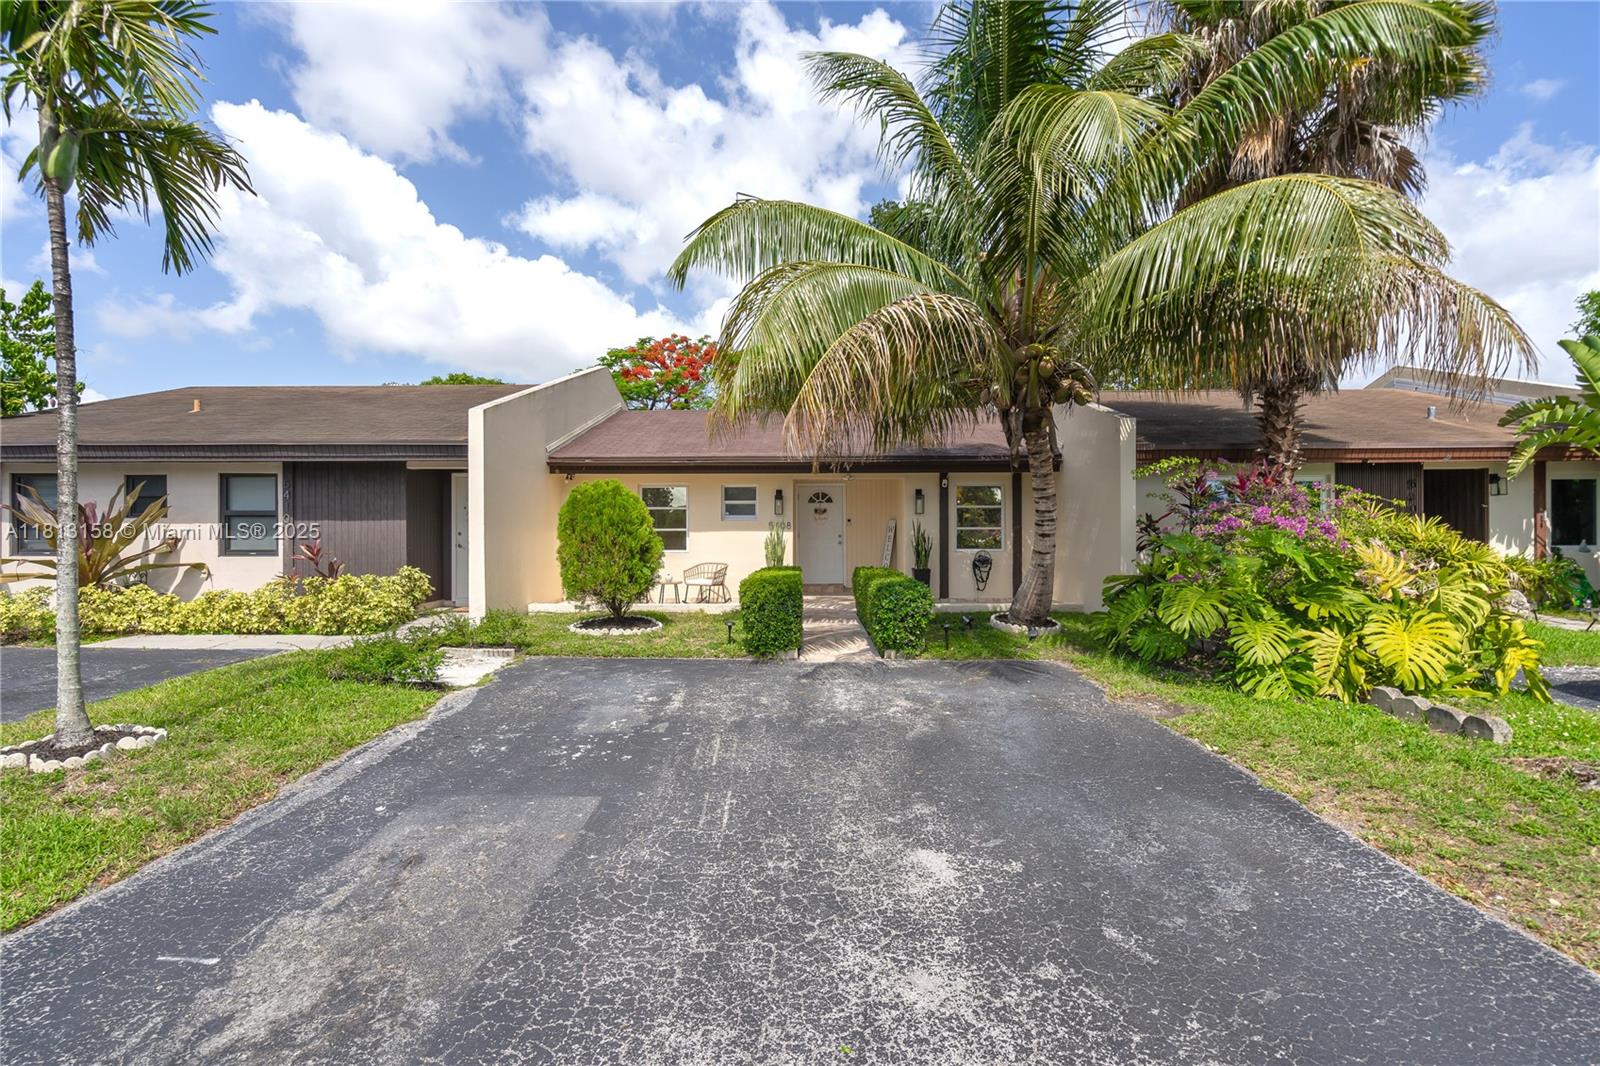
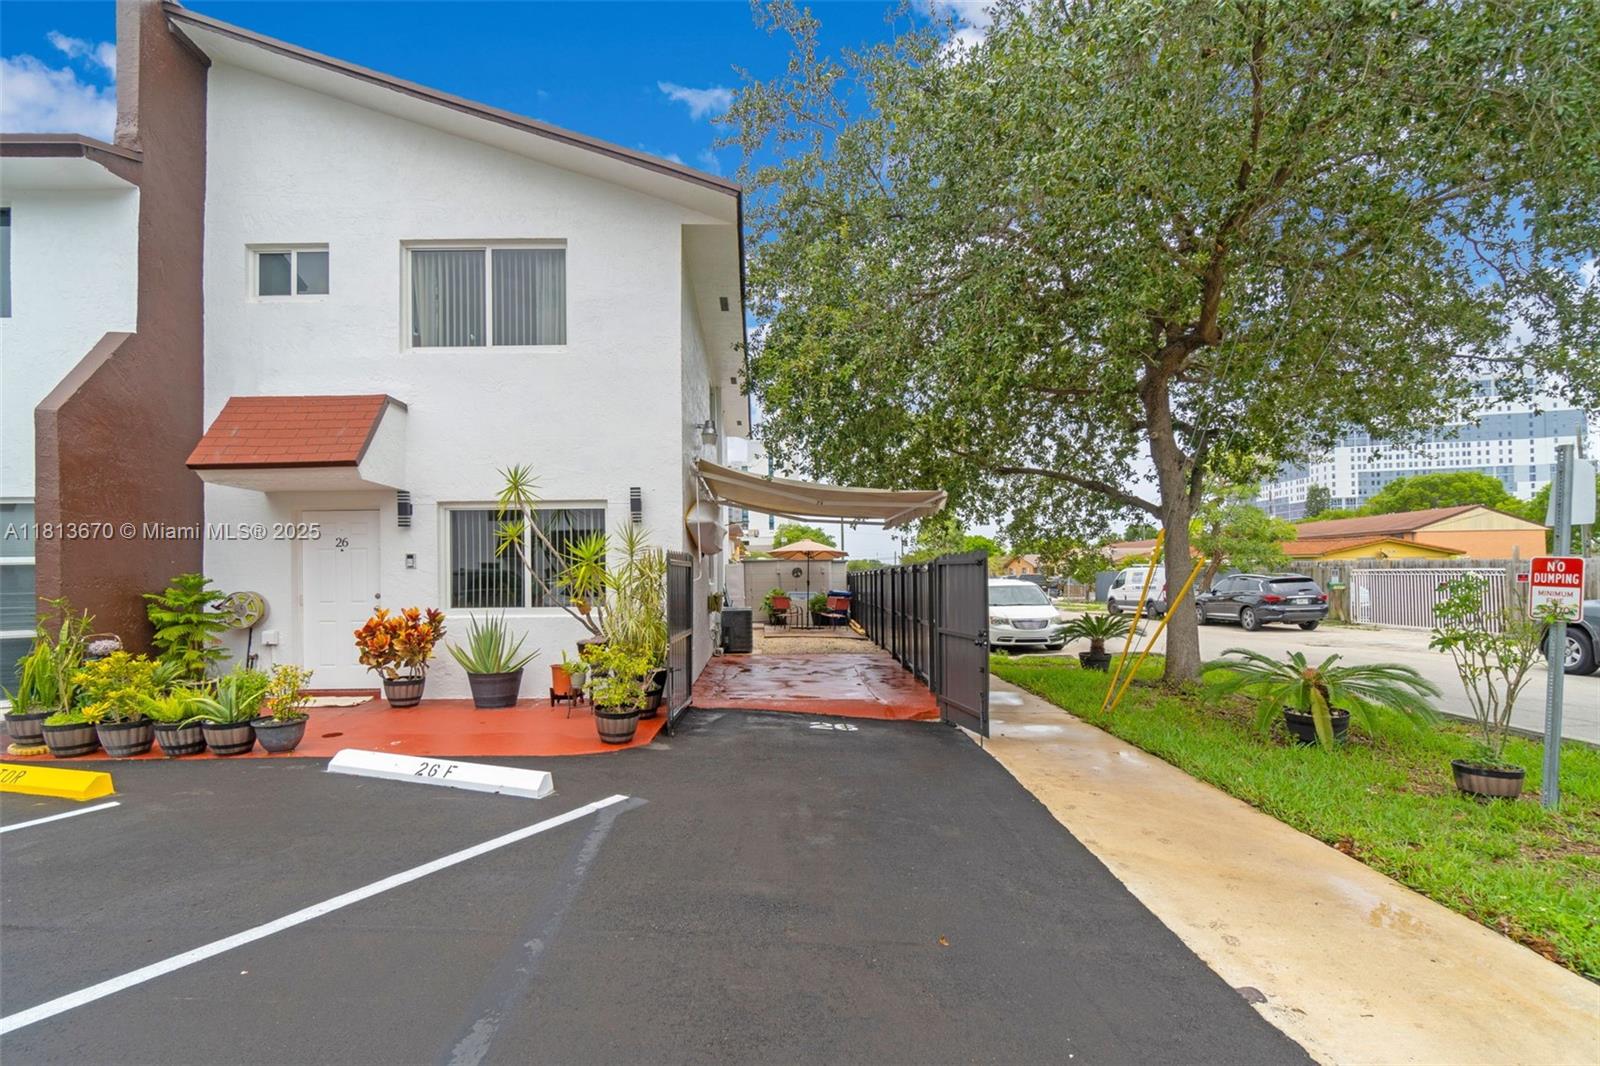
7662 SW 152nd Ave, Miami, FL 33193
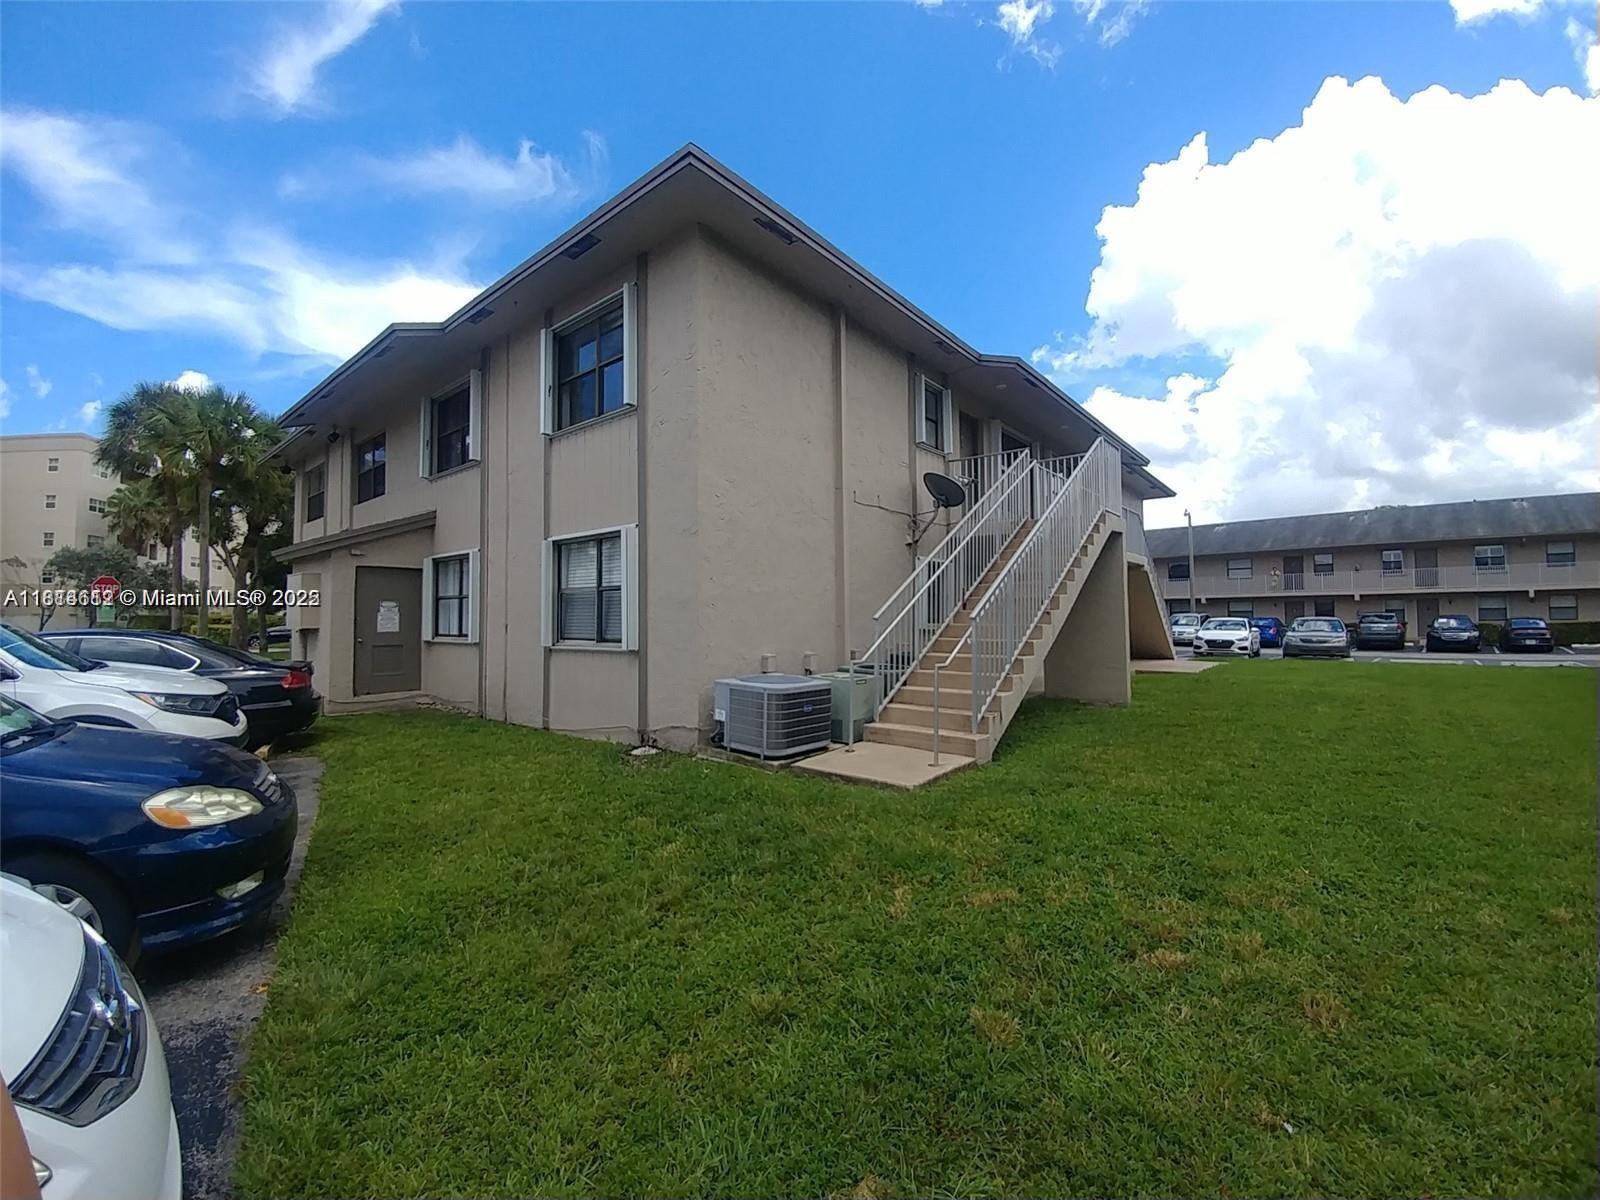
$-376
Cash flow
-7.3%
Cash-on-Cash Return
4.5%
Cap rate
0.9%
Rent to Value Ratio

Active
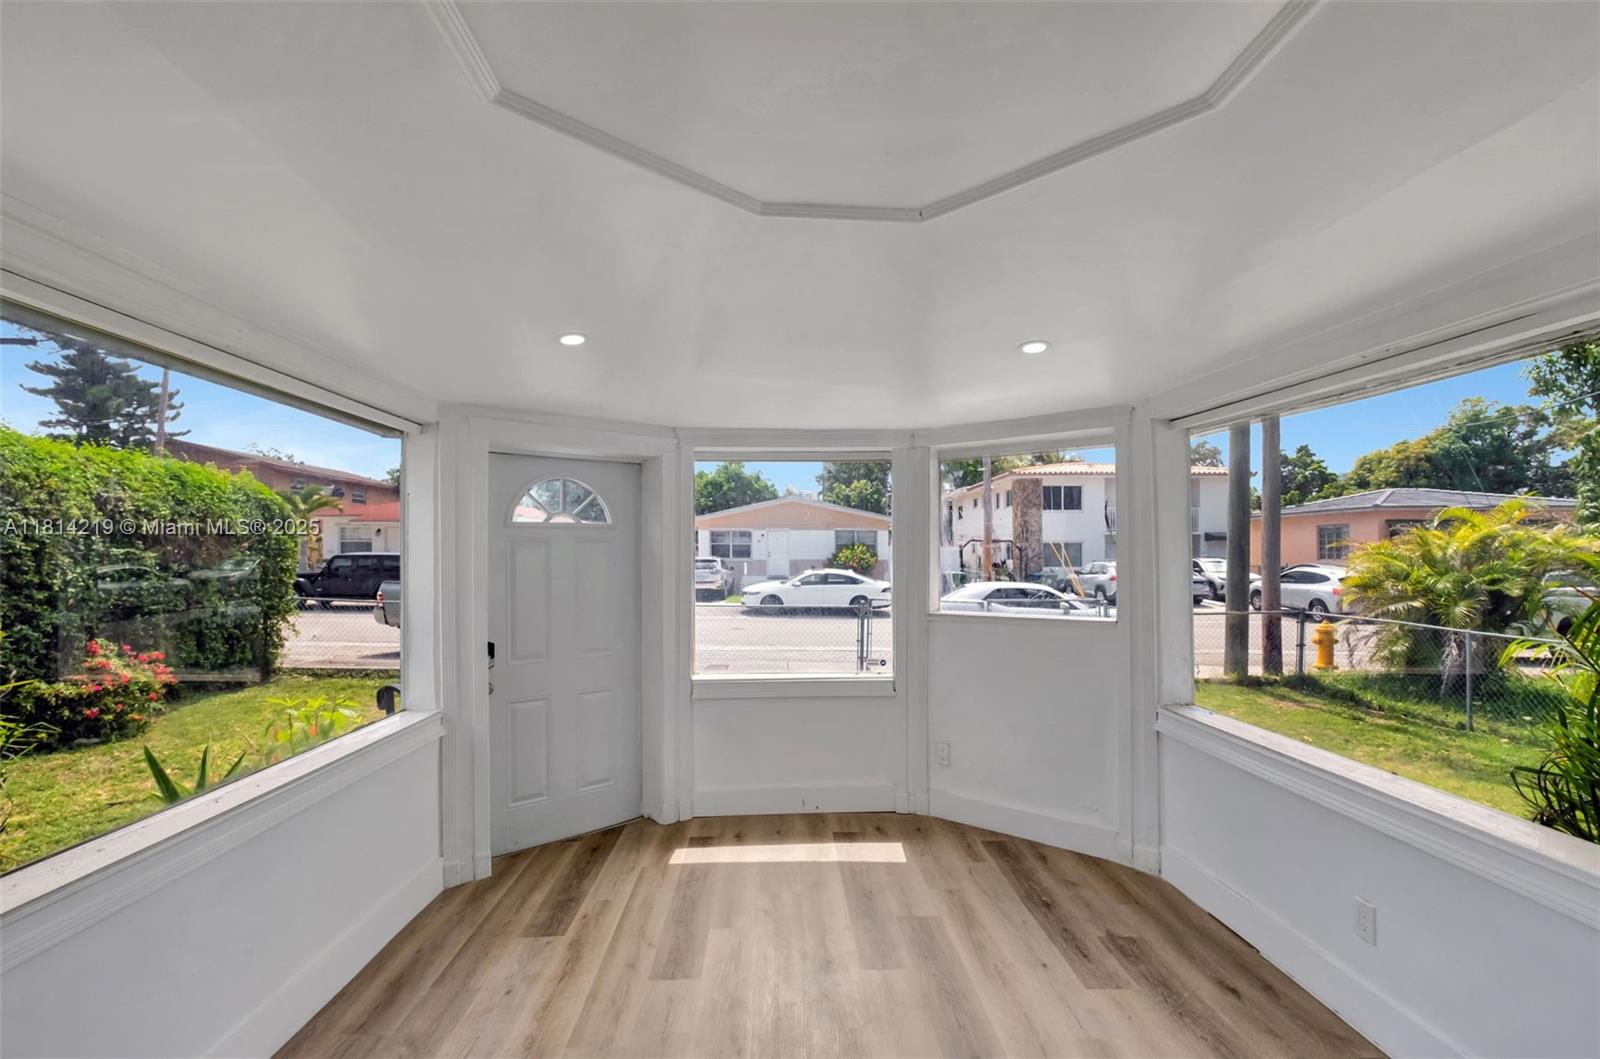
$349,000
2
bds
|
3
ba
|
1,210
sqft
|
built
1988
15410 SW 74th Circle Ct, Miami, FL 33193
$-611
Cash flow
-9.1%
Cash-on-Cash Return
4.0%
Cap rate
0.8%
Rent to Value Ratio
6,233 out of 7,077 properties for sale in Miami, FL
Limited Results Shown
Create a free account, or log in to reveal all property listings and enjoy the complete experience.
Active
$589,950
3
bds
|
3
ba
|
1,677
sqft
|
built
1997
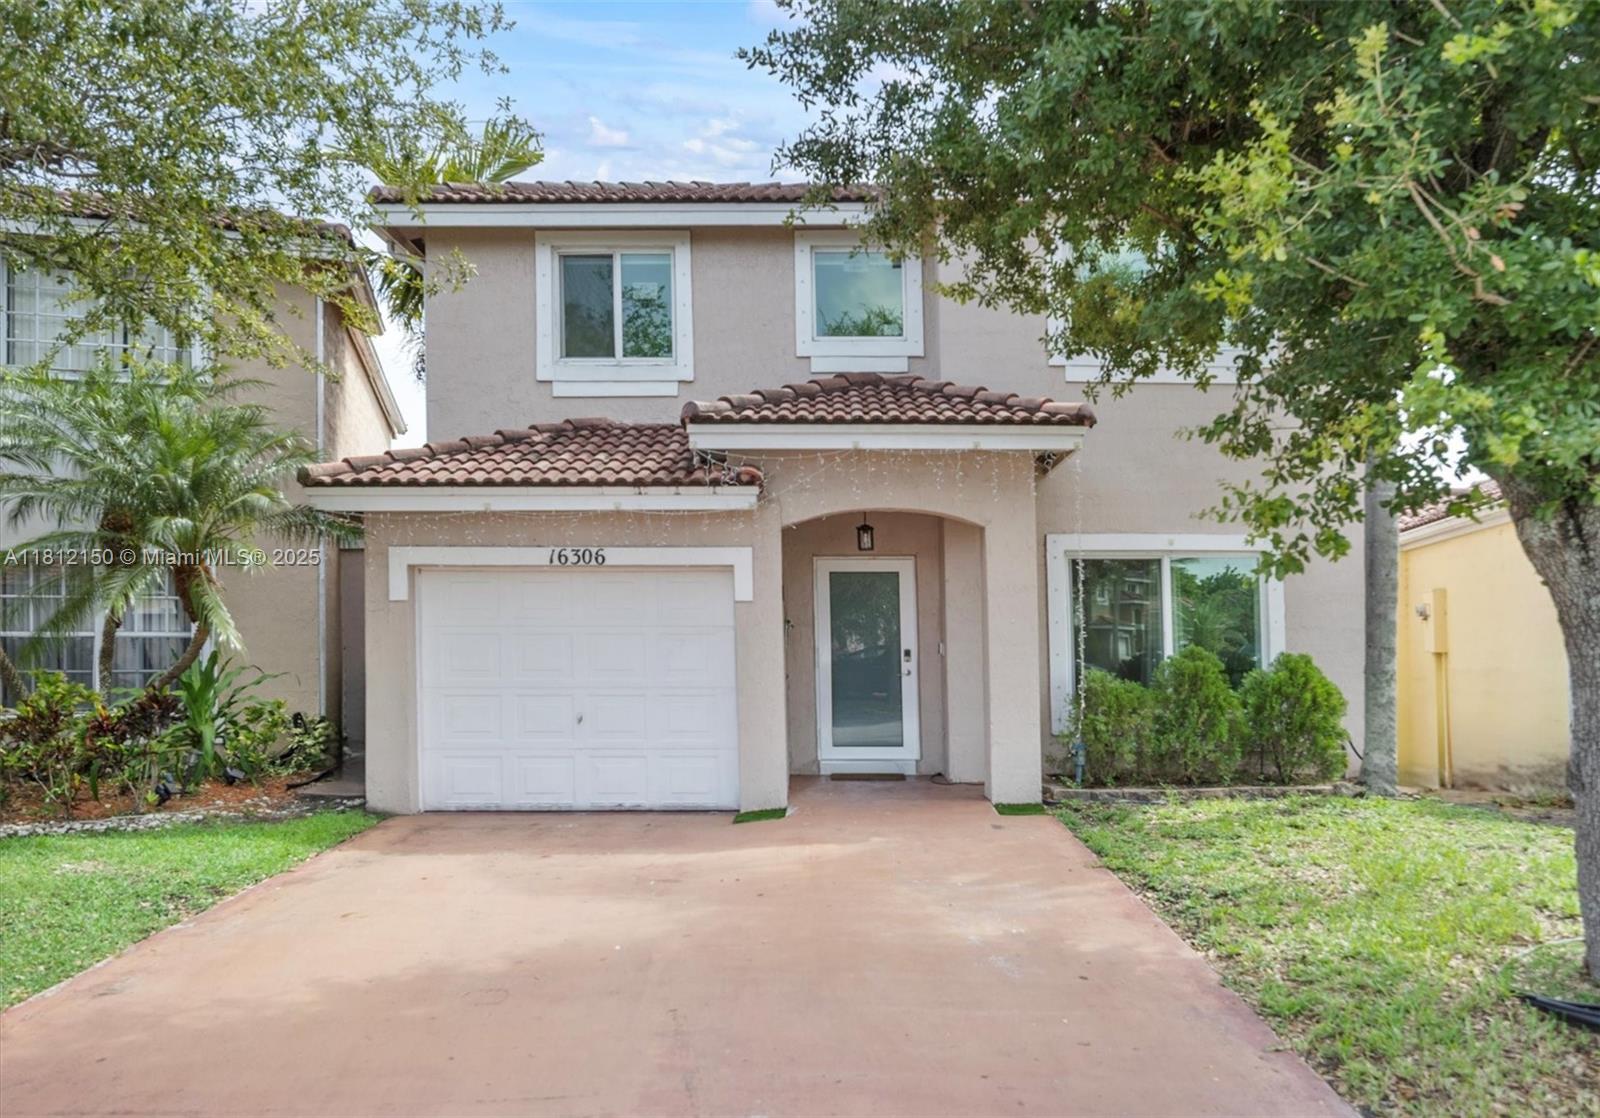
16306 SW 100th Ter, Miami, FL 33196
$-1,472
Cash flow
-13.0%
Cash-on-Cash Return
3.2%
Cap rate
0.6%
Rent to Value Ratio

Active
$735,000
2
bds
|
2
ba
|
1,215
sqft
|
built
2007
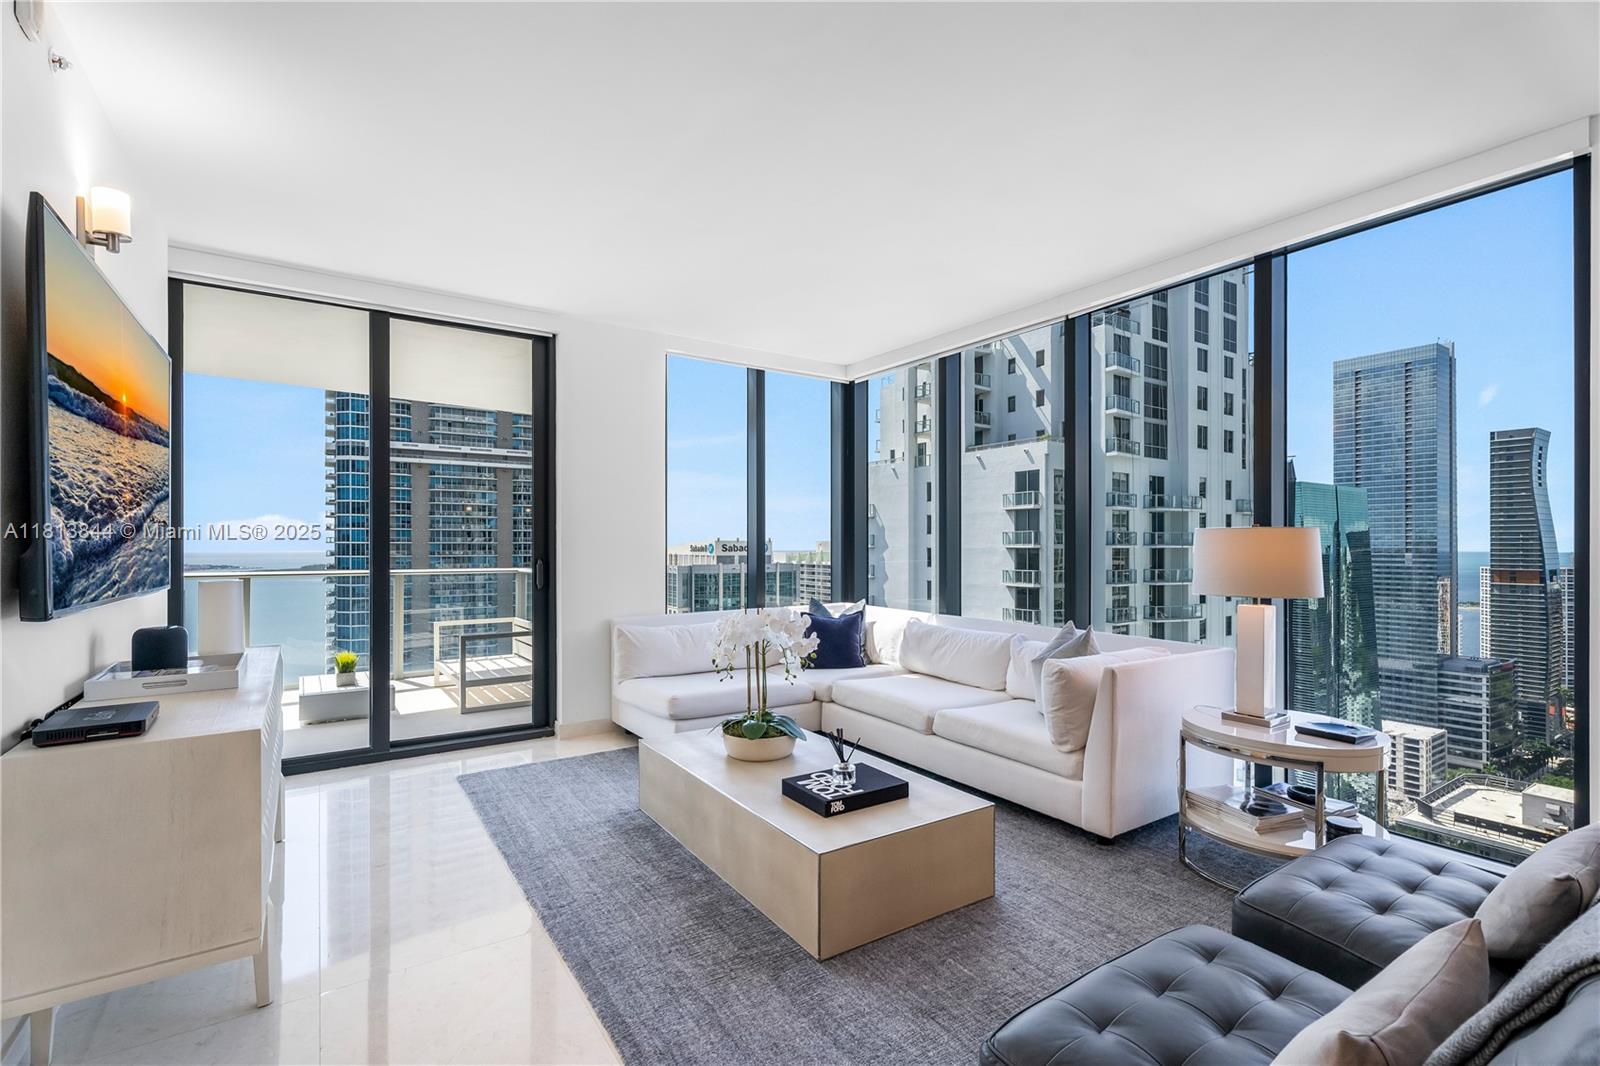
3250 NE 1st Ave, Miami, FL 33137
$-3,502
Cash flow
-24.9%
Cash-on-Cash Return
0.4%
Cap rate
0.6%
Rent to Value Ratio
Active
$479,000
2
bds
|
3
ba
|
1,755
sqft
|
built
1981
1456 SW 134th Pl, Miami, FL 33184
$-824
Cash flow
-9.0%
Cash-on-Cash Return
4.1%
Cap rate
0.6%
Rent to Value Ratio

Active
$760,000
4
bds
|
2
ba
|
1,649
sqft
|
built
2003
12661 SW 222nd Ter, Miami, FL 33170
$-1,863
Cash flow
-12.8%
Cash-on-Cash Return
3.2%
Cap rate
0.4%
Rent to Value Ratio
Active
$875,000
4
bds
|
2
ba
|
1,772
sqft
|
built
1952
8331 SW 38th St, Miami, FL 33155
$-2,200
Cash flow
-13.1%
Cash-on-Cash Return
3.1%
Cap rate
0.4%
Rent to Value Ratio
Active
$430,000
2
bds
|
1
ba
|
835
sqft
|
built
1977
5408 SW 138th Ave, Miami, FL 33175
$-817
Cash flow
-9.9%
Cash-on-Cash Return
3.9%
Cap rate
0.6%
Rent to Value Ratio
Active
$950,000
2
bds
|
2
ba
|
1,322
sqft
|
built
2007
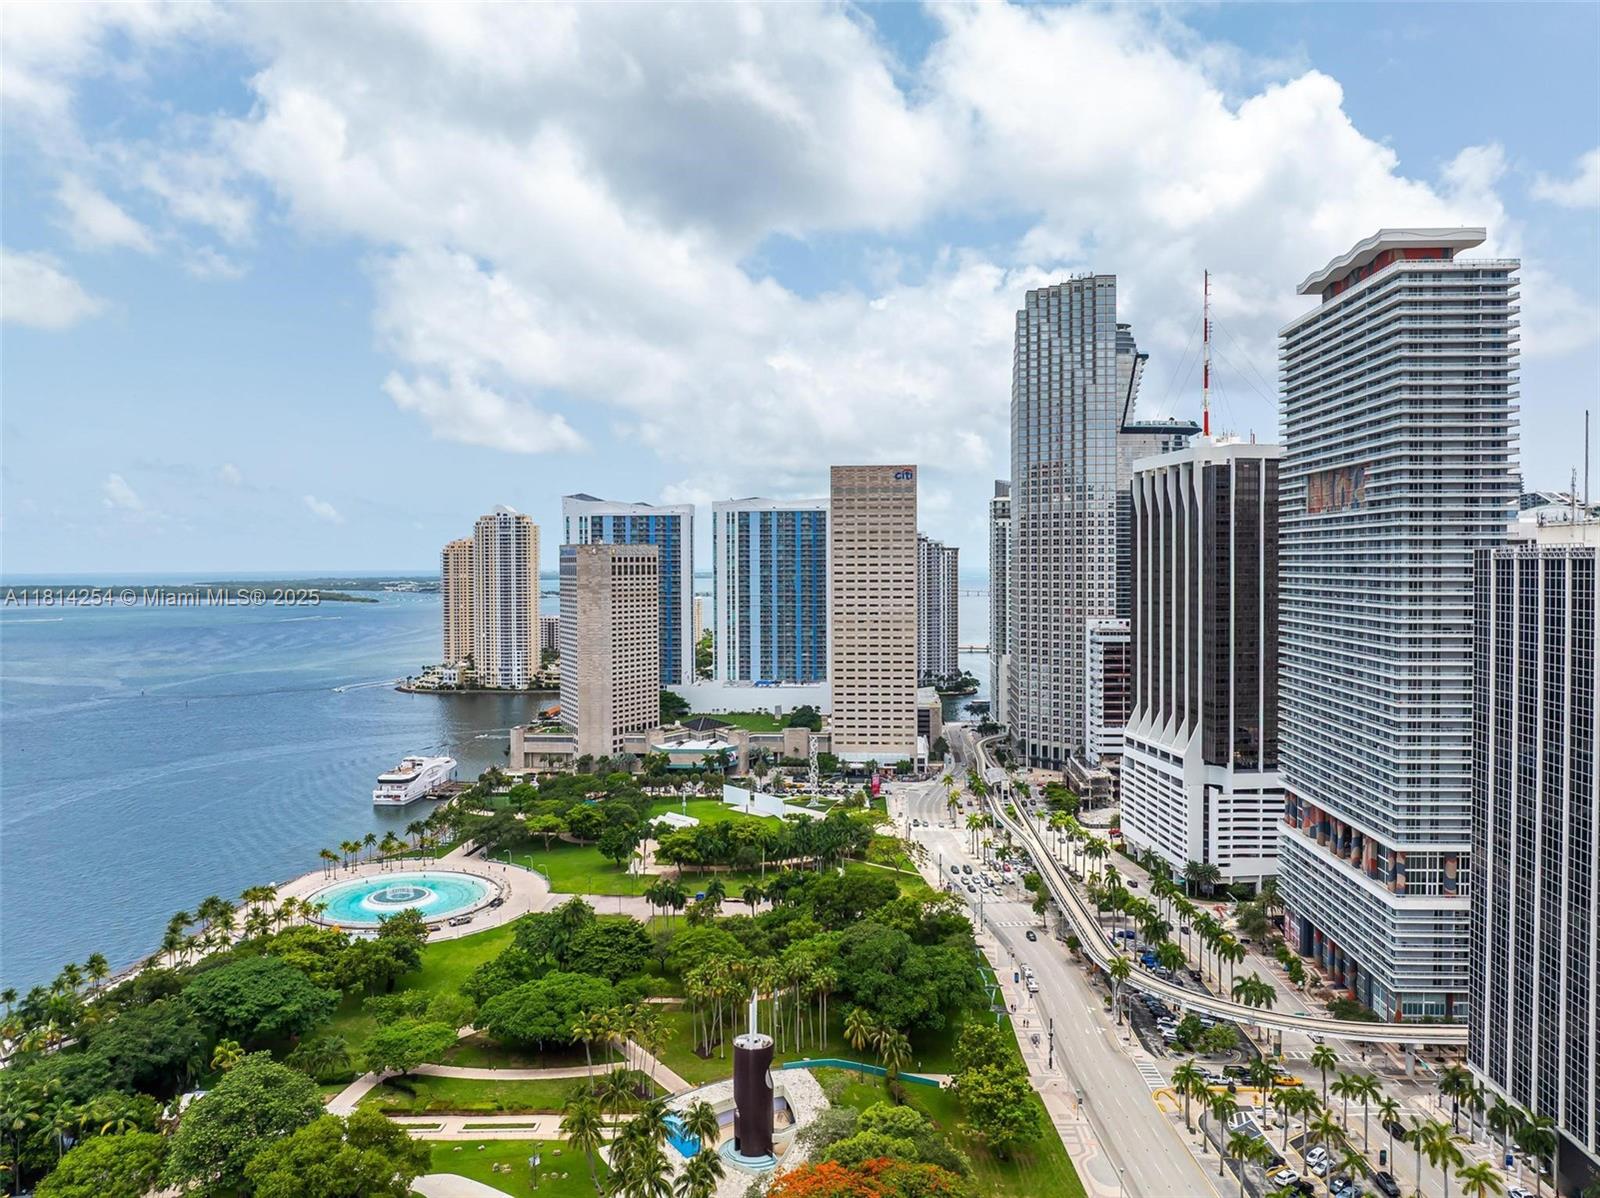
50 Biscayne Blvd, Miami, FL 33132
$-3,274
Cash flow
-18.0%
Cash-on-Cash Return
2.0%
Cap rate
0.7%
Rent to Value Ratio
Active
$1,250,000
bds
|
0
ba
|
2,200
sqft
|
built
1935
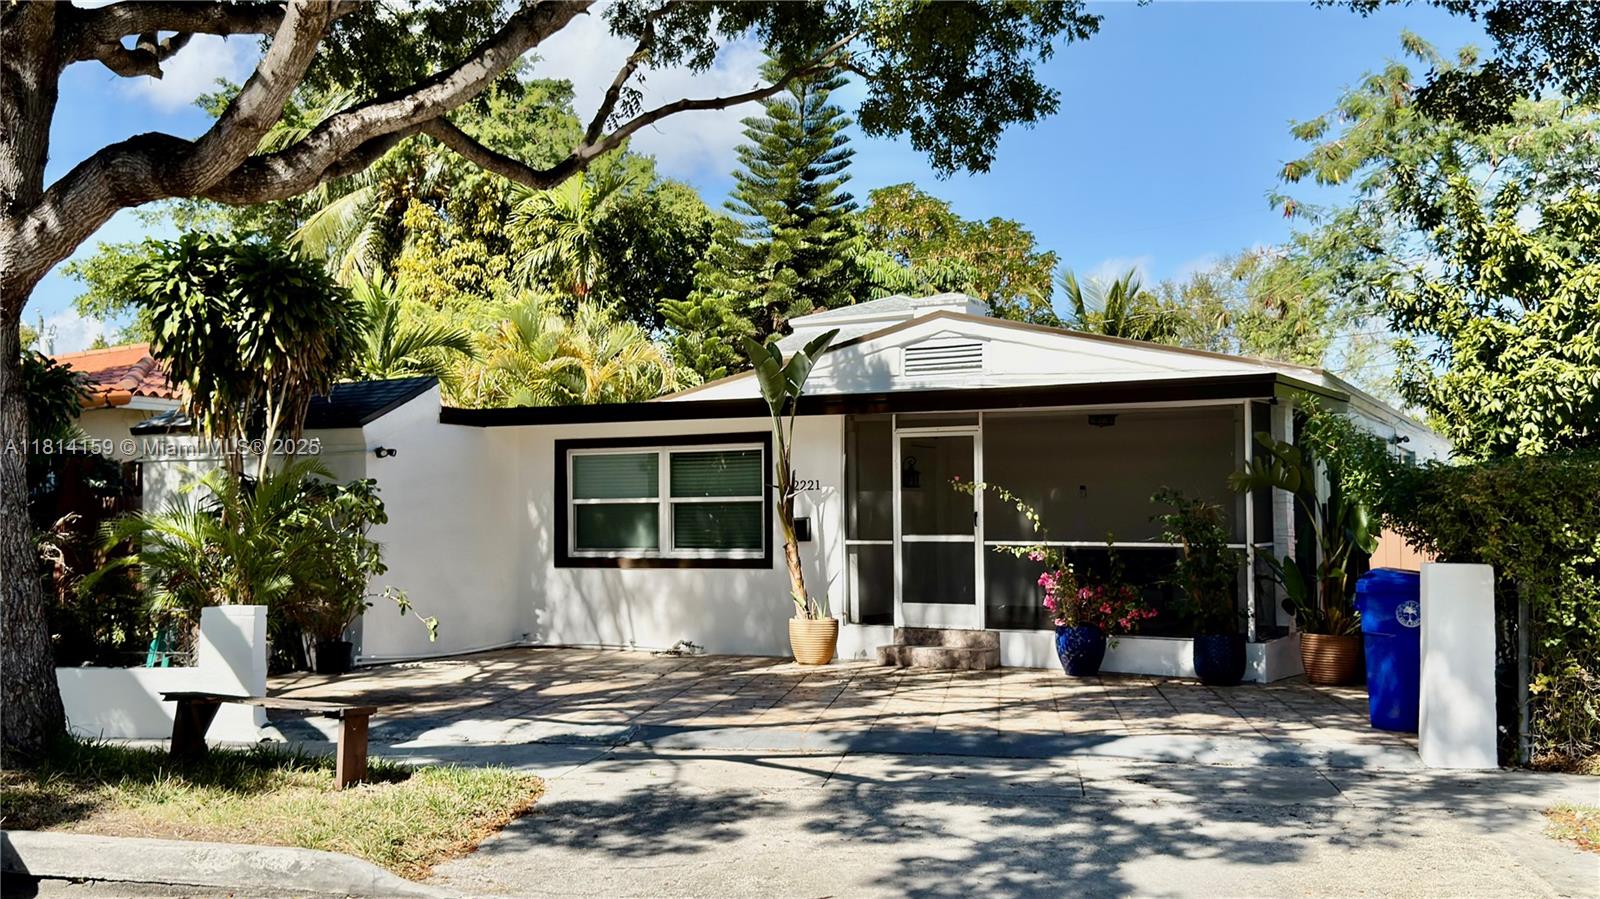
2221 SW 26th Ln, Miami, FL 33133
$-4,797
Cash flow
-20.0%
Cash-on-Cash Return
1.5%
Cap rate
0.3%
Rent to Value Ratio
Active
$388,000
3
bds
|
3
ba
|
1,672
sqft
|
built
2006
11257 SW 231st Ln, Miami, FL 33170
$-847
Cash flow
-11.4%
Cash-on-Cash Return
3.5%
Cap rate
0.7%
Rent to Value Ratio
Active
$699,000
1
bds
|
1
ba
|
534
sqft
|
built
1974
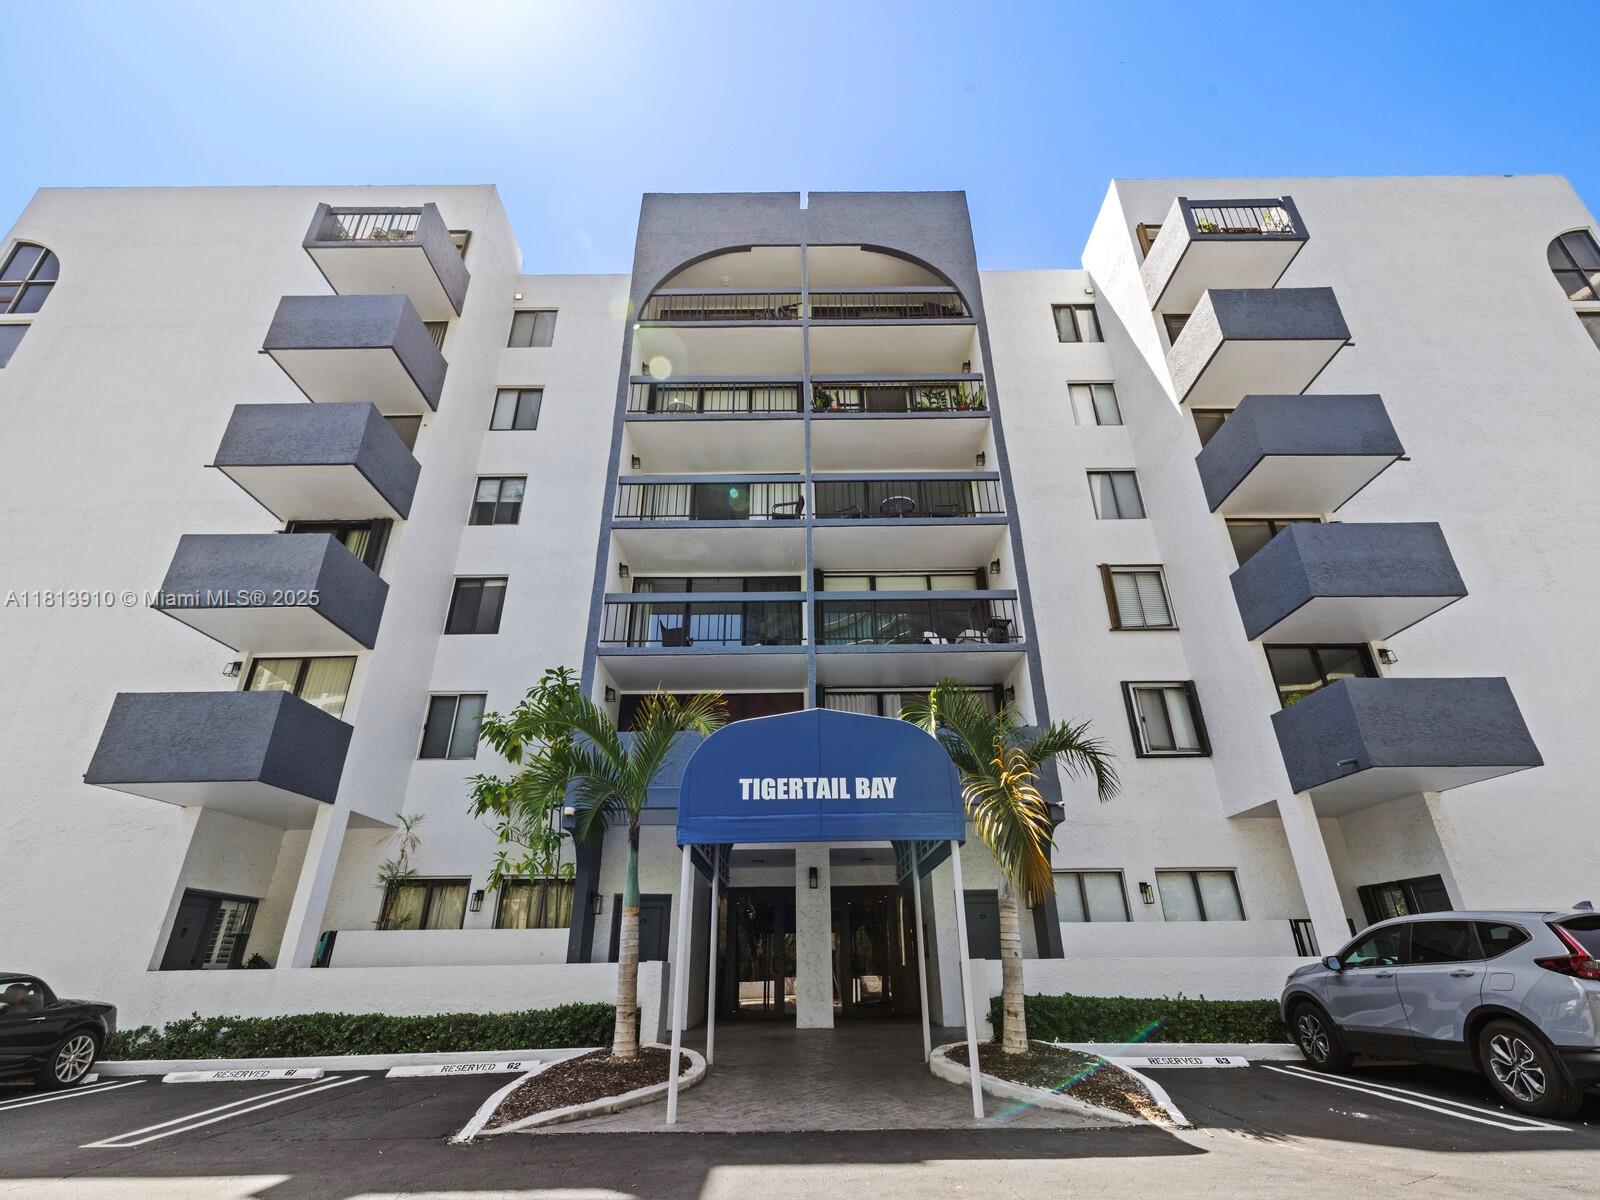
2715 Tigertail Ave, Miami, FL 33133
$-3,015
Cash flow
-22.5%
Cash-on-Cash Return
1.0%
Cap rate
0.4%
Rent to Value Ratio
Active
$649,900
3
bds
|
3
ba
|
2,076
sqft
|
built
1998
14011 SW 151st Ave, Miami, FL 33196
$-1,621
Cash flow
-13.0%
Cash-on-Cash Return
3.2%
Cap rate
0.5%
Rent to Value Ratio
Active
$470,000
1
bds
|
1
ba
|
774
sqft
|
built
2008
951 Brickell Ave, Miami, FL 33131
$-1,656
Cash flow
-18.4%
Cash-on-Cash Return
1.9%
Cap rate
0.7%
Rent to Value Ratio
Active
$552,000
1
bds
|
2
ba
|
776
sqft
|
built
2017
55 SW 9th St, Miami, FL 33130
$-1,715
Cash flow
-16.2%
Cash-on-Cash Return
2.4%
Cap rate
0.7%
Rent to Value Ratio
Active
$270,000
2
bds
|
2
ba
|
750
sqft
|
built
1982
7662 SW 152nd Ave, Miami, FL 33193
$-376
Cash flow
-7.3%
Cash-on-Cash Return
4.5%
Cap rate
0.9%
Rent to Value Ratio

Active
$950,000
4
bds
|
2
ba
|
2,153
sqft
|
built
1980
14630 SW 147th Ct, Miami, FL 33196
$-3,136
Cash flow
-17.2%
Cash-on-Cash Return
2.2%
Cap rate
0.4%
Rent to Value Ratio
Active under contract
$589,000
3
bds
|
1
ba
|
975
sqft
|
built
1953
7420 SW 34th Ter, Miami, FL 33155
$-1,403
Cash flow
-12.4%
Cash-on-Cash Return
3.3%
Cap rate
0.5%
Rent to Value Ratio
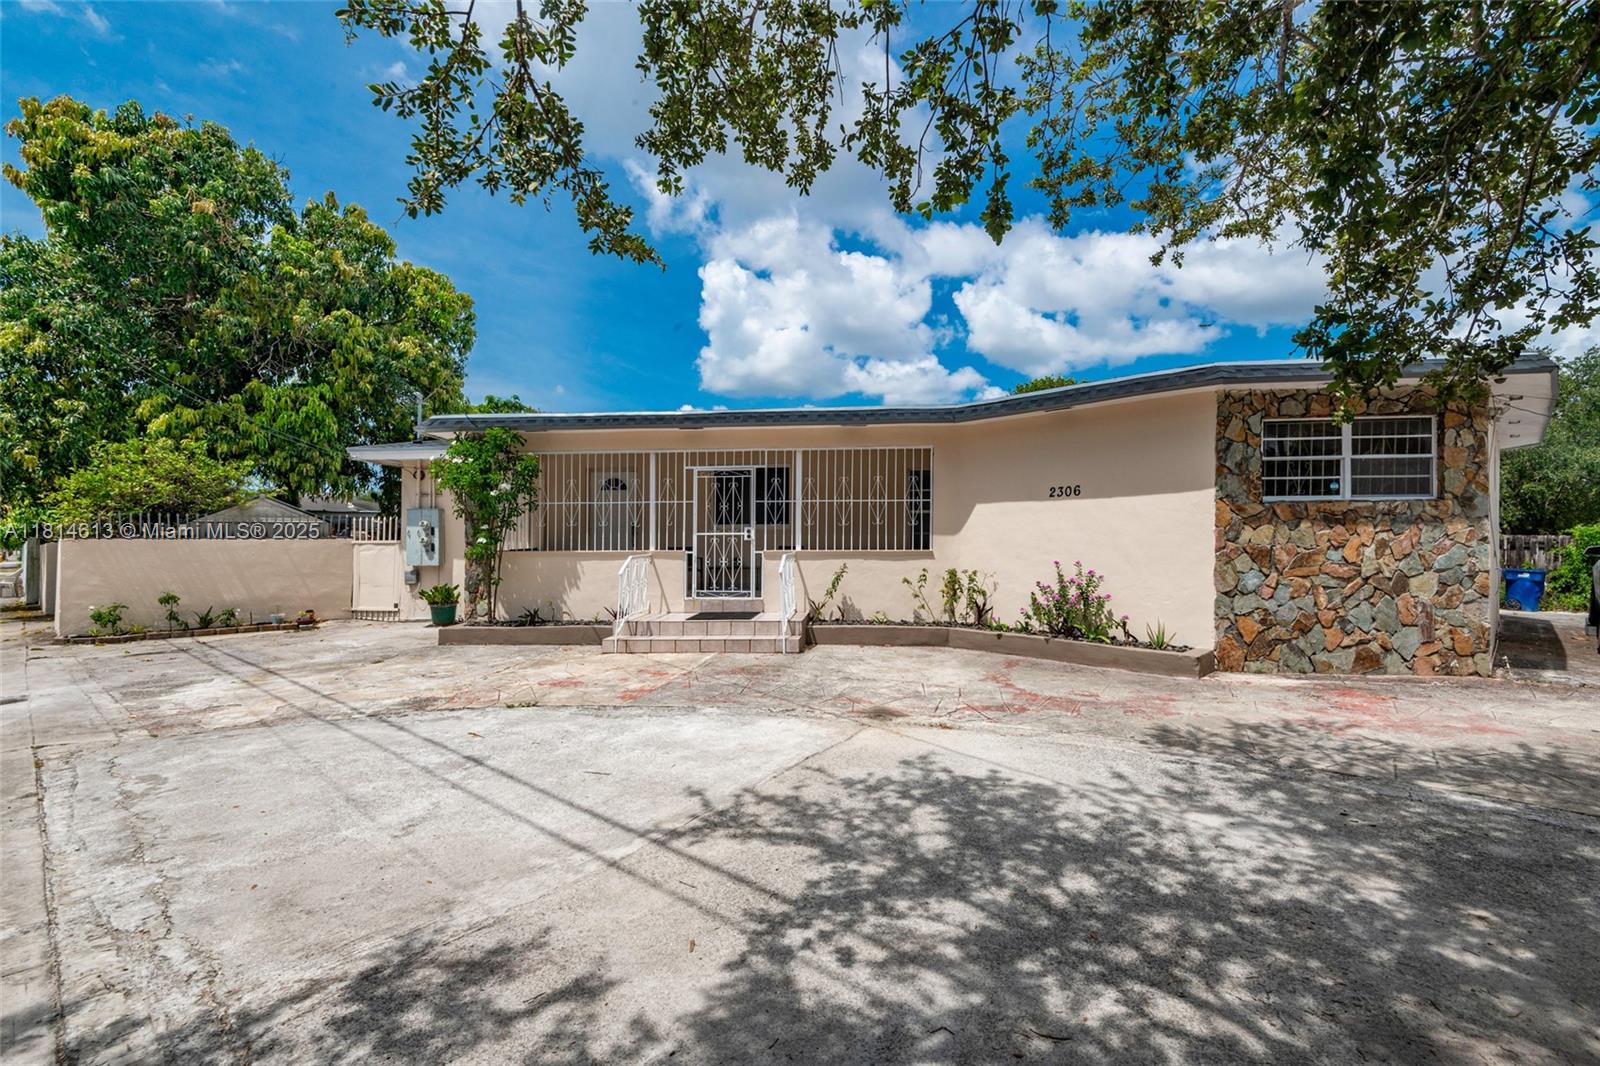
Active
$730,000
5
bds
|
0
ba
|
2,656
sqft
|
built
1950
2306 NW 102nd St, Miami, FL 33147
$-2,424
Cash flow
-17.3%
Cash-on-Cash Return
2.2%
Cap rate
0.3%
Rent to Value Ratio
Active
$890,000
4
bds
|
3
ba
|
2,504
sqft
|
built
1996
15444 SW 114th St, Miami, FL 33196
$-1,462
Cash flow
-8.6%
Cash-on-Cash Return
4.2%
Cap rate
0.7%
Rent to Value Ratio
Active
$850,000
2
bds
|
2
ba
|
910
sqft
|
built
2015
1100 S Miami Ave, Miami, FL 33130
$-3,199
Cash flow
-19.6%
Cash-on-Cash Return
1.6%
Cap rate
0.5%
Rent to Value Ratio
Active
$980,000
4
bds
|
2
ba
|
2,308
sqft
|
built
1974
15240 SW 188th St, Miami, FL 33187
$-2,208
Cash flow
-11.8%
Cash-on-Cash Return
3.4%
Cap rate
0.5%
Rent to Value Ratio
Active
$699,900
6
bds
|
2
ba
|
1,688
sqft
|
built
1934
920 SW 8th Ct, Miami, FL 33130
$-1,467
Cash flow
-10.9%
Cash-on-Cash Return
3.6%
Cap rate
0.5%
Rent to Value Ratio
Active
$799,000
3
bds
|
3
ba
|
2,149
sqft
|
built
1978
1089 NE 204th Ter, Miami, FL 33179
$-2,378
Cash flow
-15.5%
Cash-on-Cash Return
2.6%
Cap rate
0.5%
Rent to Value Ratio

Active
$900,000
2
bds
|
2
ba
|
1,374
sqft
|
built
2007
1800 N Bayshore Dr, Miami, FL 33132
$-3,026
Cash flow
-17.5%
Cash-on-Cash Return
2.1%
Cap rate
0.6%
Rent to Value Ratio
Active
$425,000
1
bds
|
2
ba
|
719
sqft
|
built
2014
31 SE 6th St, Miami, FL 33131
$-1,621
Cash flow
-19.9%
Cash-on-Cash Return
1.6%
Cap rate
0.8%
Rent to Value Ratio
Active
$1,800,000
2
bds
|
3
ba
|
1,572
sqft
|
built
2008
900 Brickell Key Blvd, Miami, FL 33131
$-8,903
Cash flow
-25.8%
Cash-on-Cash Return
0.2%
Cap rate
0.4%
Rent to Value Ratio
Active
$625,000
2
bds
|
2
ba
|
1,180
sqft
|
built
2007
1900 N Bayshore Dr, Miami, FL 33132
$-1,612
Cash flow
-13.5%
Cash-on-Cash Return
3.1%
Cap rate
0.8%
Rent to Value Ratio
Active
$1,610,000
3
bds
|
4
ba
|
1,526
sqft
|
built
2018
3131 NE 7th Ave, Miami, FL 33137
$-7,060
Cash flow
-22.9%
Cash-on-Cash Return
0.9%
Cap rate
0.5%
Rent to Value Ratio
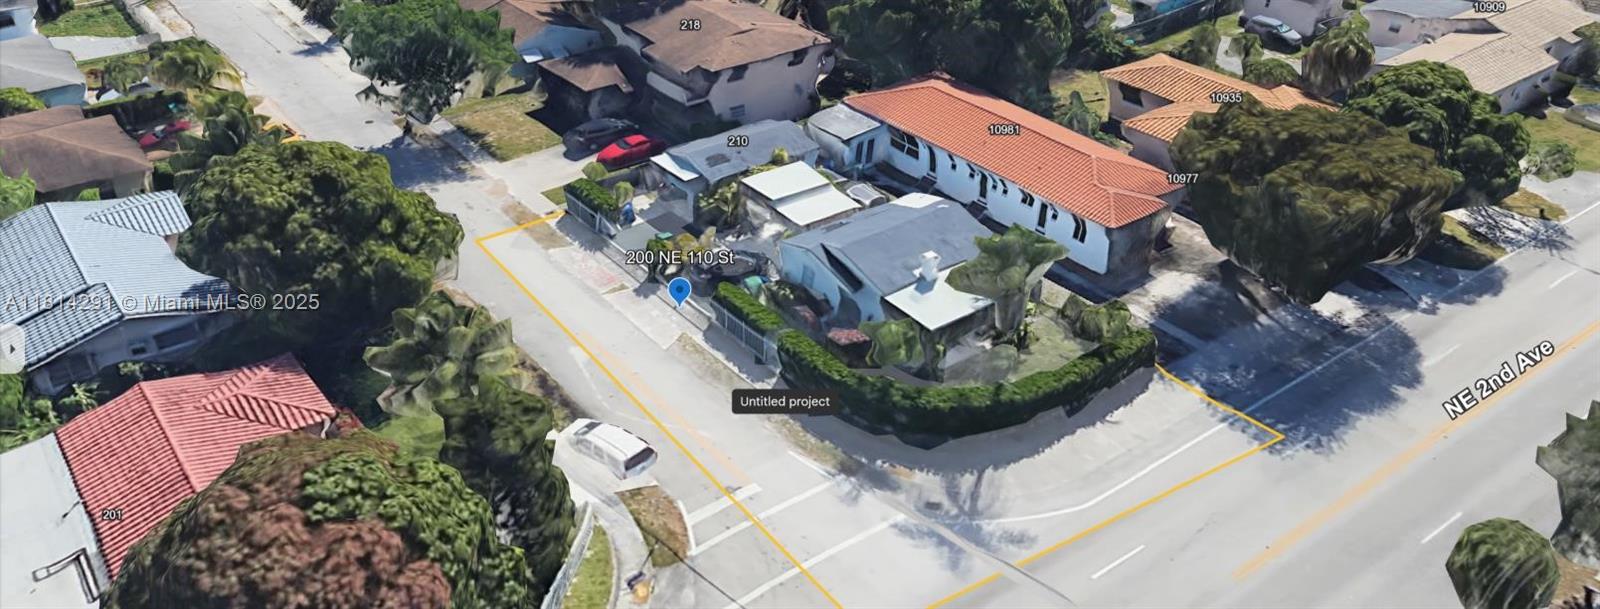
Active
$799,000
bds
|
0
ba
|
1,335
sqft
|
built
1940
210 NE 110th St, Miami, FL 33161
$-3,353
Cash flow
-21.9%
Cash-on-Cash Return
1.1%
Cap rate
0.3%
Rent to Value Ratio
Active
$875,000
3
bds
|
0
ba
|
1,205
sqft
|
built
1947
3429 SW 23rd Ter, Miami, FL 33145
$-2,546
Cash flow
-15.2%
Cash-on-Cash Return
2.7%
Cap rate
0.4%
Rent to Value Ratio
Active
$757,000
4
bds
|
4
ba
|
2,224
sqft
|
built
2017
11501 SW 228th Ln, Miami, FL 33170
$-1,556
Cash flow
-10.7%
Cash-on-Cash Return
3.7%
Cap rate
0.5%
Rent to Value Ratio
Active
$349,000
2
bds
|
3
ba
|
1,210
sqft
|
built
1988
15410 SW 74th Circle Ct, Miami, FL 33193
$-611
Cash flow
-9.1%
Cash-on-Cash Return
4.0%
Cap rate
0.8%
Rent to Value Ratio
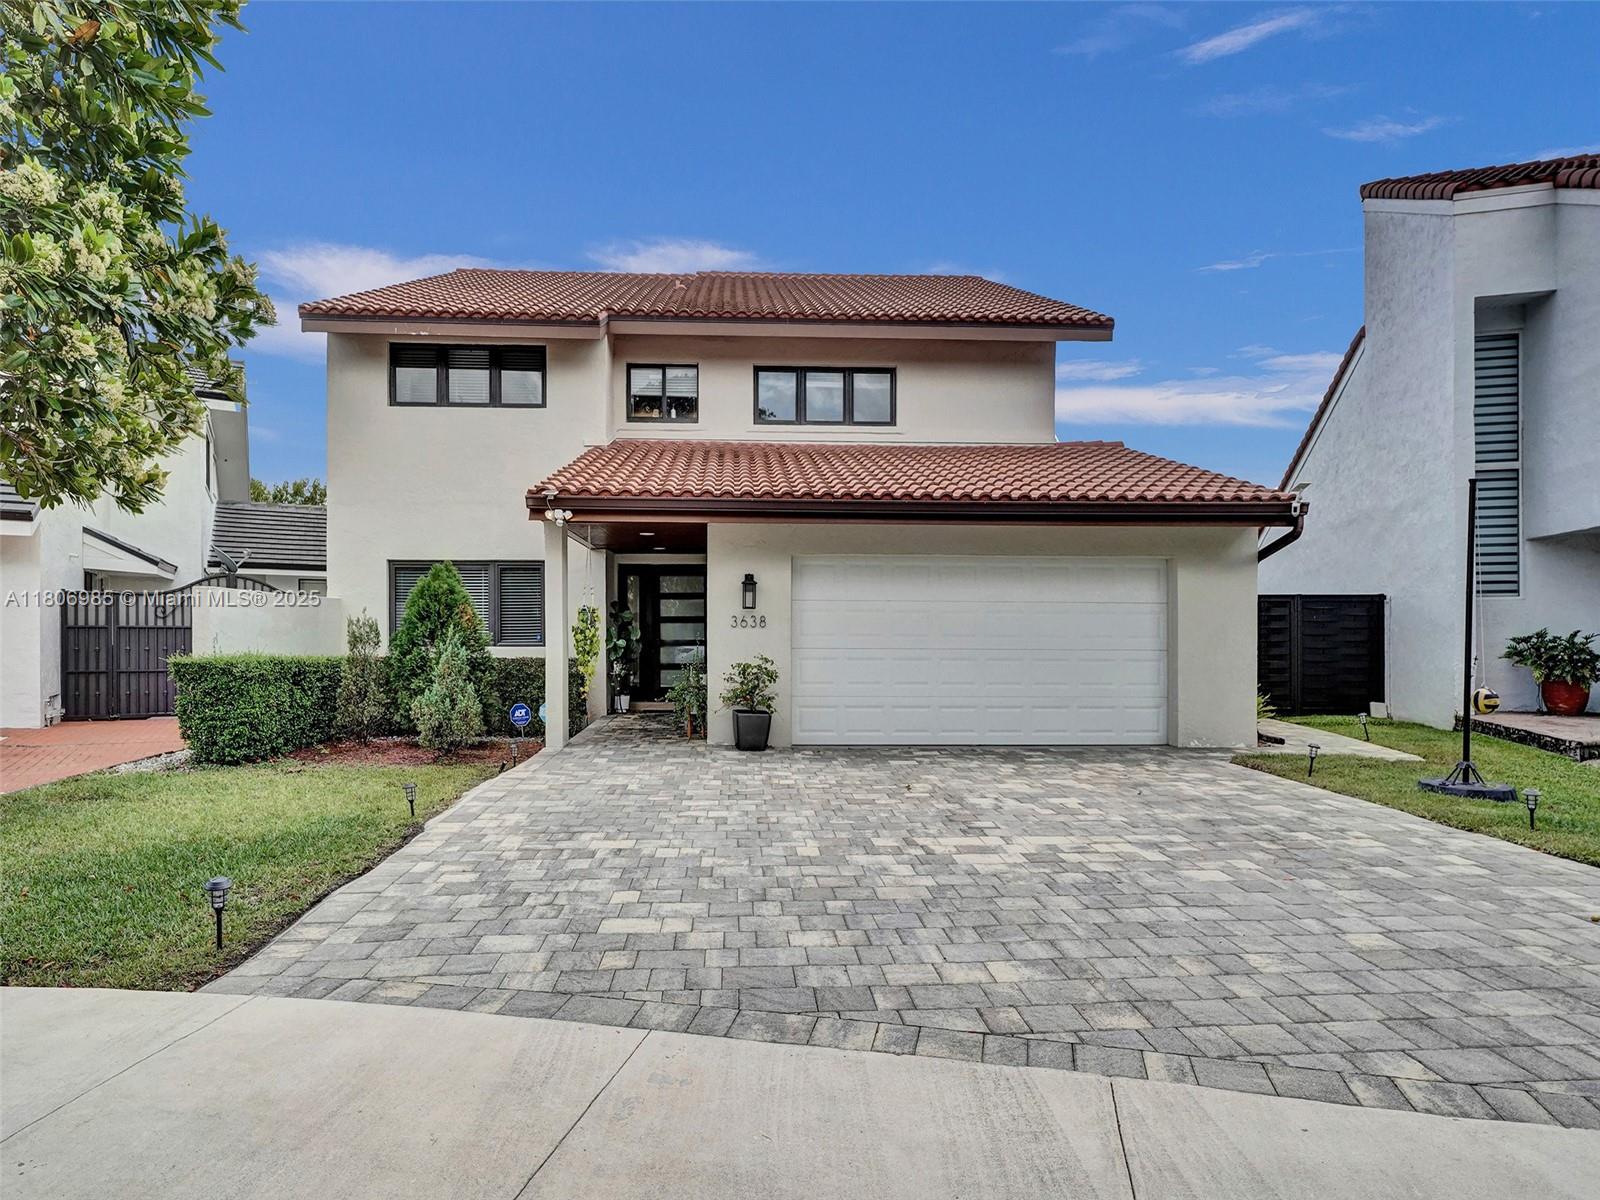
Active
$1,595,000
4
bds
|
3
ba
|
2,838
sqft
|
built
1985
3638 SW 57th Ave, Miami, FL 33155
$-4,054
Cash flow
-13.3%
Cash-on-Cash Return
3.1%
Cap rate
0.5%
Rent to Value Ratio
Active
$1,230,000
3
bds
|
2
ba
|
2,372
sqft
|
built
1984
12780 SW 187th St, Miami, FL 33177
$-4,101
Cash flow
-17.4%
Cash-on-Cash Return
2.1%
Cap rate
0.4%
Rent to Value Ratio
Active
$475,000
3
bds
|
3
ba
|
1,484
sqft
|
built
1984
401 SW 109th Ave, Miami, FL 33174
$-1,244
Cash flow
-13.7%
Cash-on-Cash Return
3.0%
Cap rate
0.6%
Rent to Value Ratio
Active
$1,780,000
3
bds
|
3
ba
|
1,778
sqft
|
built
2017
1010 Brickell Ave, Miami, FL 33131
$-6,757
Cash flow
-19.8%
Cash-on-Cash Return
1.6%
Cap rate
0.6%
Rent to Value Ratio
Active
$610,000
4
bds
|
3
ba
|
2,017
sqft
|
built
1954
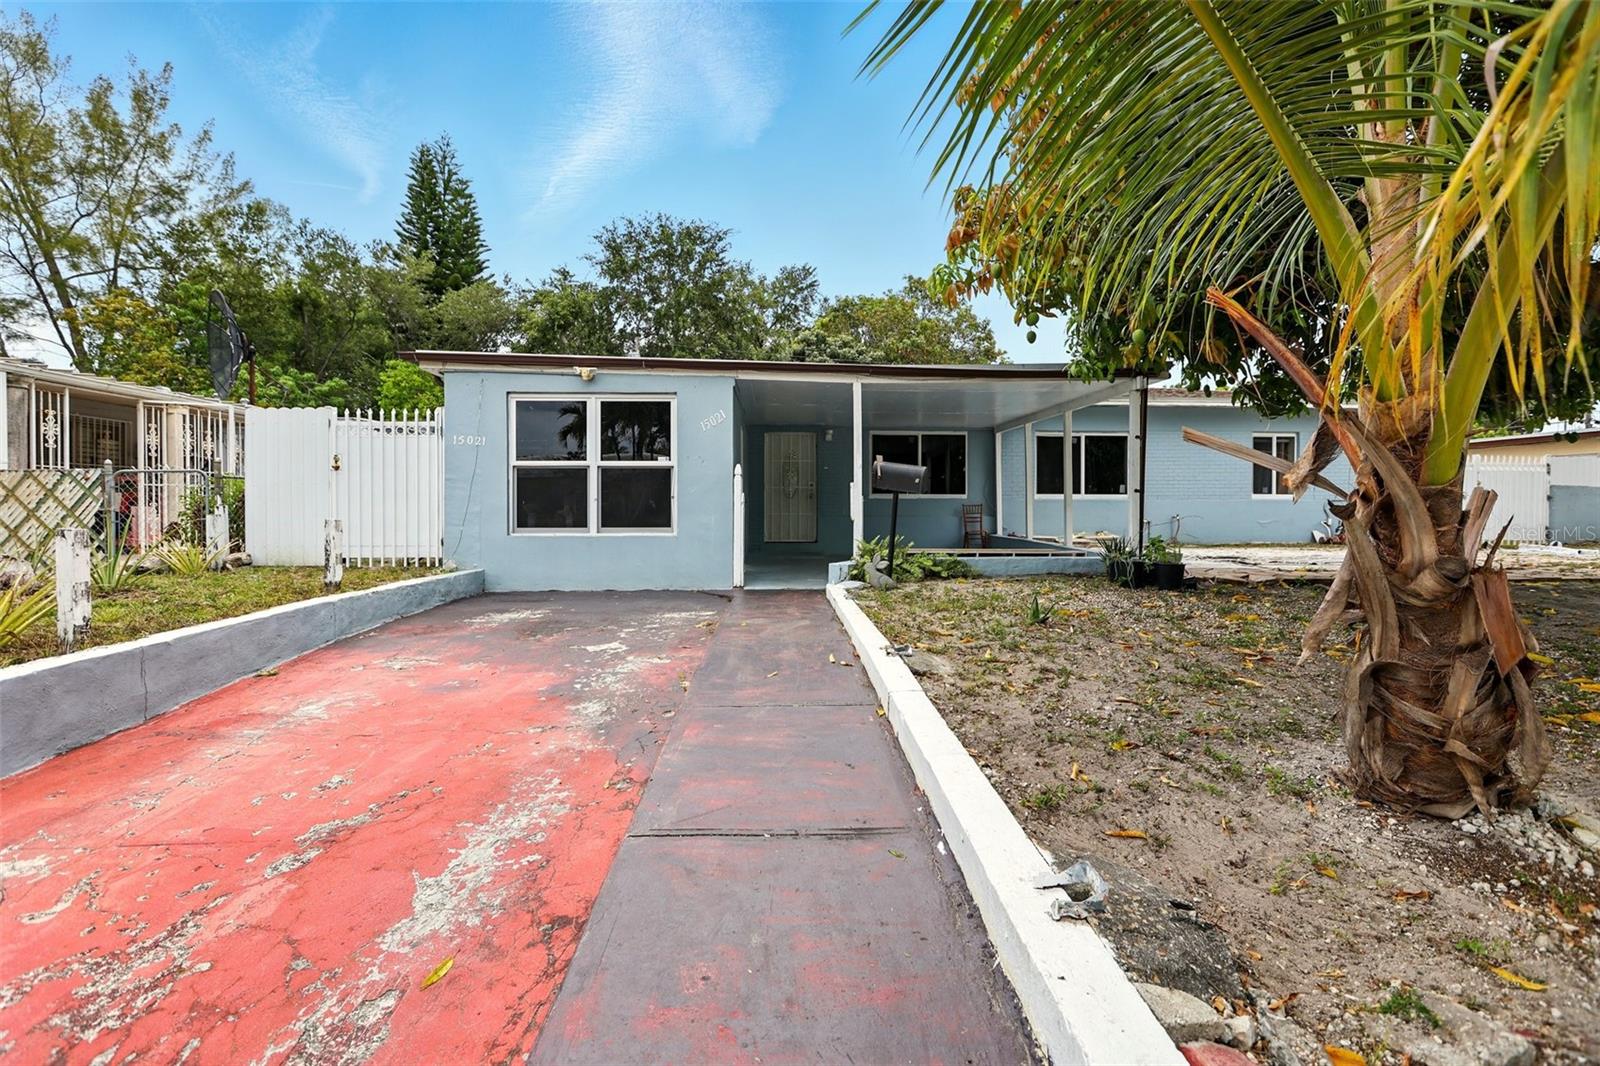
15021 NE 11th Ave, Miami, FL 33161
$-953
Cash flow
-8.2%
Cash-on-Cash Return
4.3%
Cap rate
0.6%
Rent to Value Ratio
Active
$950,000
2
bds
|
2
ba
|
1,088
sqft
|
built
2016
1300 S Miami Ave, Miami, FL 33130
$-3,696
Cash flow
-20.3%
Cash-on-Cash Return
1.5%
Cap rate
0.6%
Rent to Value Ratio
Active
$850,000
6
bds
|
4
ba
|
2,962
sqft
|
built
1999
14701 SW 159th Ct, Miami, FL 33196
$-2,064
Cash flow
-12.7%
Cash-on-Cash Return
3.2%
Cap rate
0.5%
Rent to Value Ratio
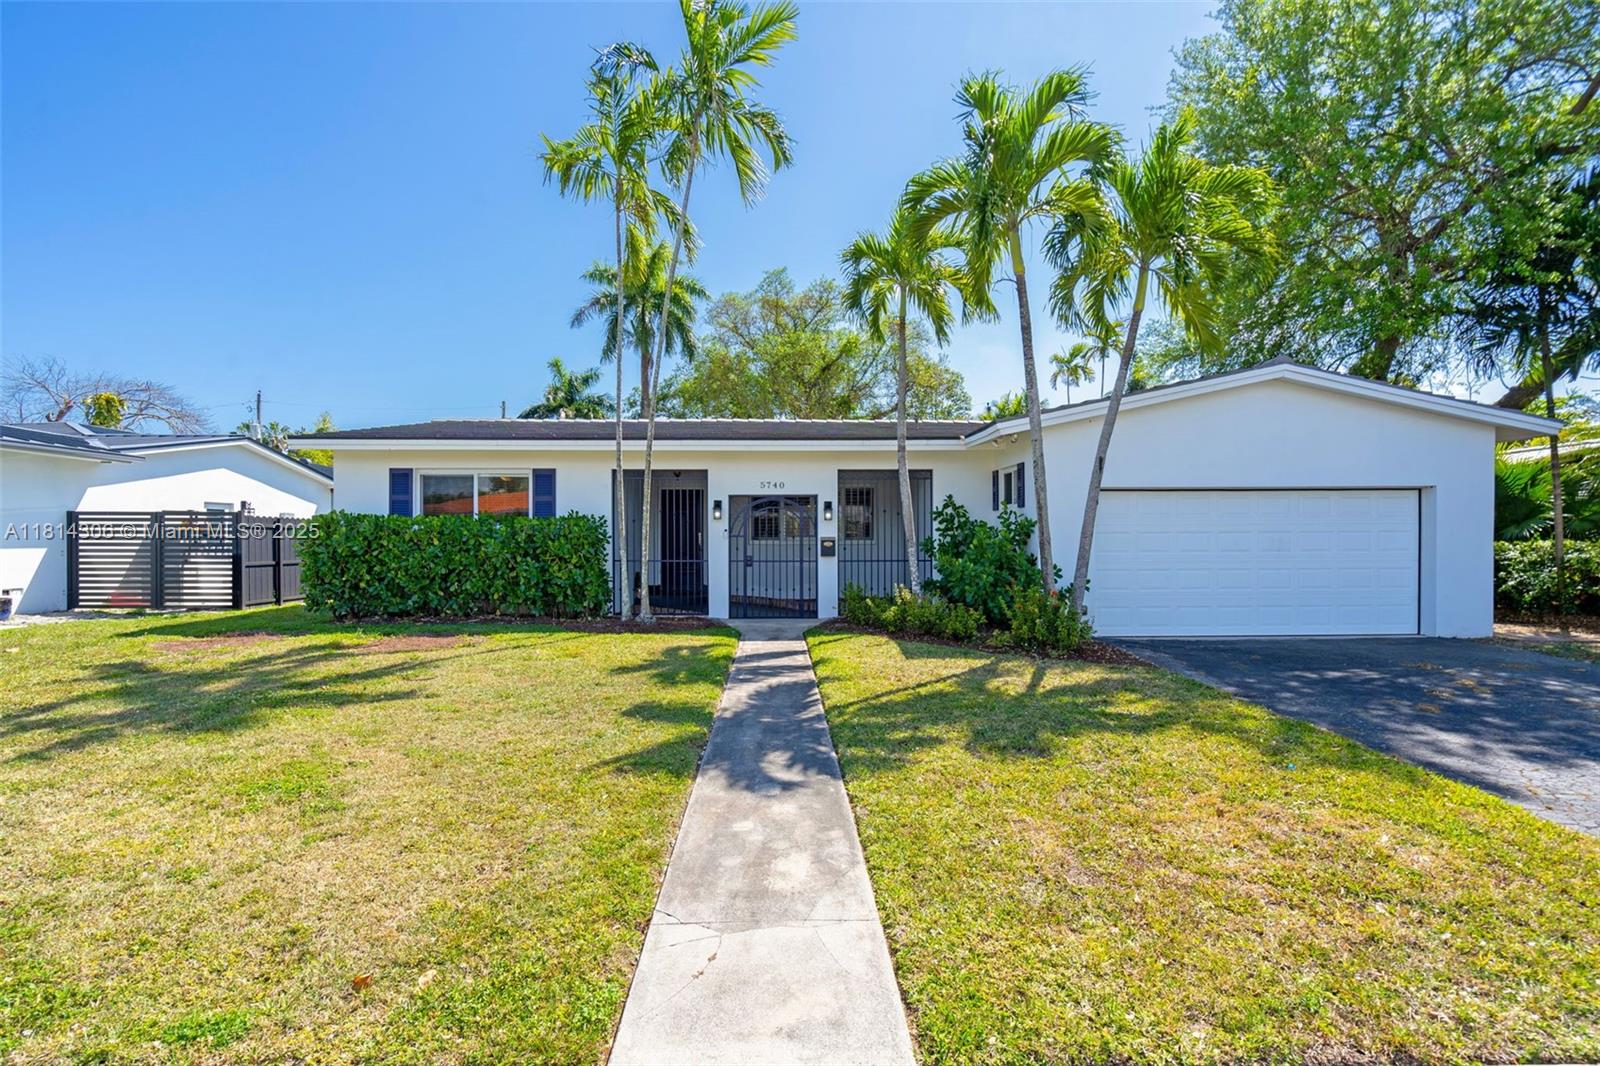
Active under contract
$1,250,000
3
bds
|
2
ba
|
1,659
sqft
|
built
1963
5740 SW 45th Ter, Miami, FL 33155
$-4,172
Cash flow
-17.4%
Cash-on-Cash Return
2.1%
Cap rate
0.4%
Rent to Value Ratio
Active
$435,000
1
bds
|
2
ba
|
795
sqft
|
built
2006
690 SW 1st Ct, Miami, FL 33130
$-1,363
Cash flow
-16.3%
Cash-on-Cash Return
2.4%
Cap rate
0.7%
Rent to Value Ratio