Miami, FL Investment Properties for Sale
Browse homes for sale and investment properties in Miami, FL. Refine your search by price, property type, or more.
Best cash flowing properties in Miami, FL
Active
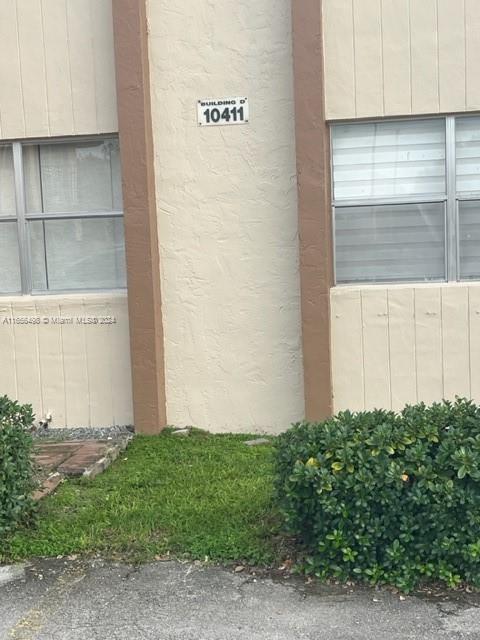
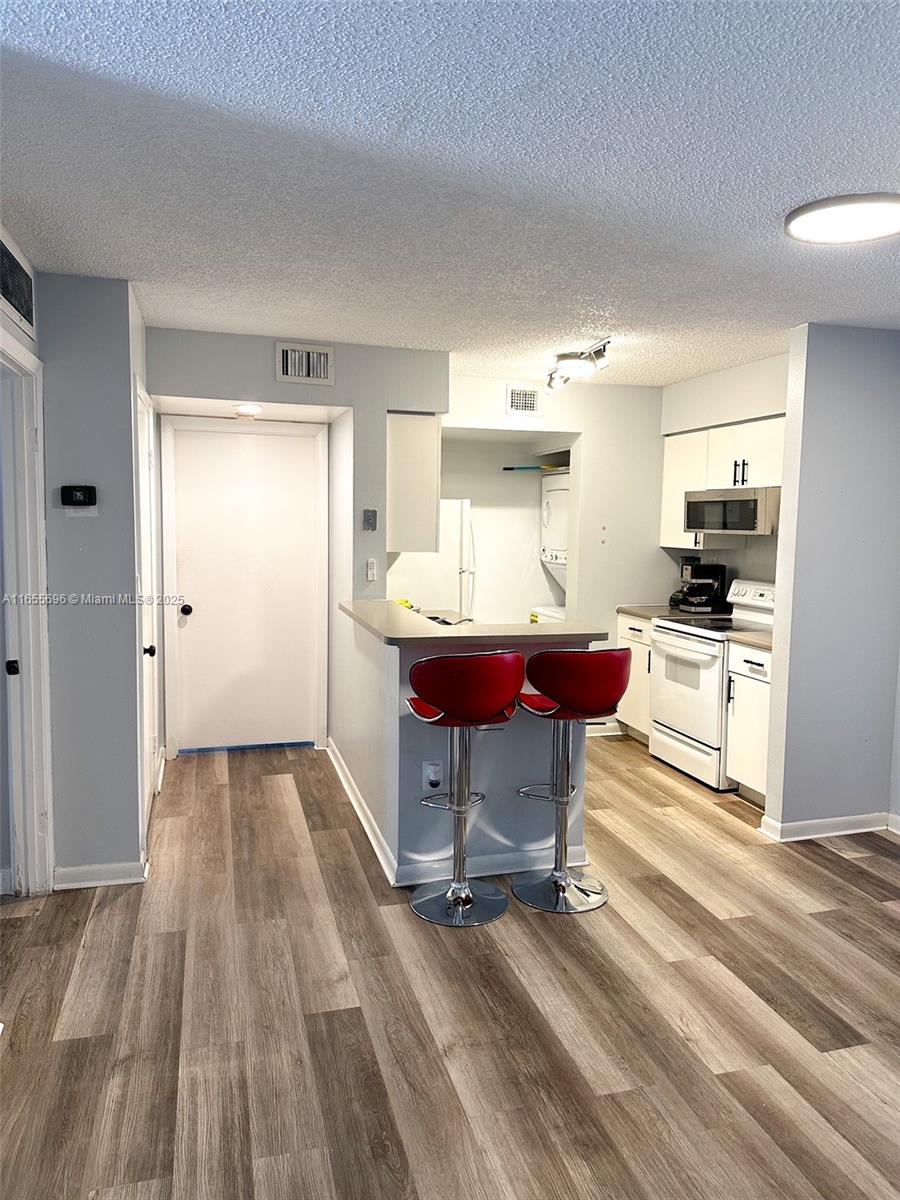
$219,000
1
bds
|
1
ba
|
650
sqft
|
built
1971
10411 SW 108th Ave, Miami, FL 33176
$-326
Cash flow
-7.8%
Cash-on-Cash Return
4.4%
Cap rate
0.8%
Rent to Value Ratio
Active
$259,000
2
bds
|
2
ba
|
877
sqft
|
built
1992
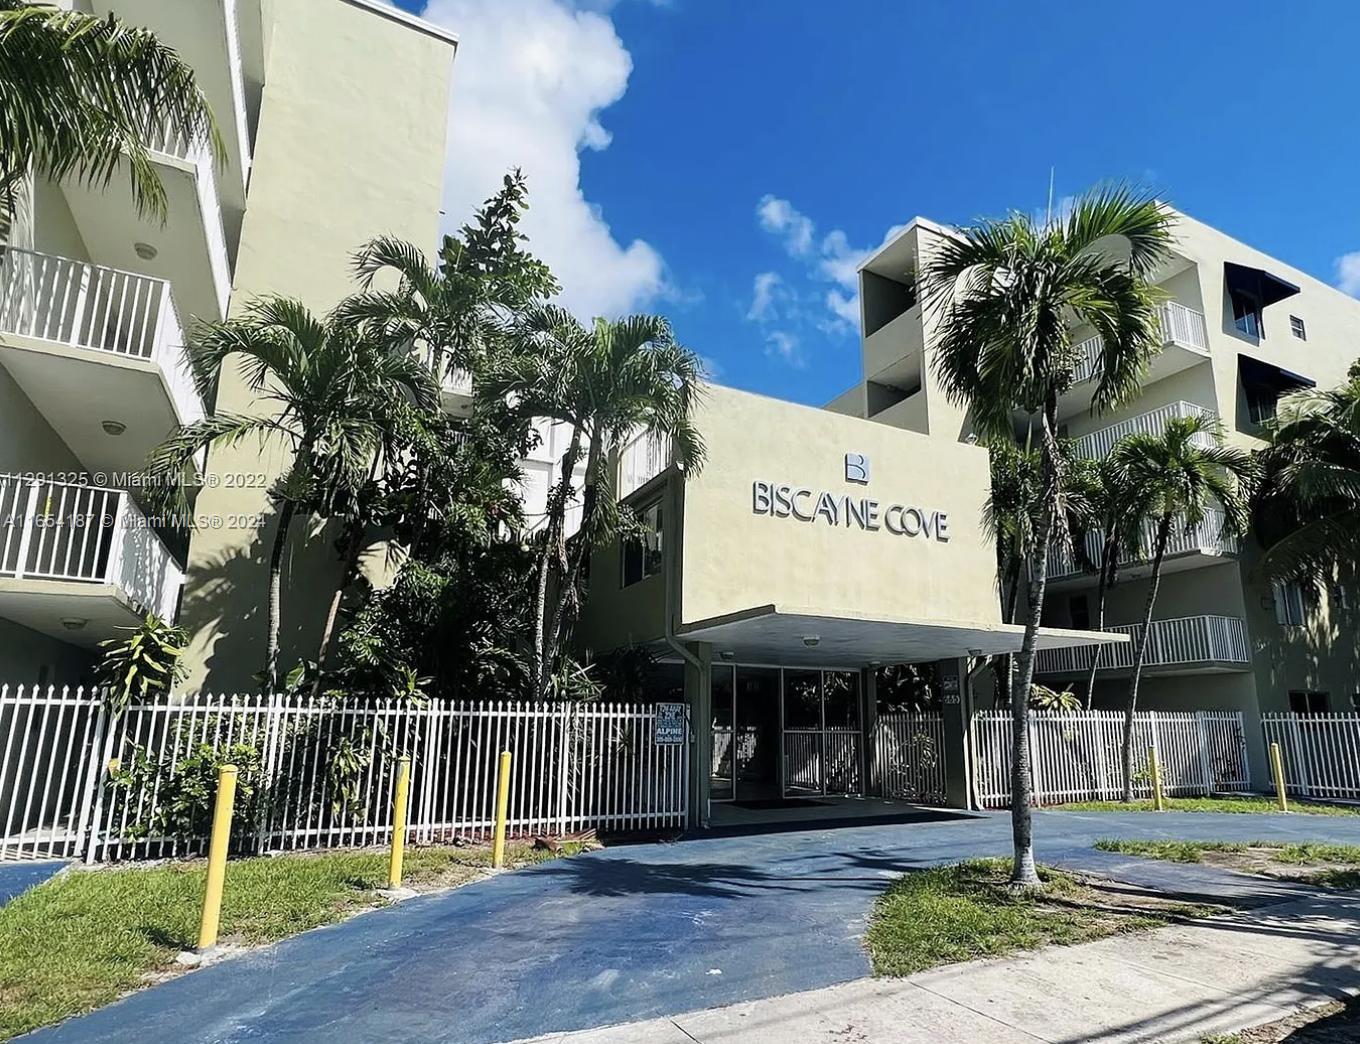
15221 SW 80th St, Miami, FL 33193
$-365
Cash flow
-7.4%
Cash-on-Cash Return
4.5%
Cap rate
0.9%
Rent to Value Ratio
6,163 out of 6,996 properties for sale in Miami, FL
Limited Results Shown
Create a free account, or log in to reveal all property listings and enjoy the complete experience.

Active
$3,300,000
5
bds
|
5
ba
|
2,902
sqft
|
built
1951
63 SW 31st Rd, Miami, FL 33129
$-12,018
Cash flow
-19.0%
Cash-on-Cash Return
1.8%
Cap rate
0.3%
Rent to Value Ratio

Active
$489,900
3
bds
|
2
ba
|
888
sqft
|
built
1957
1810 NW 69th Ter, Miami, FL 33147
$-654
Cash flow
-7.0%
Cash-on-Cash Return
4.5%
Cap rate
0.6%
Rent to Value Ratio
Active
$219,000
1
bds
|
1
ba
|
650
sqft
|
built
1971
10411 SW 108th Ave, Miami, FL 33176
$-326
Cash flow
-7.8%
Cash-on-Cash Return
4.4%
Cap rate
0.8%
Rent to Value Ratio
Active
$1,010,000
2
bds
|
2
ba
|
1,089
sqft
|
built
2019
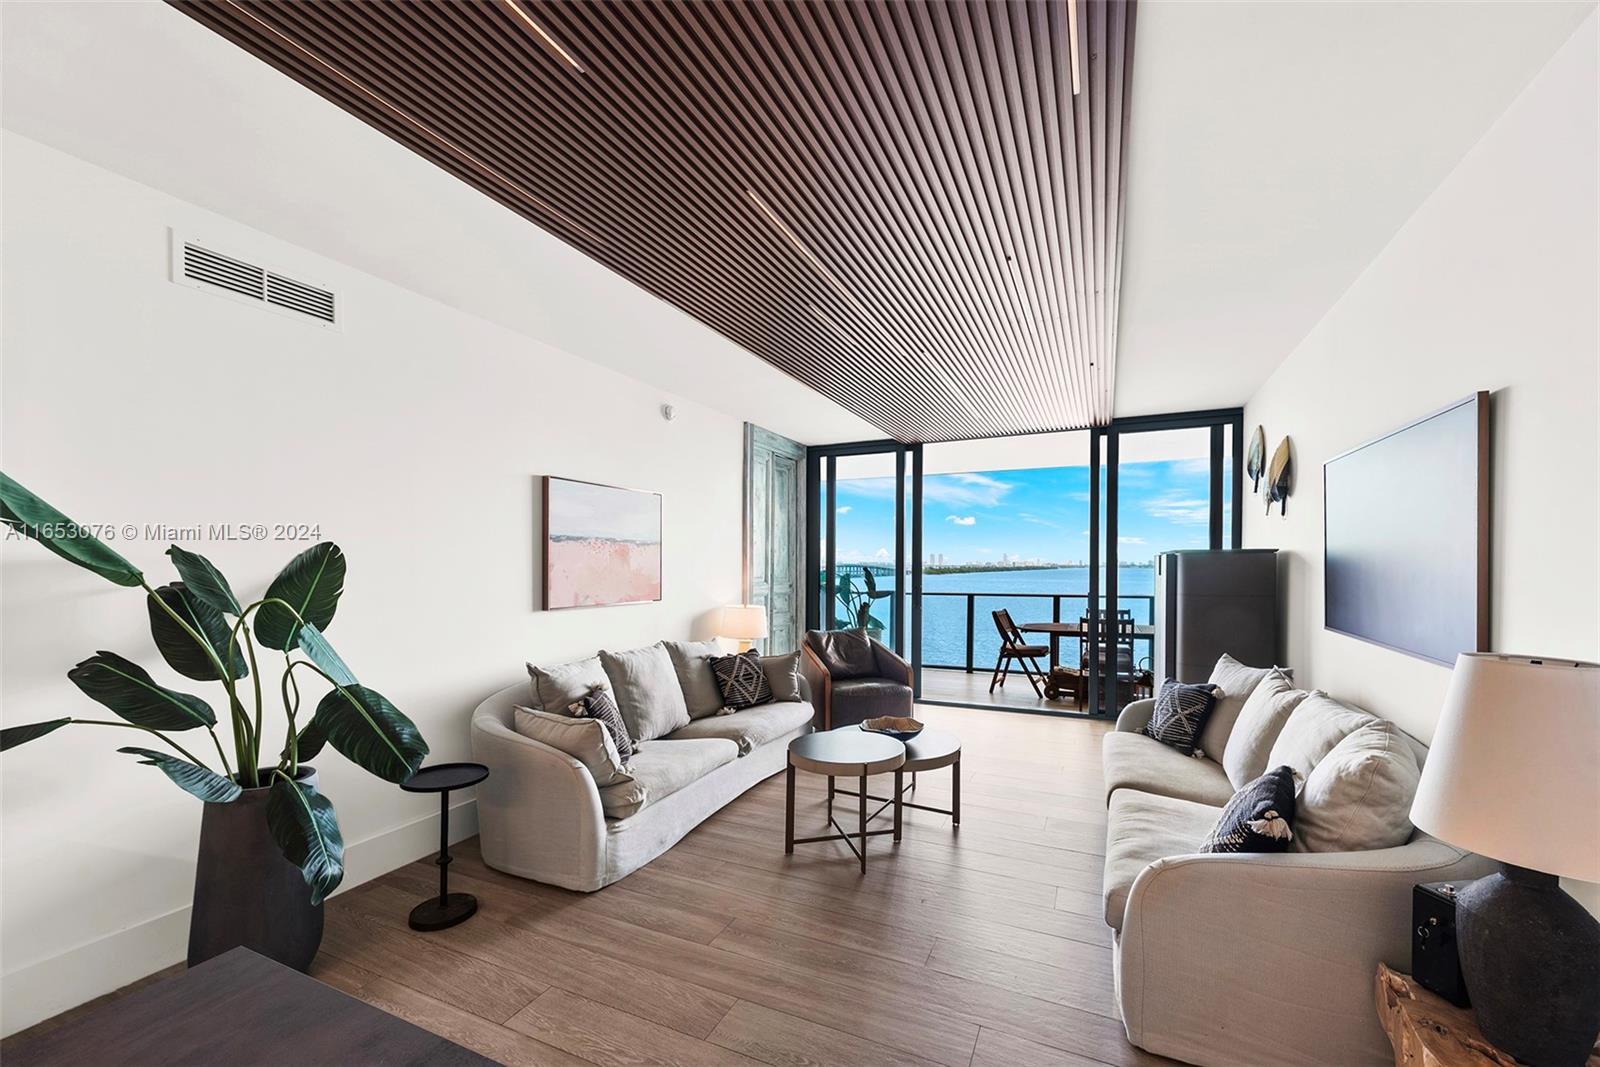
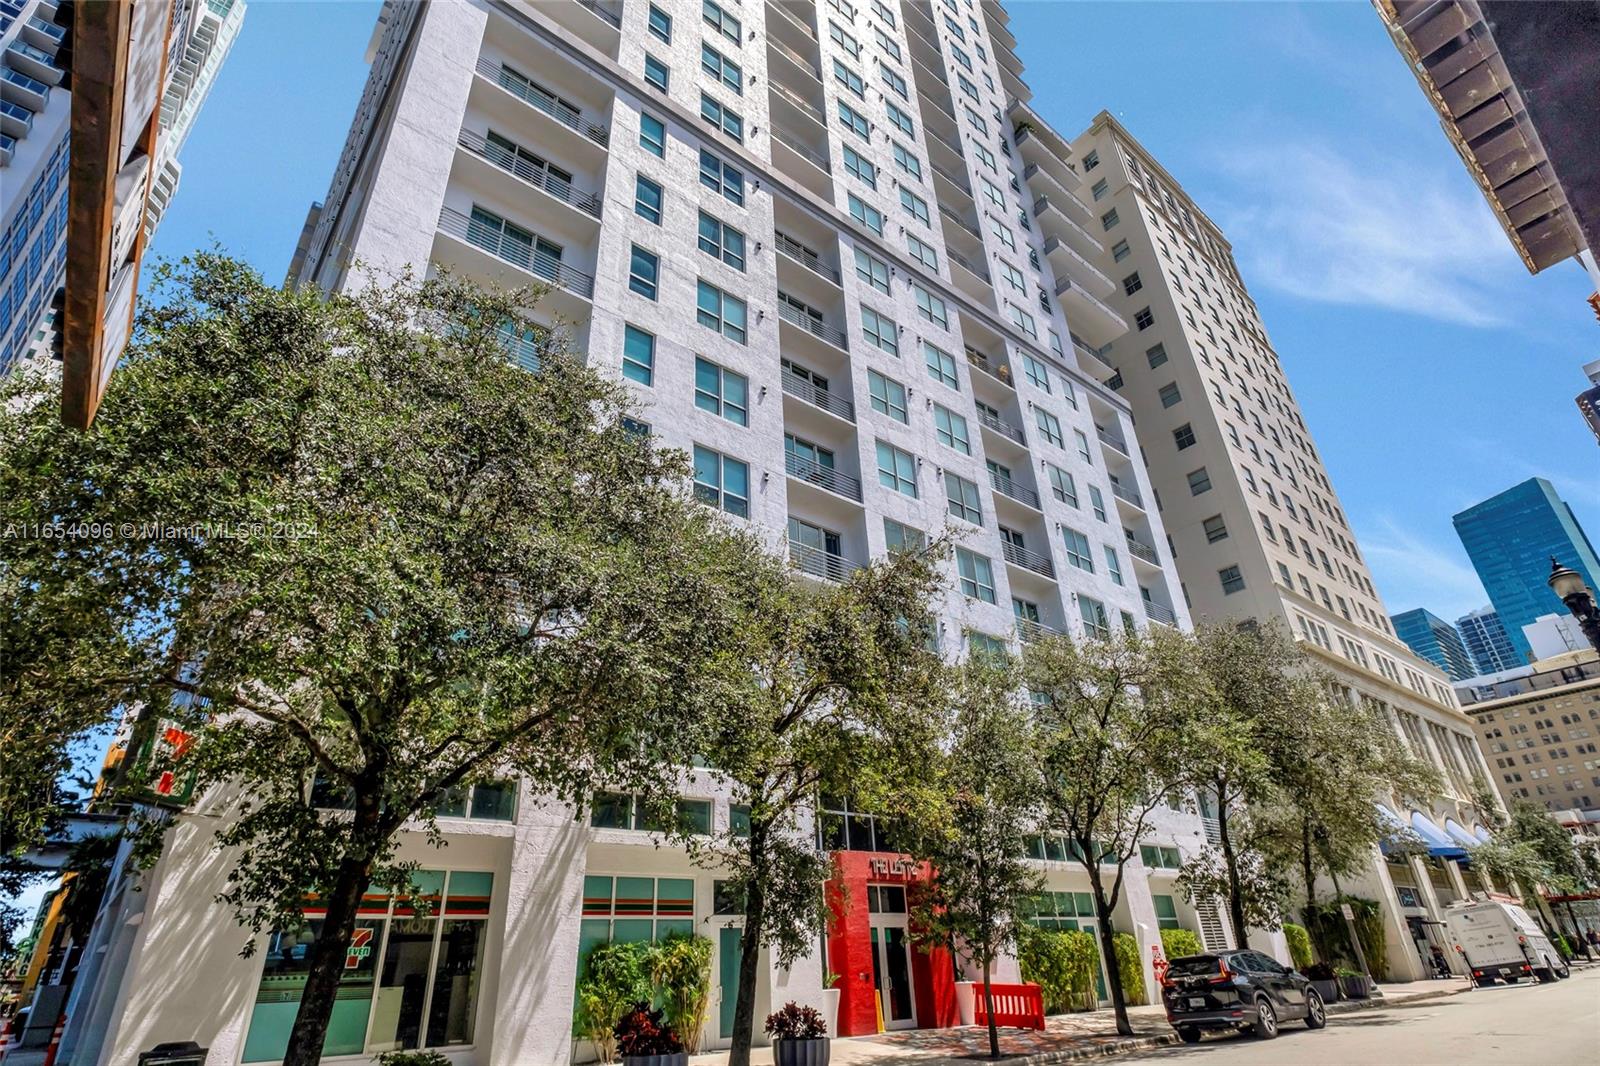
3900 Biscayne Blvd, Miami, FL 33137
$-3,100
Cash flow
-16.0%
Cash-on-Cash Return
2.5%
Cap rate
0.6%
Rent to Value Ratio

Active
$1,500,000
2
bds
|
3
ba
|
999
sqft
|
built
2016
1300 S Miami Ave, Miami, FL 33130
$-4,318
Cash flow
-15.0%
Cash-on-Cash Return
2.7%
Cap rate
0.5%
Rent to Value Ratio
Active
$630,000
3
bds
|
2
ba
|
1,634
sqft
|
built
1992
10360 SW 22nd St, Miami, FL 33165
$-1,007
Cash flow
-8.3%
Cash-on-Cash Return
4.2%
Cap rate
0.6%
Rent to Value Ratio
Active
$1,690,000
3
bds
|
4
ba
|
1,694
sqft
|
built
2008
200 Biscayne Boulevard Way, Miami, FL 33131
$-7,724
Cash flow
-23.8%
Cash-on-Cash Return
0.7%
Cap rate
0.4%
Rent to Value Ratio

Active under contract
$435,000
2
bds
|
3
ba
|
1,411
sqft
|
built
1987
13269 SW 112th Ter, Miami, FL 33186
$-872
Cash flow
-10.5%
Cash-on-Cash Return
3.7%
Cap rate
0.7%
Rent to Value Ratio
Active
$359,900
2
bds
|
2
ba
|
899
sqft
|
built
1986
1720 NW North River Dr, Miami, FL 33125
$-832
Cash flow
-12.1%
Cash-on-Cash Return
3.4%
Cap rate
0.7%
Rent to Value Ratio
Active
$1,100,000
2
bds
|
3
ba
|
1,181
sqft
|
built
2007
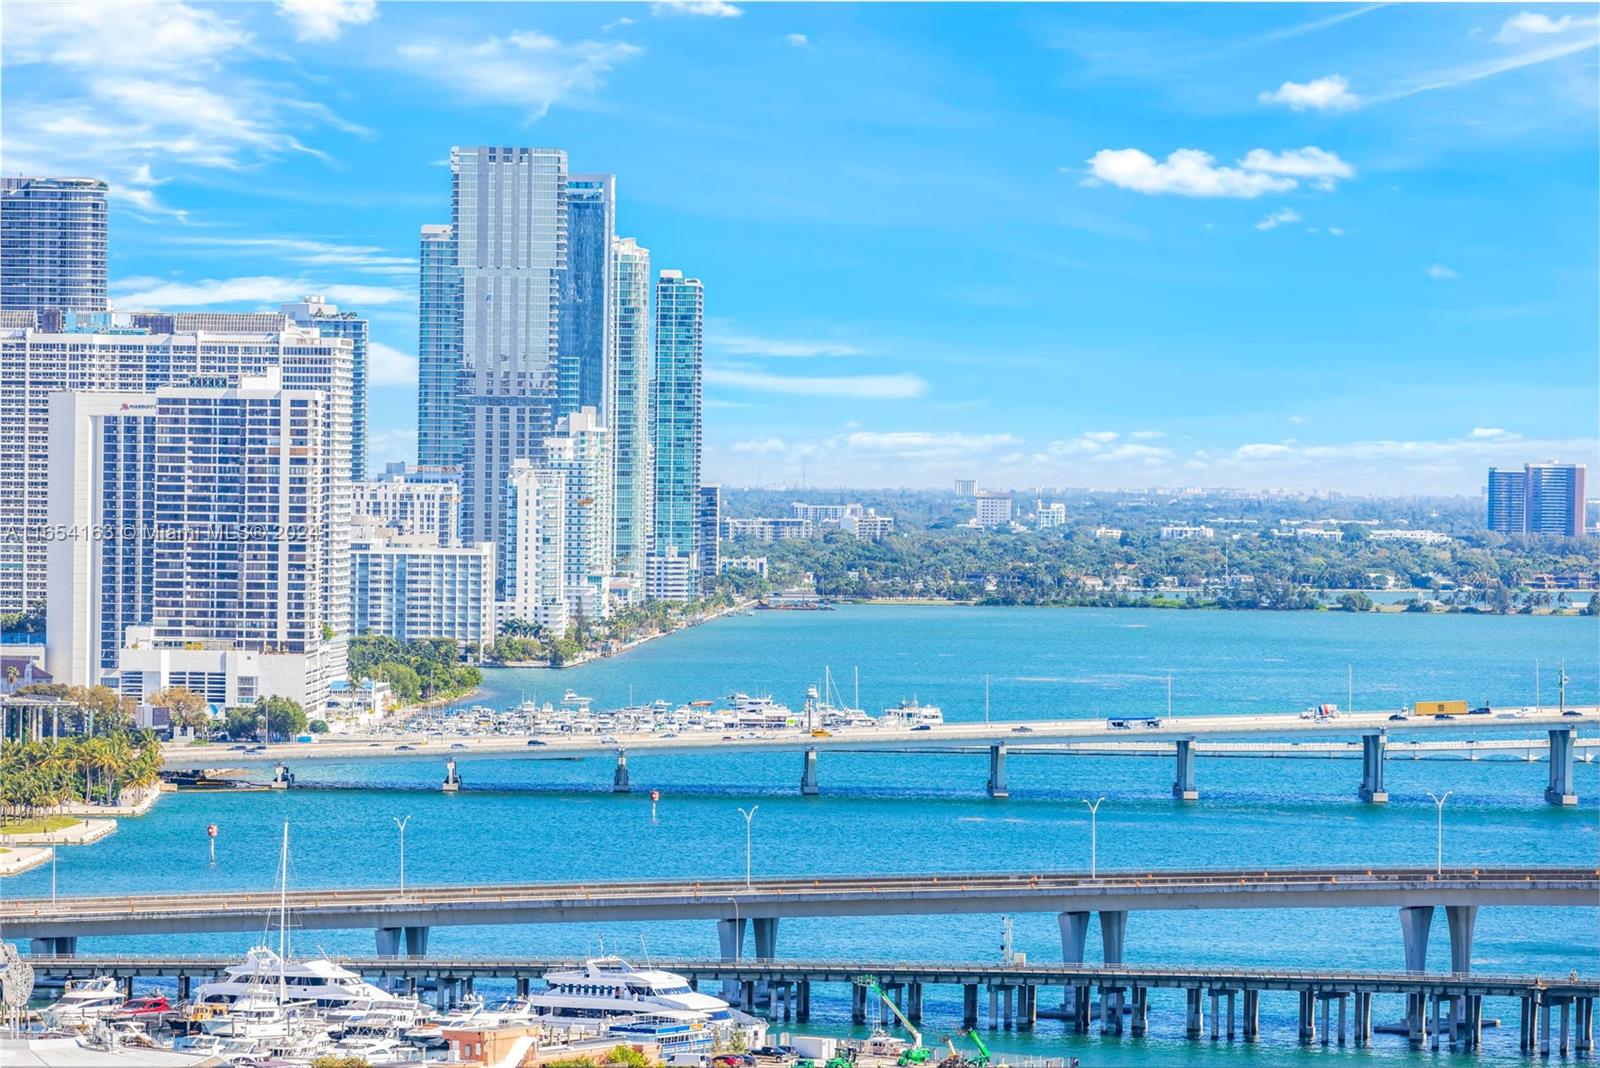
3470 E Coast Ave, Miami, FL 33137
$-3,740
Cash flow
-17.7%
Cash-on-Cash Return
2.1%
Cap rate
0.6%
Rent to Value Ratio

Active
$352,000
1
bds
|
1
ba
|
519
sqft
|
built
1972
651 NE 60th St, Miami, FL 33137
$-728
Cash flow
-10.8%
Cash-on-Cash Return
3.7%
Cap rate
0.8%
Rent to Value Ratio
Active
$259,000
2
bds
|
2
ba
|
877
sqft
|
built
1992
15221 SW 80th St, Miami, FL 33193
$-365
Cash flow
-7.4%
Cash-on-Cash Return
4.5%
Cap rate
0.9%
Rent to Value Ratio

Active
$699,999
2
bds
|
3
ba
|
1,123
sqft
|
built
2007
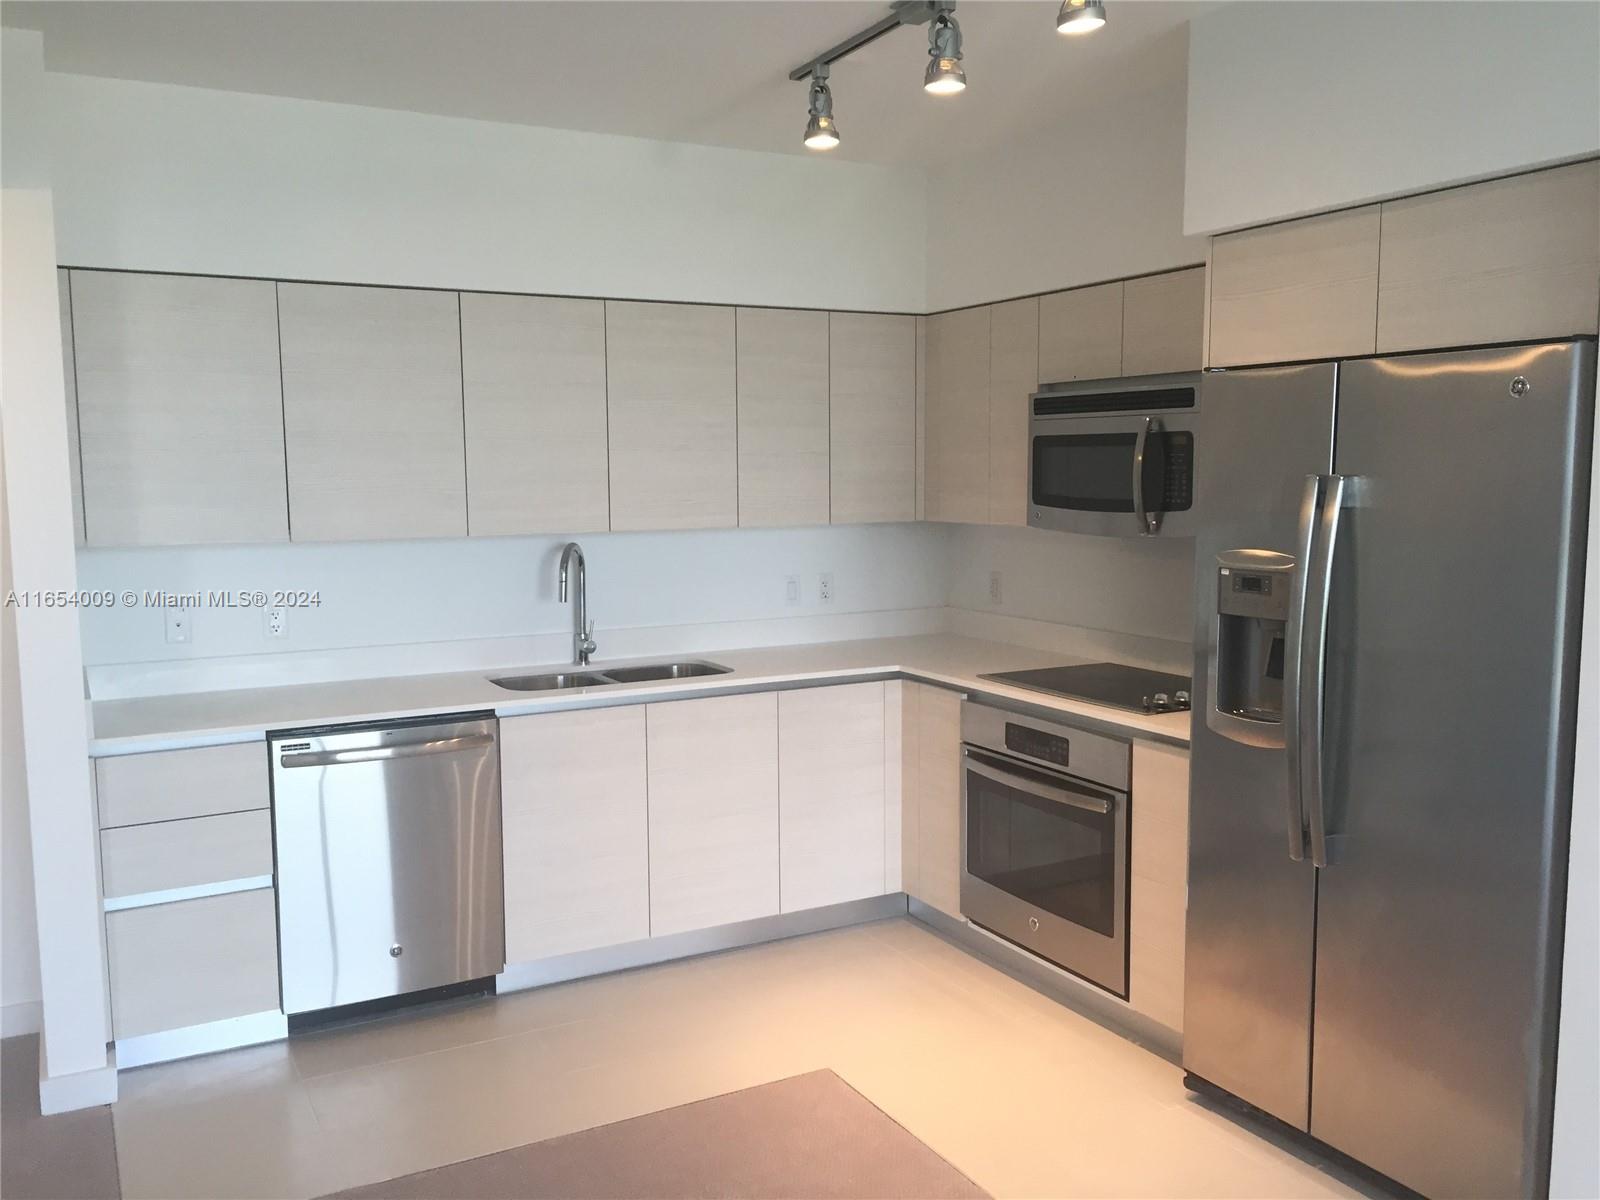
1040 Biscayne Blvd, Miami, FL 33132
$-2,285
Cash flow
-17.0%
Cash-on-Cash Return
2.2%
Cap rate
0.8%
Rent to Value Ratio
Active
$699,900
4
bds
|
0
ba
|
1,300
sqft
|
built
1961
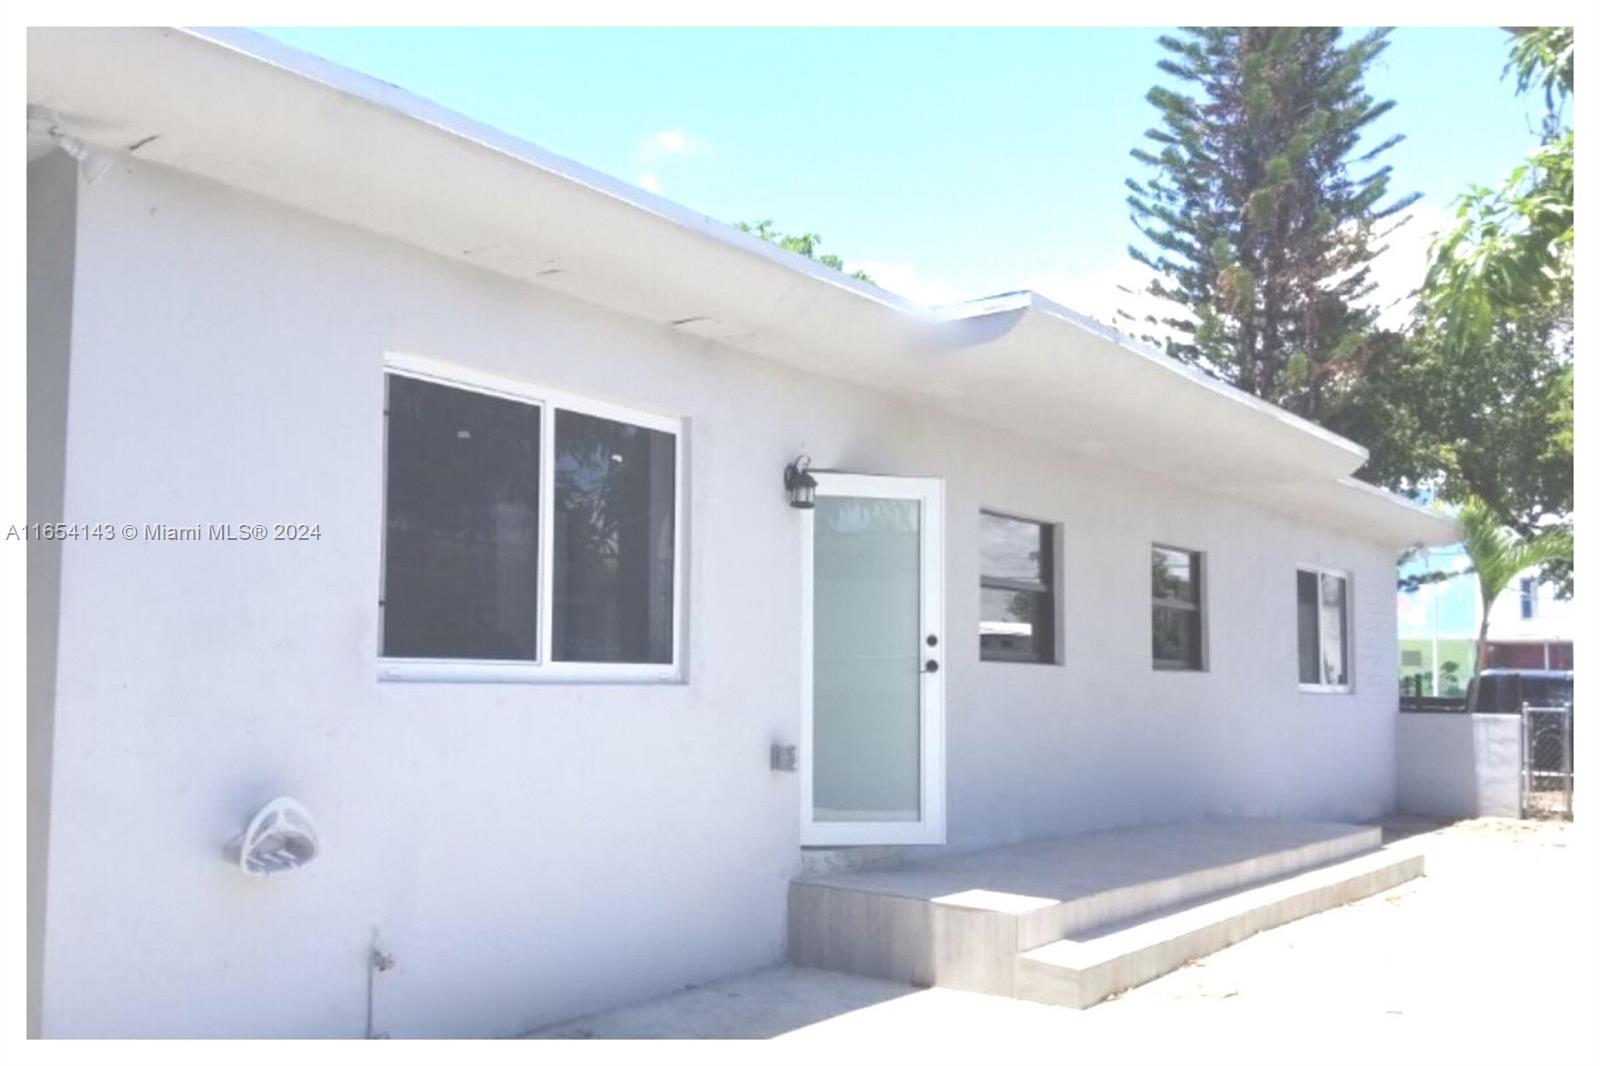
22112 SW 115th Ct, Miami, FL 33170
$-2,261
Cash flow
-16.9%
Cash-on-Cash Return
2.3%
Cap rate
0.4%
Rent to Value Ratio
Active
$895,000
1
bds
|
1
ba
|
626
sqft
|
built
2022
398 NE 5th St, Miami, FL 33132
$-3,094
Cash flow
-18.0%
Cash-on-Cash Return
2.0%
Cap rate
0.6%
Rent to Value Ratio

Active
$1,149,999
4
bds
|
4
ba
|
2,216
sqft
|
built
1952
348 NE 118th St, Miami, FL 33161
$-2,728
Cash flow
-12.4%
Cash-on-Cash Return
3.3%
Cap rate
0.5%
Rent to Value Ratio
Active
$1,650,000
4
bds
|
0
ba
|
7,150
sqft
|
built
1966
301 NW 34th St, Miami, FL 33127
$-6,056
Cash flow
-19.1%
Cash-on-Cash Return
1.7%
Cap rate
0.3%
Rent to Value Ratio
Active
$285,000
2
bds
|
2
ba
|
965
sqft
|
built
1982
8540 SW 133rd Avenue Rd, Miami, FL 33183
$-911
Cash flow
-16.7%
Cash-on-Cash Return
2.3%
Cap rate
0.7%
Rent to Value Ratio
Active
$440,000
1
bds
|
1
ba
|
738
sqft
|
built
2008
55 SE 6th St, Miami, FL 33131
$-1,552
Cash flow
-18.4%
Cash-on-Cash Return
1.9%
Cap rate
0.7%
Rent to Value Ratio
Active
$485,000
1
bds
|
2
ba
|
754
sqft
|
built
2010
92 SW 3rd St, Miami, FL 33130
$-1,473
Cash flow
-15.8%
Cash-on-Cash Return
2.5%
Cap rate
0.7%
Rent to Value Ratio
Active
$790,000
3
bds
|
2
ba
|
1,152
sqft
|
built
2018
501 NE 31st St, Miami, FL 33137
$-2,728
Cash flow
-18.0%
Cash-on-Cash Return
2.0%
Cap rate
0.7%
Rent to Value Ratio

Active
$4,500,000
4
bds
|
2
ba
|
2,125
sqft
|
built
1994
22501 SW 207th Ave, Miami, FL 33170
$-20,866
Cash flow
-24.2%
Cash-on-Cash Return
0.6%
Cap rate
0.1%
Rent to Value Ratio

Active
$892,500
2
bds
|
2
ba
|
1,155
sqft
|
built
2016
1300 S Miami Ave, Miami, FL 33130
$-3,468
Cash flow
-20.3%
Cash-on-Cash Return
1.5%
Cap rate
0.6%
Rent to Value Ratio
Active
$1,245,000
3
bds
|
3
ba
|
1,450
sqft
|
built
2018
801 S Miami Ave, Miami, FL 33130
$-3,627
Cash flow
-15.2%
Cash-on-Cash Return
2.7%
Cap rate
0.7%
Rent to Value Ratio

Active
$629,000
4
bds
|
3
ba
|
1,225
sqft
|
built
2023
4295 NW 32nd Ave, Miami, FL 33142
$-1,592
Cash flow
-13.2%
Cash-on-Cash Return
3.1%
Cap rate
0.5%
Rent to Value Ratio
Active
$1,170,000
2
bds
|
3
ba
|
1,540
sqft
|
built
1998
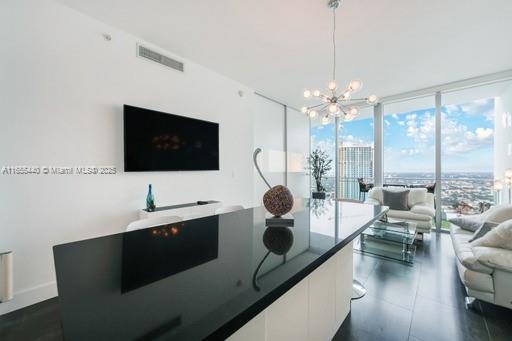
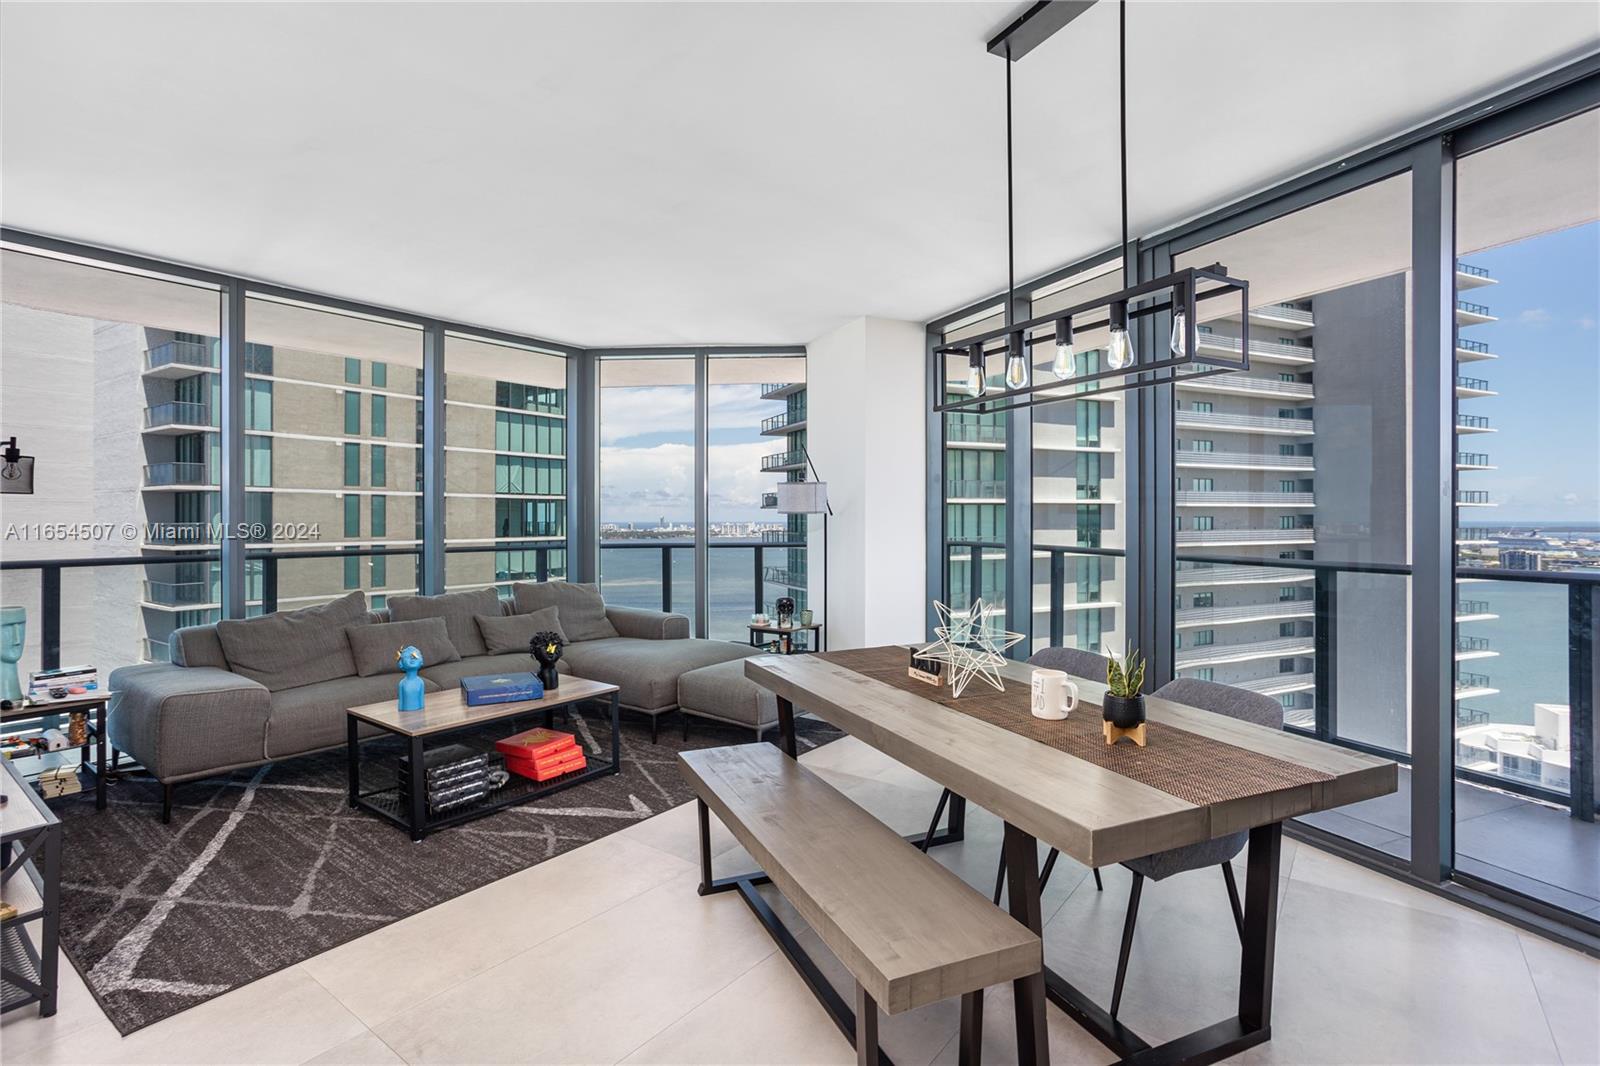
808 Brickell Key Dr, Miami, FL 33131
$-4,540
Cash flow
-20.2%
Cash-on-Cash Return
1.5%
Cap rate
0.5%
Rent to Value Ratio
Active
$1,435,000
3
bds
|
4
ba
|
1,526
sqft
|
built
2018
3131 NE 7th Ave, Miami, FL 33137
$-4,941
Cash flow
-18.0%
Cash-on-Cash Return
2.0%
Cap rate
0.6%
Rent to Value Ratio
Active
$690,000
1
bds
|
2
ba
|
959
sqft
|
built
1998
808 Brickell Key Dr, Miami, FL 33131
$-2,520
Cash flow
-19.1%
Cash-on-Cash Return
1.8%
Cap rate
0.5%
Rent to Value Ratio
Active
$425,000
1
bds
|
1
ba
|
648
sqft
|
built
2015
4250 Biscayne Blvd, Miami, FL 33137
$-1,880
Cash flow
-23.1%
Cash-on-Cash Return
0.8%
Cap rate
0.6%
Rent to Value Ratio
Active
$2,000,000
3
bds
|
0
ba
|
1,378
sqft
|
built
1957
3181 NW 5th Ave, Miami, FL 33127
$-9,340
Cash flow
-24.4%
Cash-on-Cash Return
0.5%
Cap rate
0.1%
Rent to Value Ratio
Active
$399,000
1
bds
|
1
ba
|
903
sqft
|
built
2007
133 NE 2nd Ave, Miami, FL 33132
$-1,243
Cash flow
-16.3%
Cash-on-Cash Return
2.4%
Cap rate
0.7%
Rent to Value Ratio
Active
$249,000
1
bds
|
1
ba
|
562
sqft
|
built
1972
665 NE 83rd Ter, Miami, FL 33138
$-477
Cash flow
-10.0%
Cash-on-Cash Return
3.9%
Cap rate
0.7%
Rent to Value Ratio
Active
$1,899,000
3
bds
|
3
ba
|
2,070
sqft
|
built
1968
5231 SW 65th Ave, Miami, FL 33155
$-3,366
Cash flow
-9.2%
Cash-on-Cash Return
4.0%
Cap rate
0.5%
Rent to Value Ratio

Active
$875,000
8
bds
|
0
ba
|
3,495
sqft
|
built
1971
14871 NE 14th Ave, Miami, FL 33161
$-3,707
Cash flow
-22.1%
Cash-on-Cash Return
1.1%
Cap rate
0.3%
Rent to Value Ratio
Active
$450,000
2
bds
|
2
ba
|
930
sqft
|
built
1998
185 SE 14th Ter, Miami, FL 33131
$-1,757
Cash flow
-20.4%
Cash-on-Cash Return
1.5%
Cap rate
0.7%
Rent to Value Ratio
Active
$1,450,000
3
bds
|
1
ba
|
1,256
sqft
|
built
1930
287 NW 31st St, Miami, FL 33127
$-6,130
Cash flow
-22.1%
Cash-on-Cash Return
1.1%
Cap rate
0.3%
Rent to Value Ratio

Active
$599,000
1
bds
|
2
ba
|
981
sqft
|
built
2006
41 SE 5th St, Miami, FL 33131
$-1,628
Cash flow
-14.2%
Cash-on-Cash Return
2.9%
Cap rate
0.7%
Rent to Value Ratio

Active
$1,619,452
3
bds
|
4
ba
|
1,526
sqft
|
built
2018
3131 NE 7th Ave, Miami, FL 33137
$-6,189
Cash flow
-19.9%
Cash-on-Cash Return
1.6%
Cap rate
0.5%
Rent to Value Ratio

Active
$369,000
1
bds
|
1
ba
|
526
sqft
|
built
2016
151 SE 1st St, Miami, FL 33131
$-1,133
Cash flow
-16.0%
Cash-on-Cash Return
2.5%
Cap rate
0.7%
Rent to Value Ratio

Active
$450,000
1
bds
|
1
ba
|
791
sqft
|
built
2004
2101 Brickell Ave, Miami, FL 33129
$-1,510
Cash flow
-17.5%
Cash-on-Cash Return
2.1%
Cap rate
0.7%
Rent to Value Ratio