Miami, FL Investment Properties for Sale
Browse homes for sale and investment properties in Miami, FL. Refine your search by price, property type, or more.
Best cash flowing properties in Miami, FL
Active
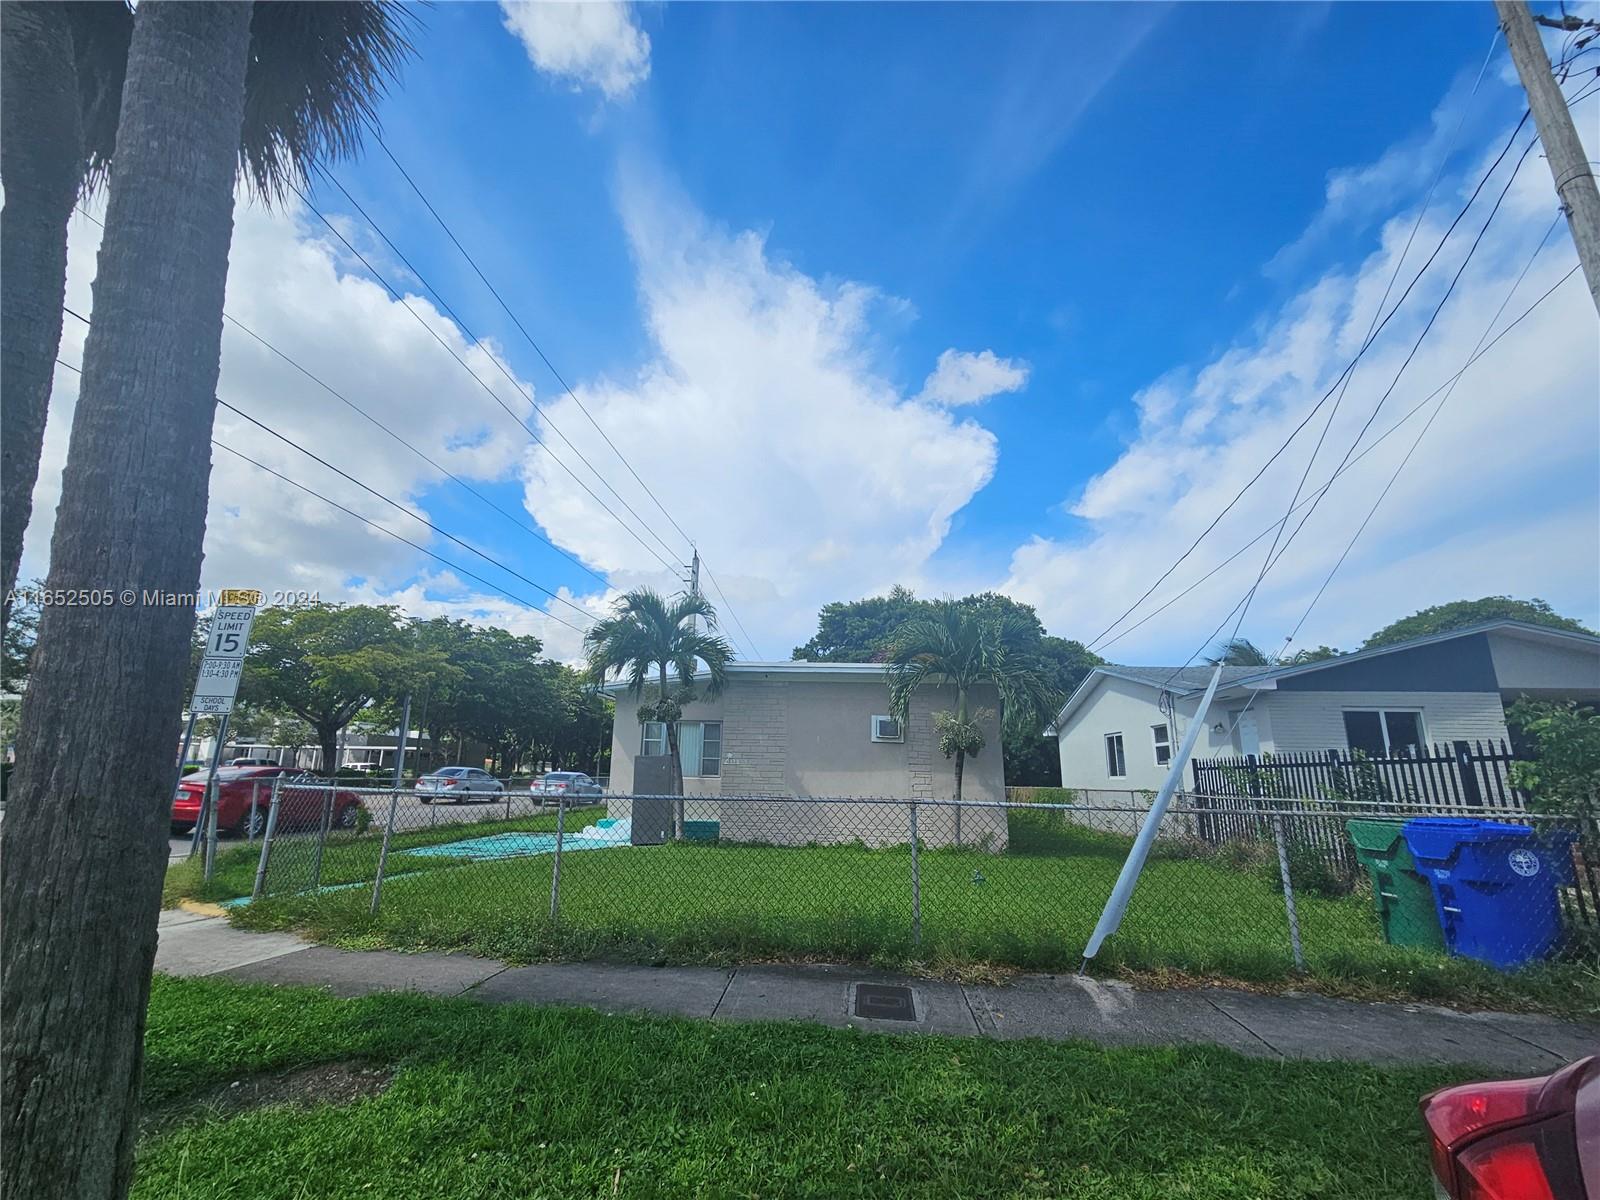
$275,000
2
bds
|
3
ba
|
1,196
sqft
|
built
1981
140 NW 87th Ave, Miami, FL 33172
$-470
Cash flow
-8.9%
Cash-on-Cash Return
4.1%
Cap rate
0.8%
Rent to Value Ratio
Active
$249,000
1
bds
|
1
ba
|
562
sqft
|
built
1972
665 NE 83rd Ter, Miami, FL 33138
$-477
Cash flow
-10.0%
Cash-on-Cash Return
3.9%
Cap rate
0.7%
Rent to Value Ratio
6,173 out of 7,007 properties for sale in Miami, FL
Limited Results Shown
Create a free account, or log in to reveal all property listings and enjoy the complete experience.
Active
$399,000
1
bds
|
1
ba
|
903
sqft
|
built
2007
133 NE 2nd Ave, Miami, FL 33132
$-1,243
Cash flow
-16.3%
Cash-on-Cash Return
2.4%
Cap rate
0.7%
Rent to Value Ratio
Active
$249,000
1
bds
|
1
ba
|
562
sqft
|
built
1972
665 NE 83rd Ter, Miami, FL 33138
$-477
Cash flow
-10.0%
Cash-on-Cash Return
3.9%
Cap rate
0.7%
Rent to Value Ratio
Active
$1,899,000
3
bds
|
3
ba
|
2,070
sqft
|
built
1968
5231 SW 65th Ave, Miami, FL 33155
$-3,366
Cash flow
-9.2%
Cash-on-Cash Return
4.0%
Cap rate
0.5%
Rent to Value Ratio

Active
$875,000
8
bds
|
0
ba
|
3,495
sqft
|
built
1971
14871 NE 14th Ave, Miami, FL 33161
$-3,707
Cash flow
-22.1%
Cash-on-Cash Return
1.1%
Cap rate
0.3%
Rent to Value Ratio
Active
$450,000
2
bds
|
2
ba
|
930
sqft
|
built
1998
185 SE 14th Ter, Miami, FL 33131
$-1,757
Cash flow
-20.4%
Cash-on-Cash Return
1.5%
Cap rate
0.7%
Rent to Value Ratio
Active
$1,450,000
3
bds
|
1
ba
|
1,256
sqft
|
built
1930
287 NW 31st St, Miami, FL 33127
$-6,130
Cash flow
-22.1%
Cash-on-Cash Return
1.1%
Cap rate
0.3%
Rent to Value Ratio

Active
$599,000
1
bds
|
2
ba
|
981
sqft
|
built
2006
41 SE 5th St, Miami, FL 33131
$-1,628
Cash flow
-14.2%
Cash-on-Cash Return
2.9%
Cap rate
0.7%
Rent to Value Ratio

Active
$1,619,452
3
bds
|
4
ba
|
1,526
sqft
|
built
2018
3131 NE 7th Ave, Miami, FL 33137
$-6,189
Cash flow
-19.9%
Cash-on-Cash Return
1.6%
Cap rate
0.5%
Rent to Value Ratio

Active
$369,000
1
bds
|
1
ba
|
526
sqft
|
built
2016
151 SE 1st St, Miami, FL 33131
$-1,133
Cash flow
-16.0%
Cash-on-Cash Return
2.5%
Cap rate
0.7%
Rent to Value Ratio

Active
$450,000
1
bds
|
1
ba
|
791
sqft
|
built
2004
2101 Brickell Ave, Miami, FL 33129
$-1,510
Cash flow
-17.5%
Cash-on-Cash Return
2.1%
Cap rate
0.7%
Rent to Value Ratio
Active
$464,000
1
bds
|
2
ba
|
735
sqft
|
built
2007
3470 E Coast Ave, Miami, FL 33137
$-1,735
Cash flow
-19.5%
Cash-on-Cash Return
1.7%
Cap rate
0.7%
Rent to Value Ratio
Active
$360,000
1
bds
|
1
ba
|
533
sqft
|
built
2016
151 SE 1st St, Miami, FL 33131
$-1,218
Cash flow
-17.7%
Cash-on-Cash Return
2.1%
Cap rate
0.7%
Rent to Value Ratio

Active
$1,000,000
4
bds
|
2
ba
|
1,680
sqft
|
built
1924
5501 NW 2nd Ave, Miami, FL 33127
$-2,185
Cash flow
-11.4%
Cash-on-Cash Return
3.5%
Cap rate
0.4%
Rent to Value Ratio

Active
$925,000
2
bds
|
3
ba
|
1,477
sqft
|
built
2009
1100 Biscayne Blvd, Miami, FL 33132
$-3,610
Cash flow
-20.4%
Cash-on-Cash Return
1.5%
Cap rate
0.7%
Rent to Value Ratio
Active
$470,000
2
bds
|
1
ba
|
1,073
sqft
|
built
1950
1195 NW 48th St, Miami, FL 33127
$-804
Cash flow
-8.9%
Cash-on-Cash Return
4.1%
Cap rate
0.6%
Rent to Value Ratio
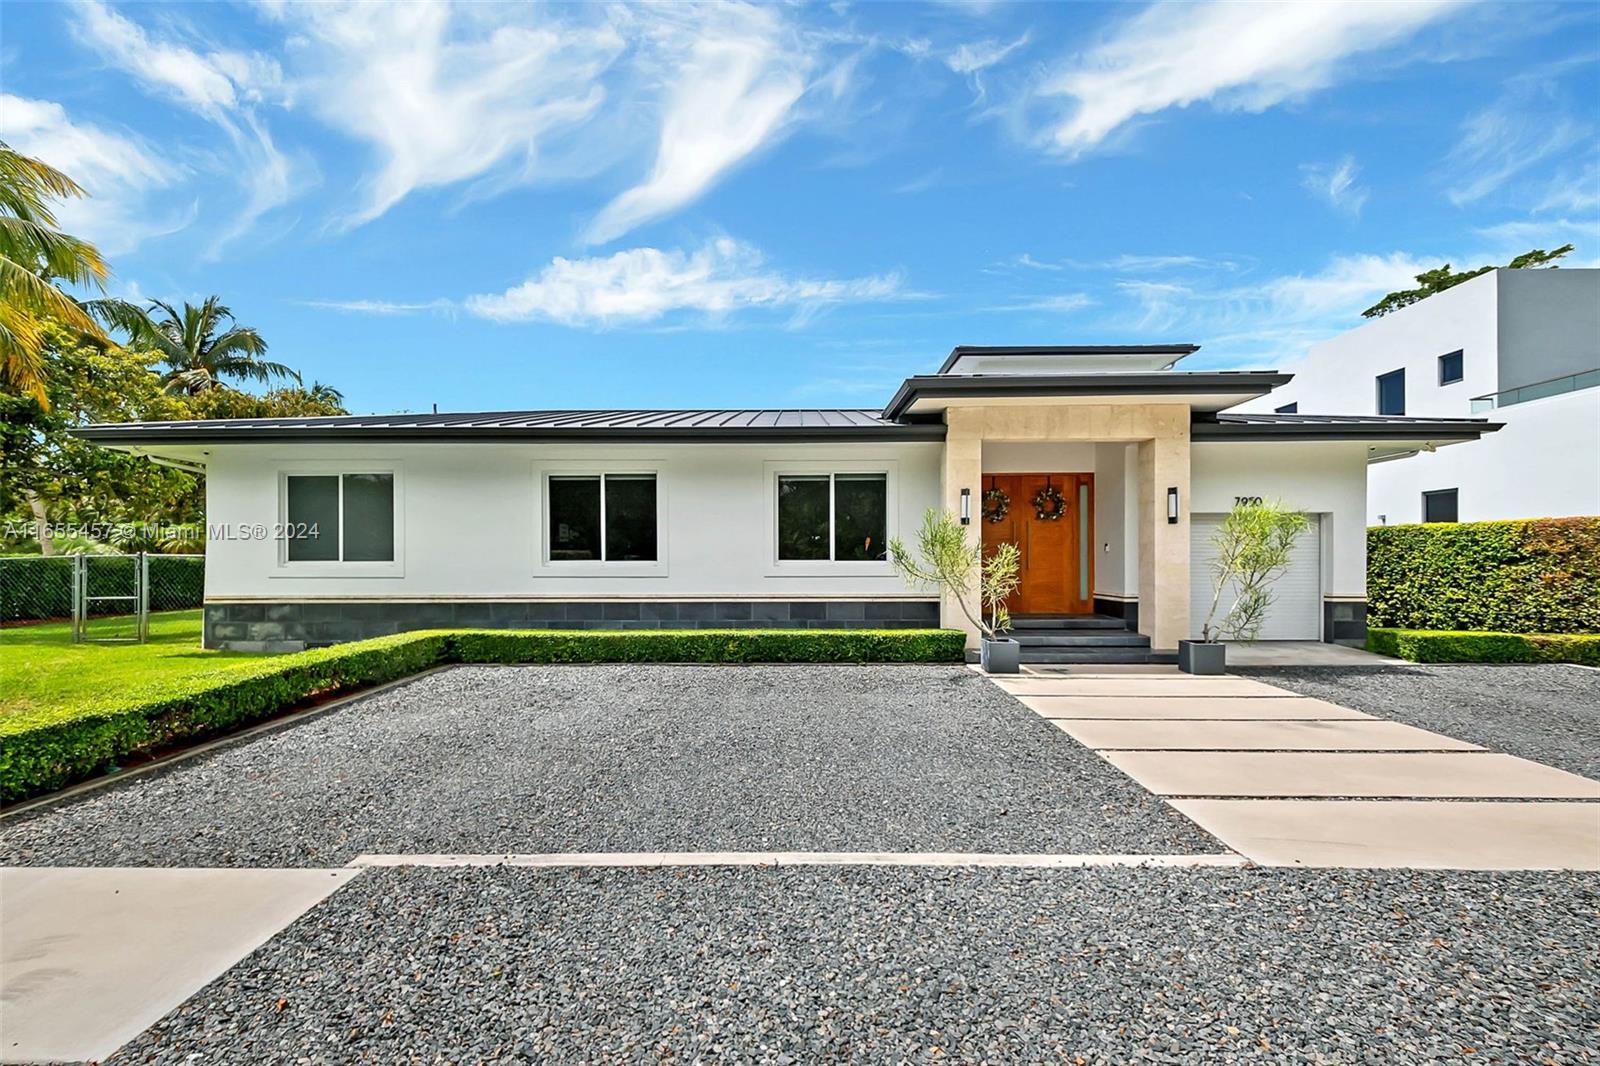
Active
$3,750,000
5
bds
|
5
ba
|
3,848
sqft
|
built
2019
7950 SW 54th Ave, Miami, FL 33143
$-12,753
Cash flow
-17.7%
Cash-on-Cash Return
2.1%
Cap rate
0.3%
Rent to Value Ratio
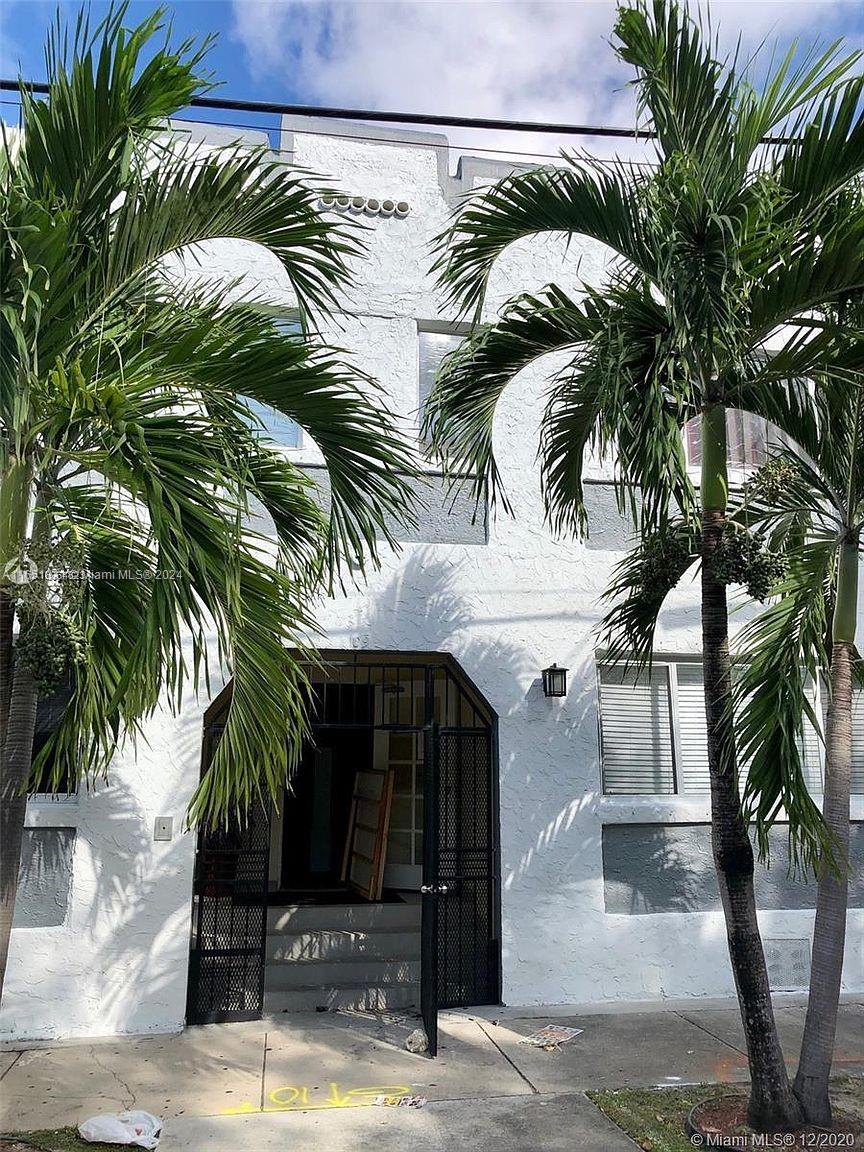
Active
$245,000
1
bds
|
1
ba
|
725
sqft
|
built
1925
109 NW 6th Ave, Miami, FL 33128
$-604
Cash flow
-12.9%
Cash-on-Cash Return
3.2%
Cap rate
0.8%
Rent to Value Ratio
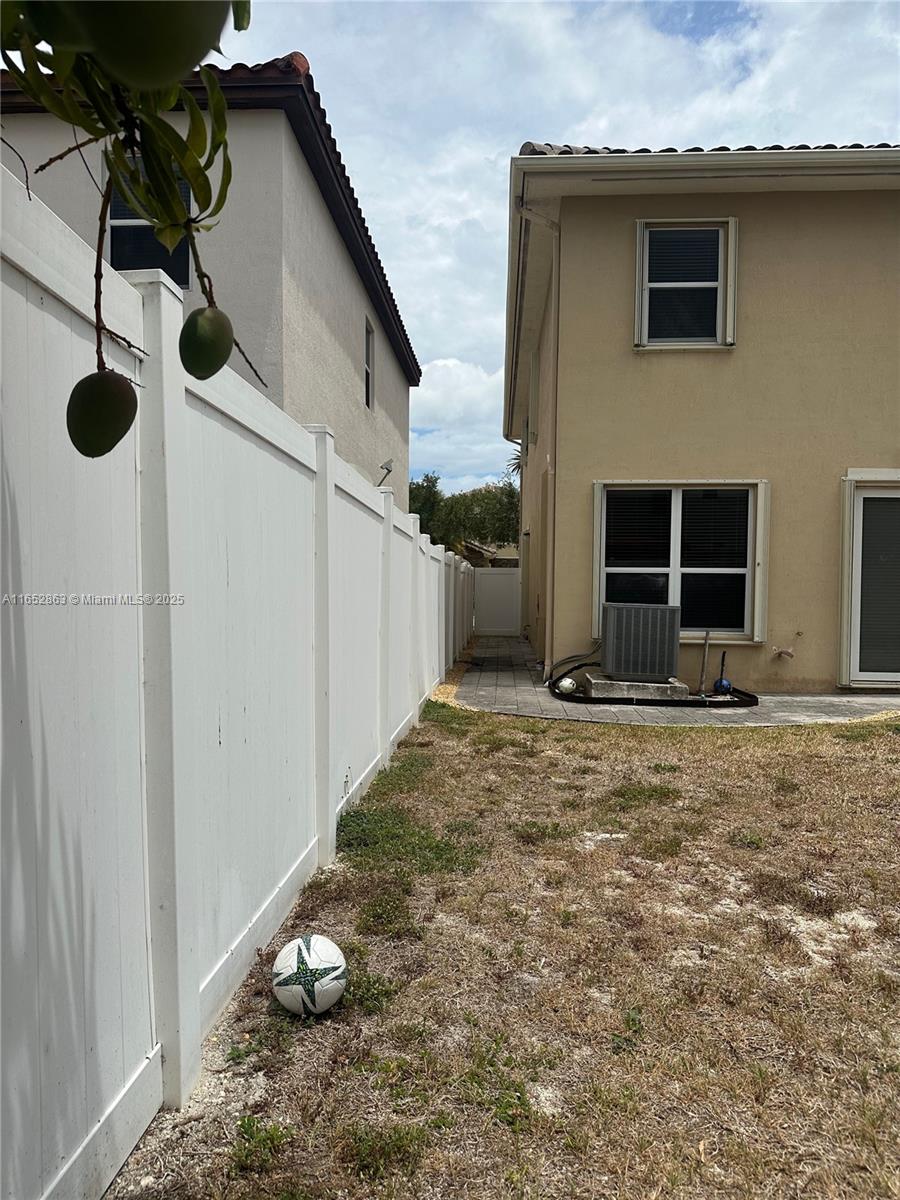
Pending
$769,000
4
bds
|
4
ba
|
2,640
sqft
|
built
2013
9180 SW 171st Ct, Miami, FL 33196
$-3,879
Cash flow
-26.3%
Cash-on-Cash Return
0.1%
Cap rate
0.2%
Rent to Value Ratio
Active
$399,900
1
bds
|
1
ba
|
842
sqft
|
built
2007
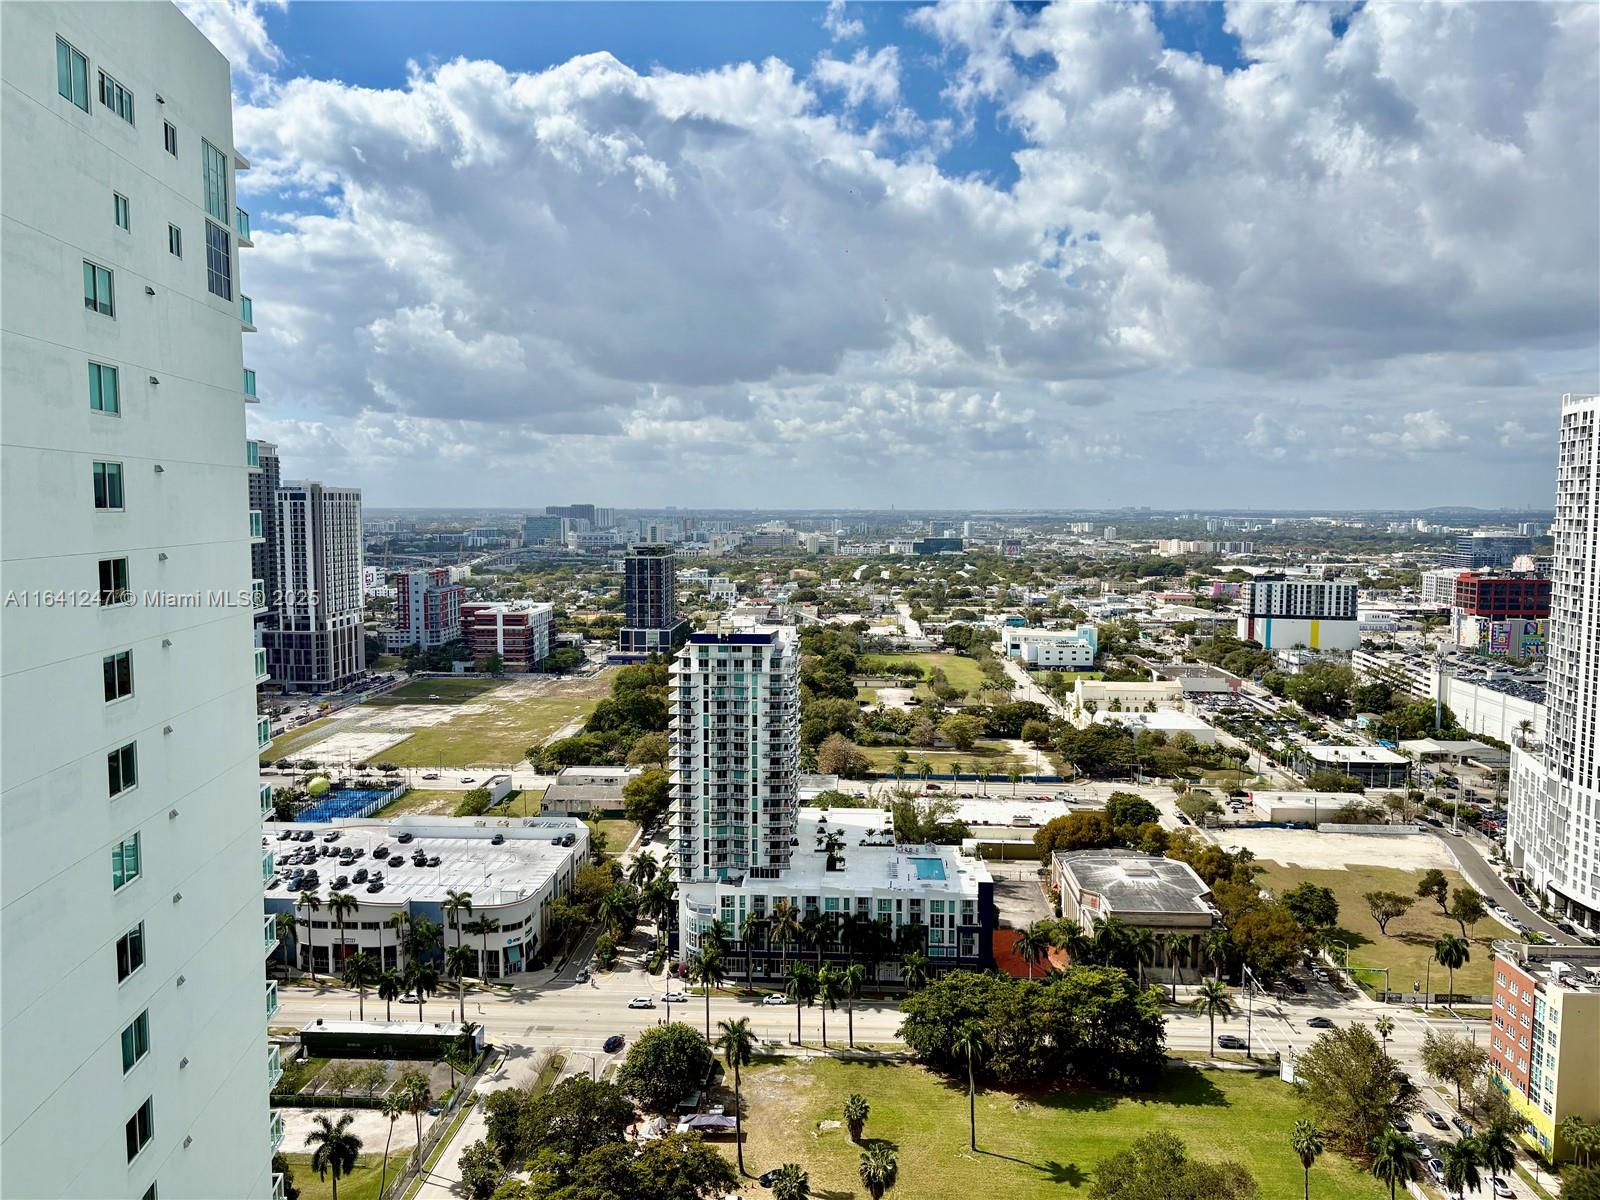
1800 N Bayshore Dr, Miami, FL 33132
$-793
Cash flow
-10.3%
Cash-on-Cash Return
3.8%
Cap rate
0.8%
Rent to Value Ratio
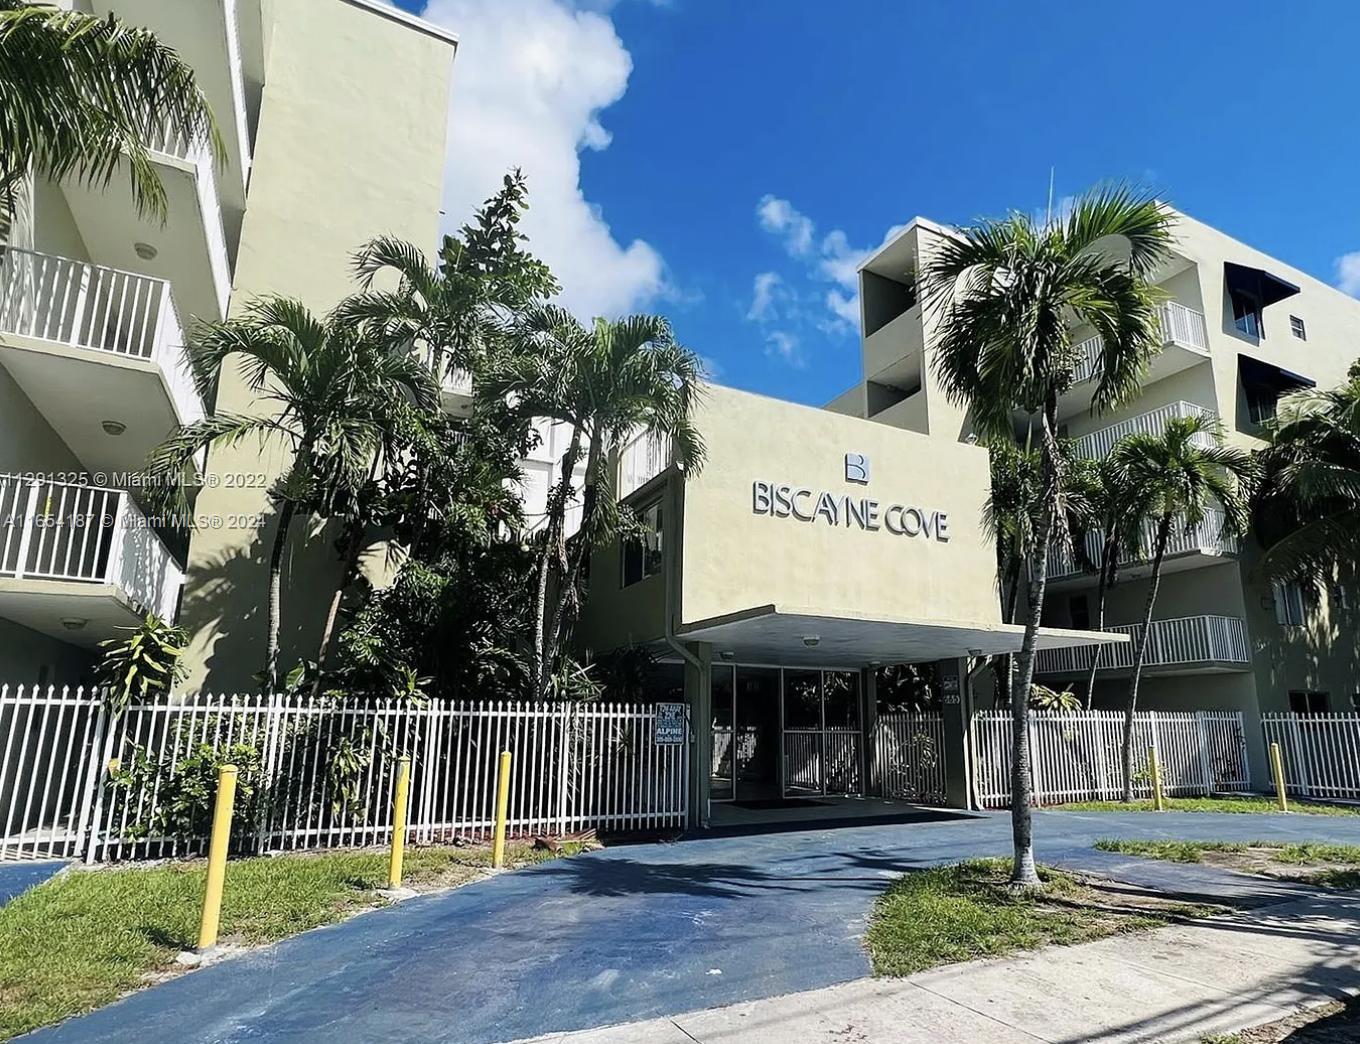
Active
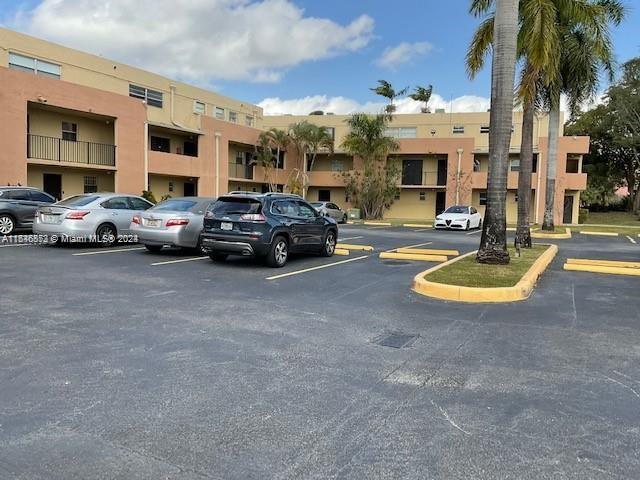
$280,000
2
bds
|
2
ba
|
994
sqft
|
built
1972
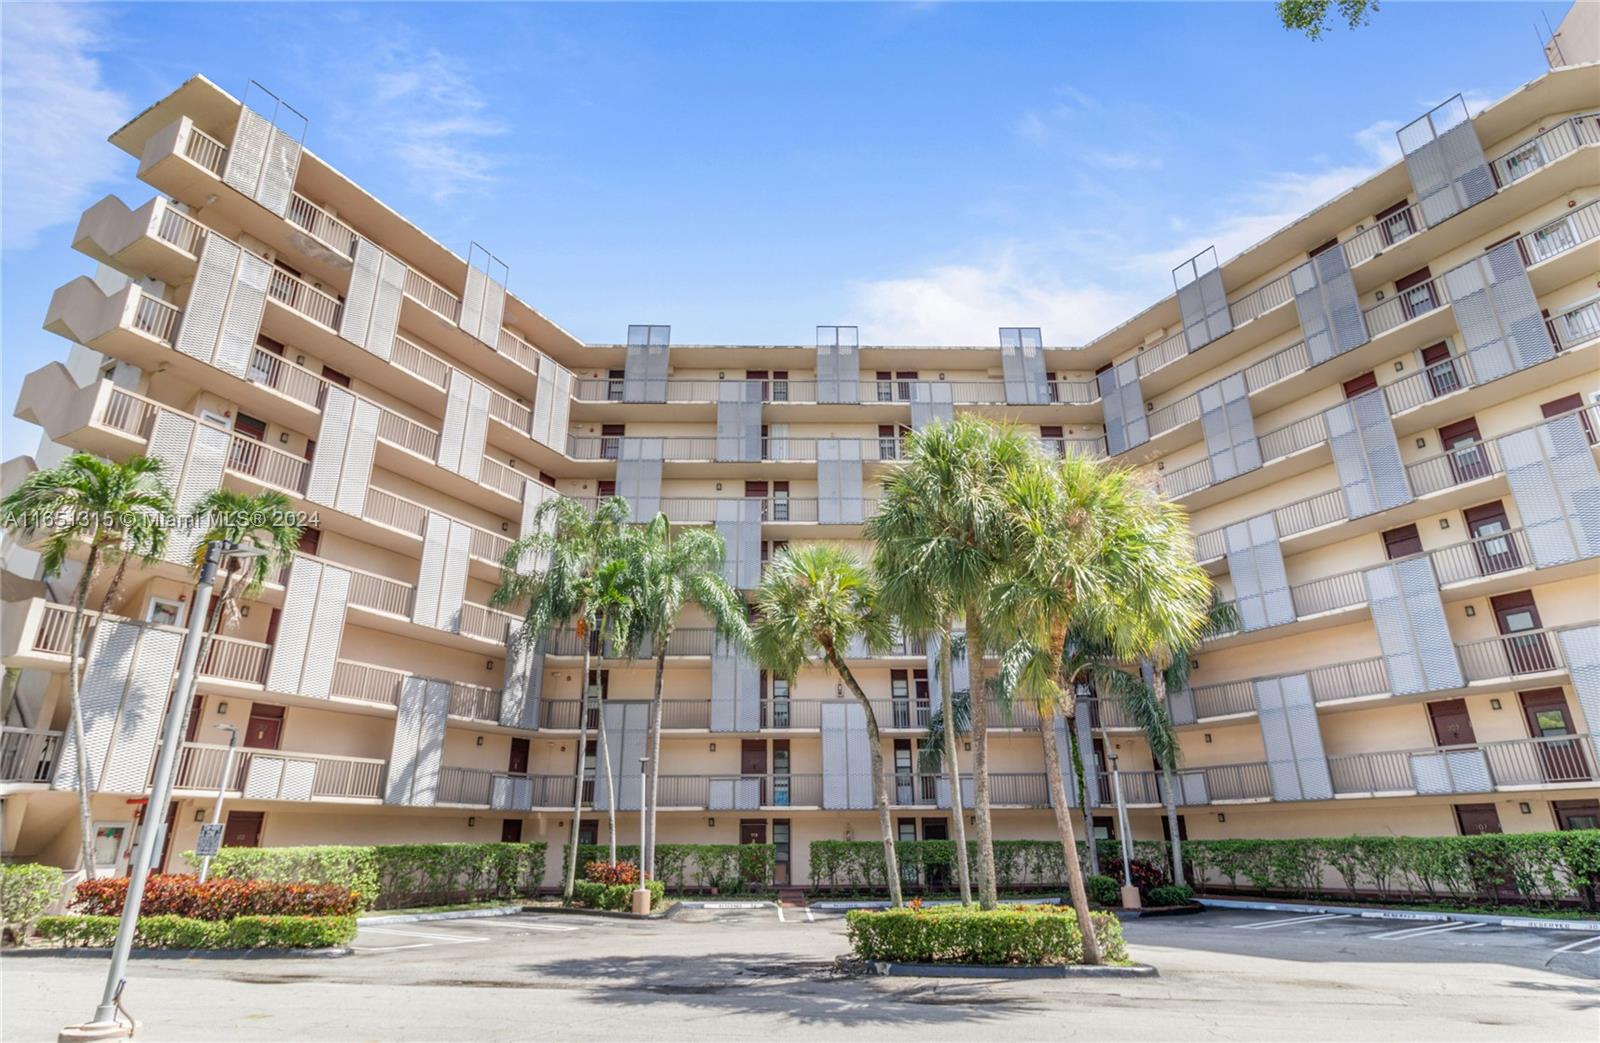
3301 N Country Club Dr, Miami, FL 33180
$-661
Cash flow
-12.3%
Cash-on-Cash Return
3.3%
Cap rate
0.9%
Rent to Value Ratio

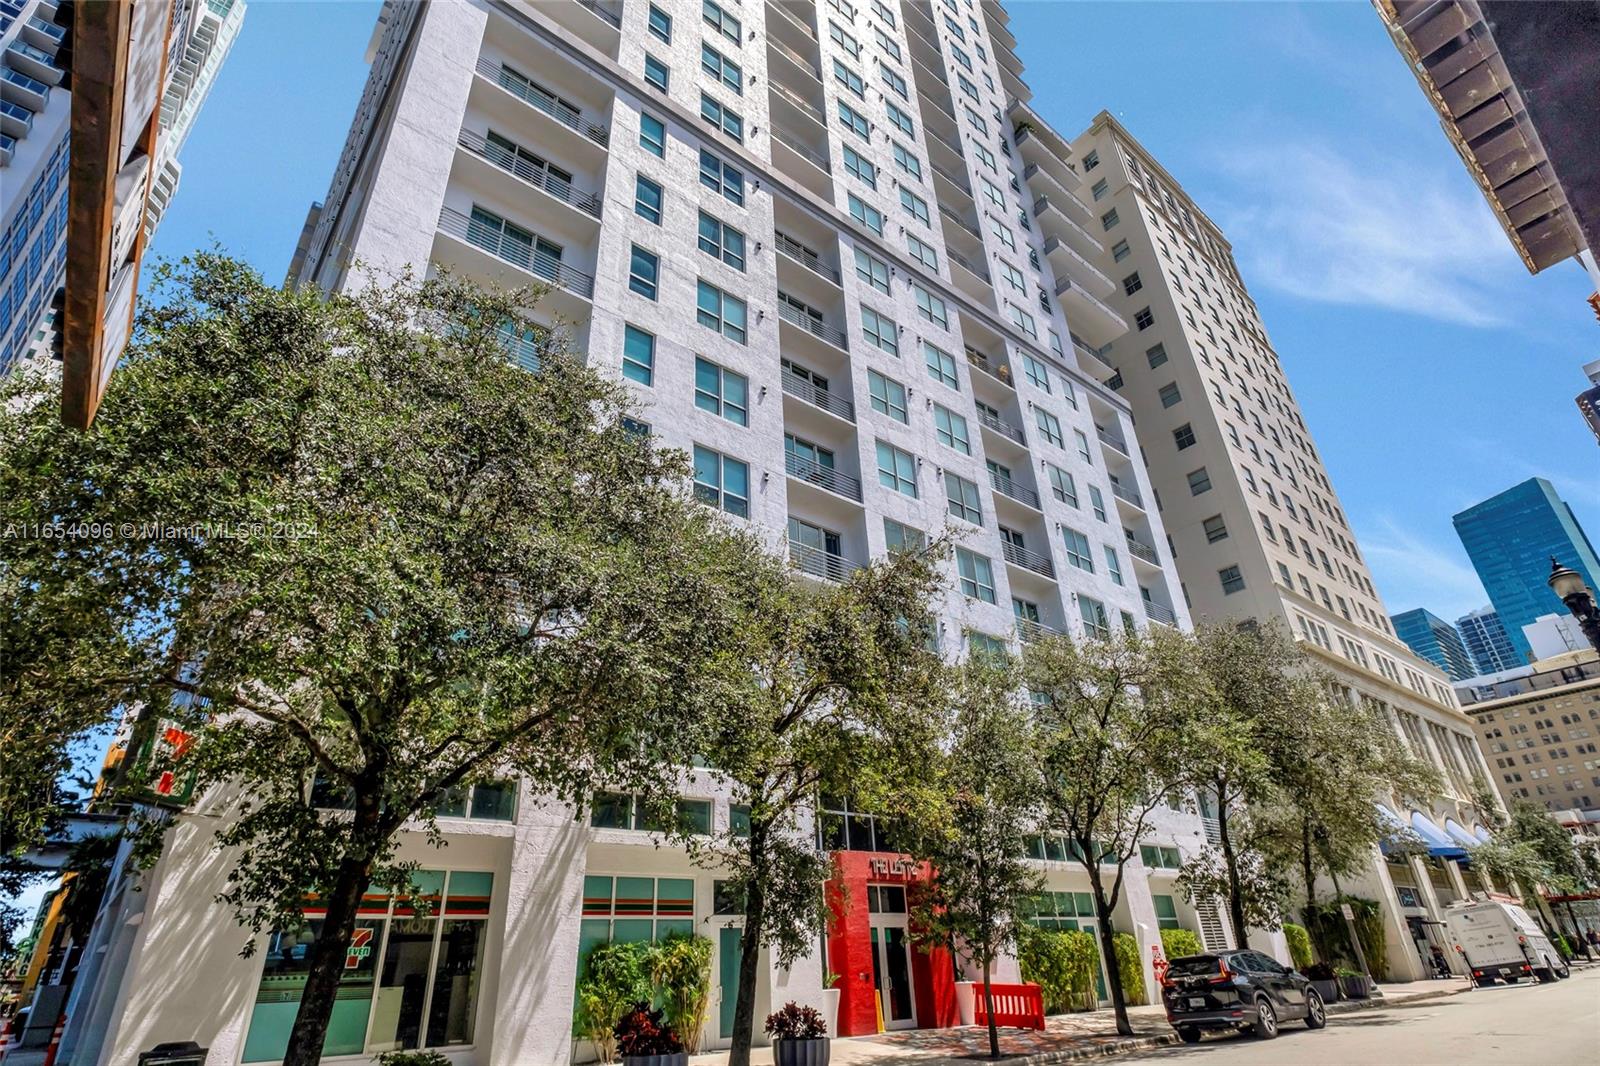
Active
$1,295,000
3
bds
|
3
ba
|
1,450
sqft
|
built
2018
801 S Miami Ave, Miami, FL 33130
$-4,231
Cash flow
-17.0%
Cash-on-Cash Return
2.2%
Cap rate
0.7%
Rent to Value Ratio
Active
$1,875,000
5
bds
|
4
ba
|
3,465
sqft
|
built
2007
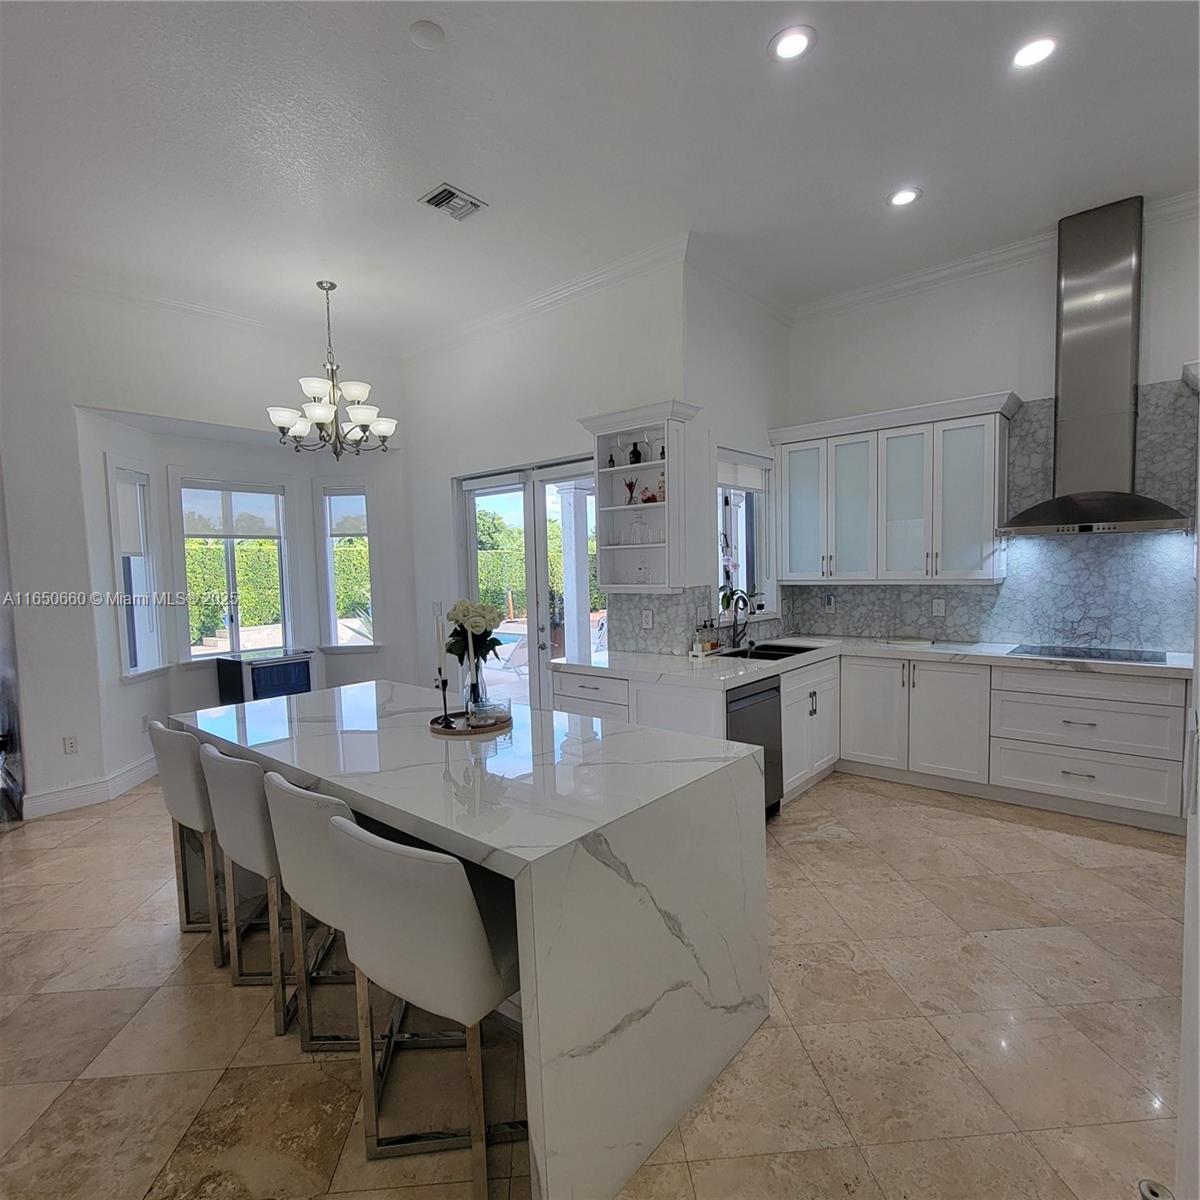
2621 SW 132nd Ave, Miami, FL 33175
$-4,140
Cash flow
-11.5%
Cash-on-Cash Return
3.5%
Cap rate
0.5%
Rent to Value Ratio

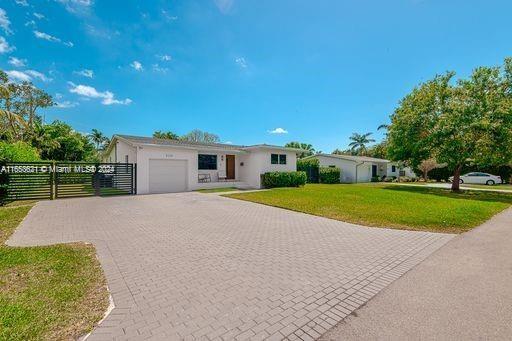
Active
$1,025,000
5
bds
|
4
ba
|
3,164
sqft
|
built
1949
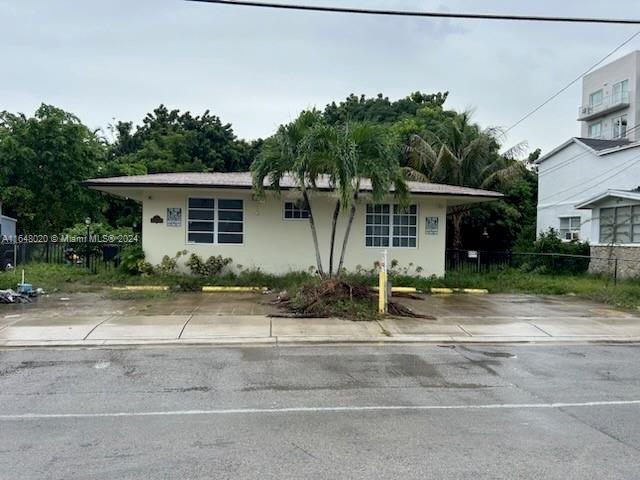
18690 NE 22nd Ave, Miami, FL 33180
$-3,352
Cash flow
-17.1%
Cash-on-Cash Return
2.2%
Cap rate
0.4%
Rent to Value Ratio

Active
$460,000
1
bds
|
1
ba
|
630
sqft
|
built
2006
170 SE 14th St, Miami, FL 33131
$-1,643
Cash flow
-18.6%
Cash-on-Cash Return
1.9%
Cap rate
0.6%
Rent to Value Ratio
Active
$1,500,000
4
bds
|
0
ba
|
2,358
sqft
|
built
1961
800 NE 85th St, Miami, FL 33138
$-7,113
Cash flow
-24.7%
Cash-on-Cash Return
0.5%
Cap rate
0.2%
Rent to Value Ratio

Active
$500,000
3
bds
|
4
ba
|
2,791
sqft
|
built
1968
11111 Biscayne Blvd, Miami, FL 33181
$-4,552
Cash flow
-47.5%
Cash-on-Cash Return
-4.8%
Cap rate
0.6%
Rent to Value Ratio
Active
$385,000
1
bds
|
1
ba
|
682
sqft
|
built
1990
770 Claughton Island Dr, Miami, FL 33131
$-1,260
Cash flow
-17.1%
Cash-on-Cash Return
2.2%
Cap rate
0.8%
Rent to Value Ratio
Active
$750,000
2
bds
|
0
ba
|
1,248
sqft
|
built
1951
7710 NE 1st Ct, Miami, FL 33138
$-2,873
Cash flow
-20.0%
Cash-on-Cash Return
1.6%
Cap rate
0.3%
Rent to Value Ratio
Active
$350,000
2
bds
|
2
ba
|
958
sqft
|
built
1985
10145 NW 9th Street Cir, Miami, FL 33172
$-665
Cash flow
-9.9%
Cash-on-Cash Return
3.9%
Cap rate
0.7%
Rent to Value Ratio

Active
$790,000
1
bds
|
2
ba
|
1,185
sqft
|
built
2019
851 NE 1st Ave, Miami, FL 33132
$-3,624
Cash flow
-23.9%
Cash-on-Cash Return
0.6%
Cap rate
0.6%
Rent to Value Ratio

Active
$340,000
2
bds
|
2
ba
|
1,131
sqft
|
built
1975
9150 Fontainebleau Blvd, Miami, FL 33172
$-559
Cash flow
-8.6%
Cash-on-Cash Return
4.2%
Cap rate
0.7%
Rent to Value Ratio
Active
$780,000
4
bds
|
3
ba
|
1,970
sqft
|
built
1993
14862 SW 169th Ln, Miami, FL 33187
$-2,063
Cash flow
-13.8%
Cash-on-Cash Return
3.0%
Cap rate
0.5%
Rent to Value Ratio
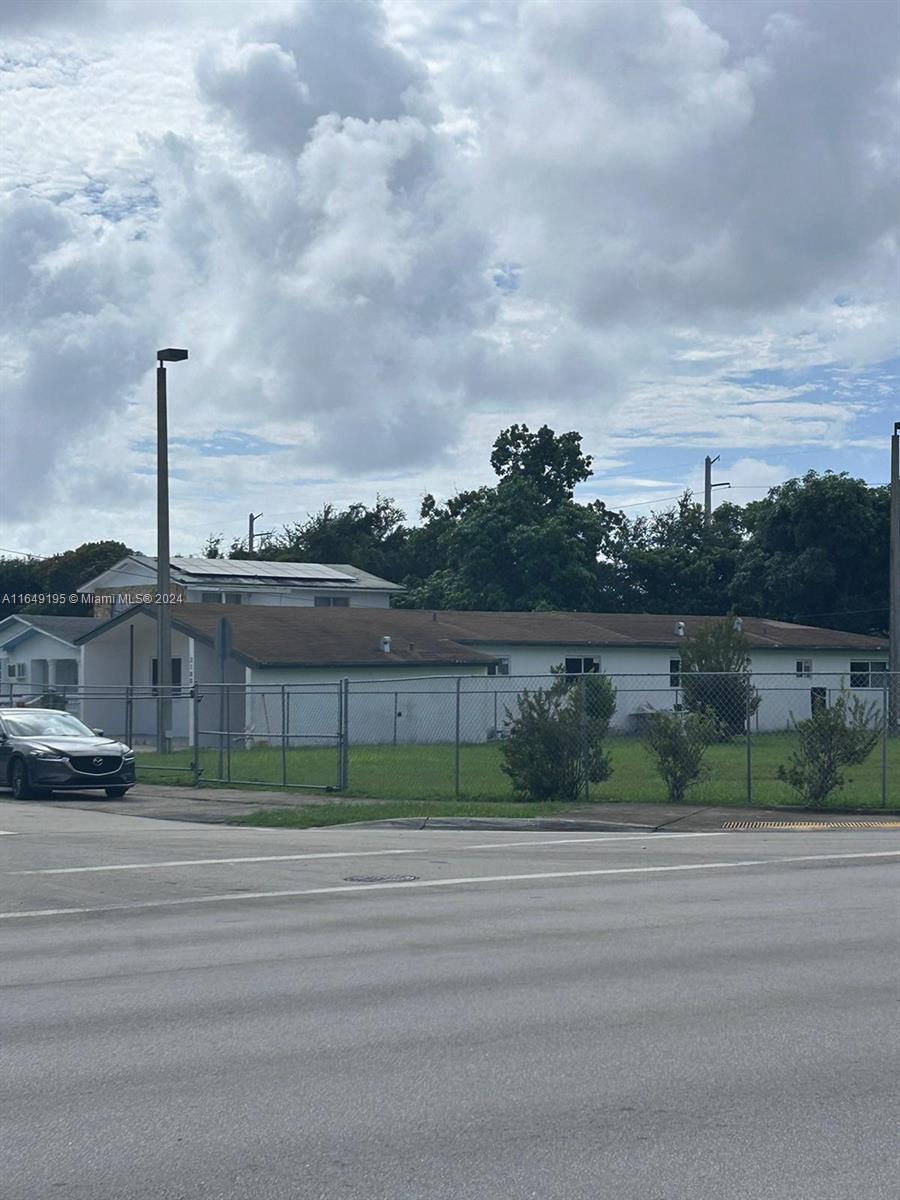
Active
$740,000
6
bds
|
0
ba
|
1,988
sqft
|
built
1956
2180 NW 59th St, Miami, FL 33142
$-2,661
Cash flow
-18.8%
Cash-on-Cash Return
1.8%
Cap rate
0.3%
Rent to Value Ratio
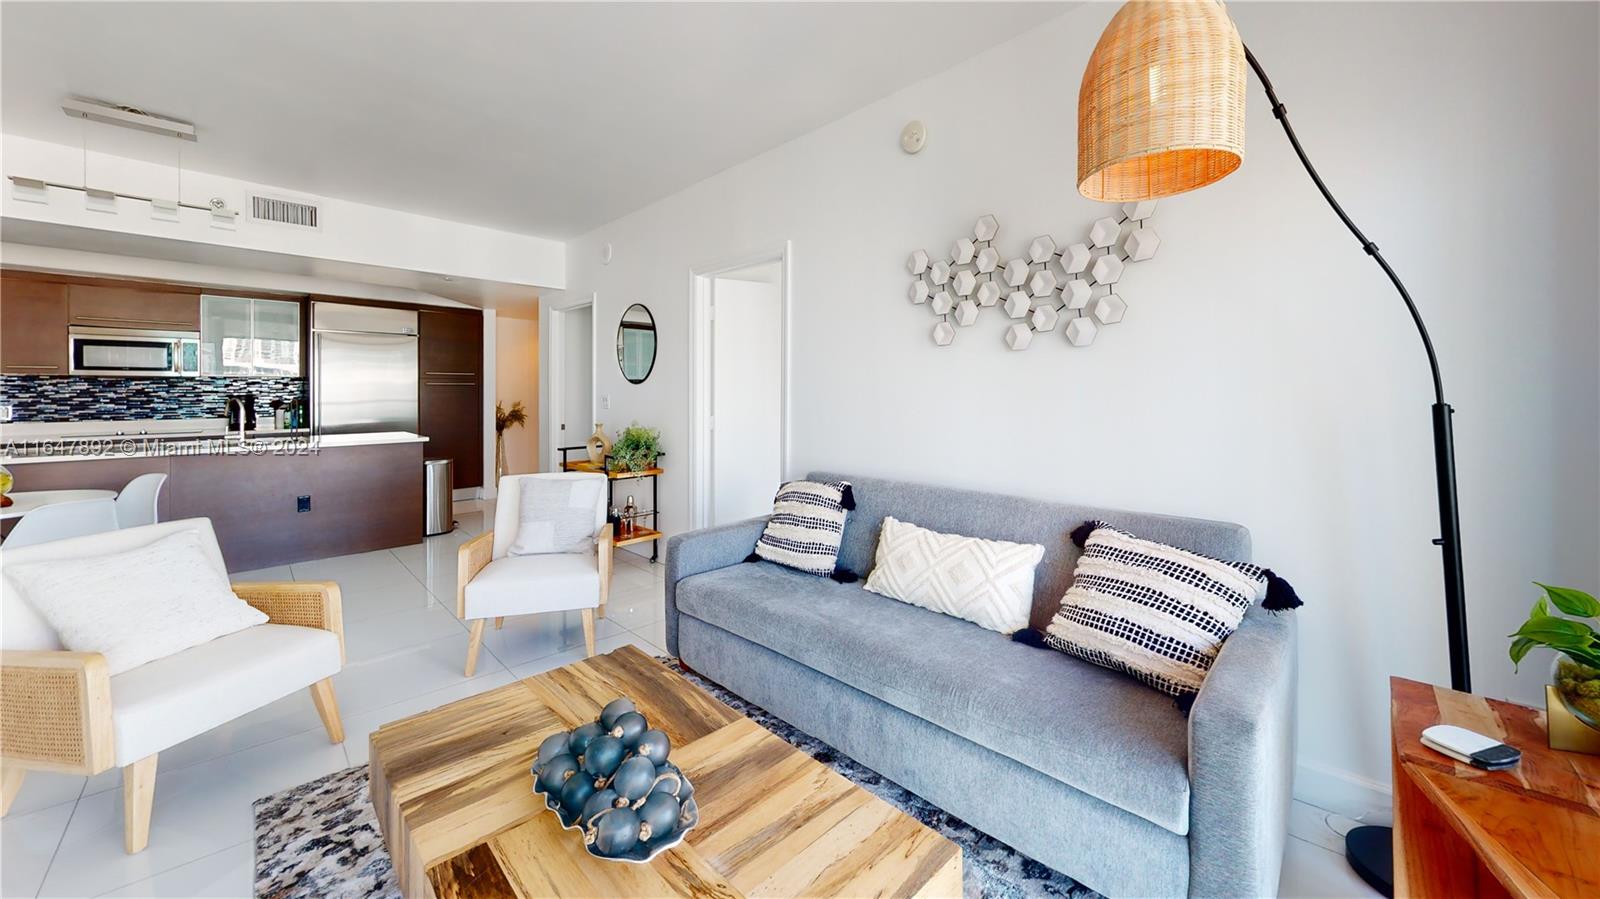
Active
$699,000
2
bds
|
2
ba
|
1,124
sqft
|
built
2008
500 Brickell Ave, Miami, FL 33131
$-2,902
Cash flow
-21.7%
Cash-on-Cash Return
1.2%
Cap rate
0.6%
Rent to Value Ratio
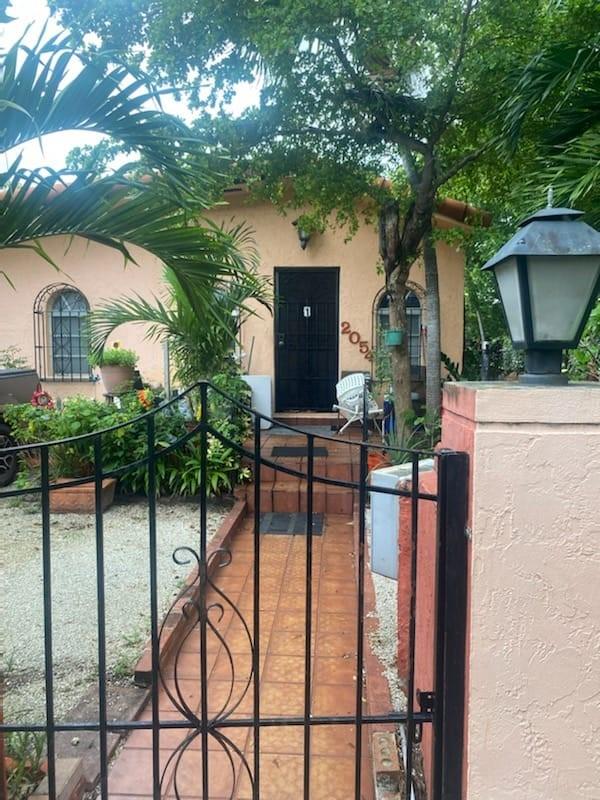
Active
$796,555
6
bds
|
0
ba
|
3,048
sqft
|
built
1941
2054 SW 5th St, Miami, FL 33135
$-3,862
Cash flow
-25.3%
Cash-on-Cash Return
0.3%
Cap rate
0.3%
Rent to Value Ratio
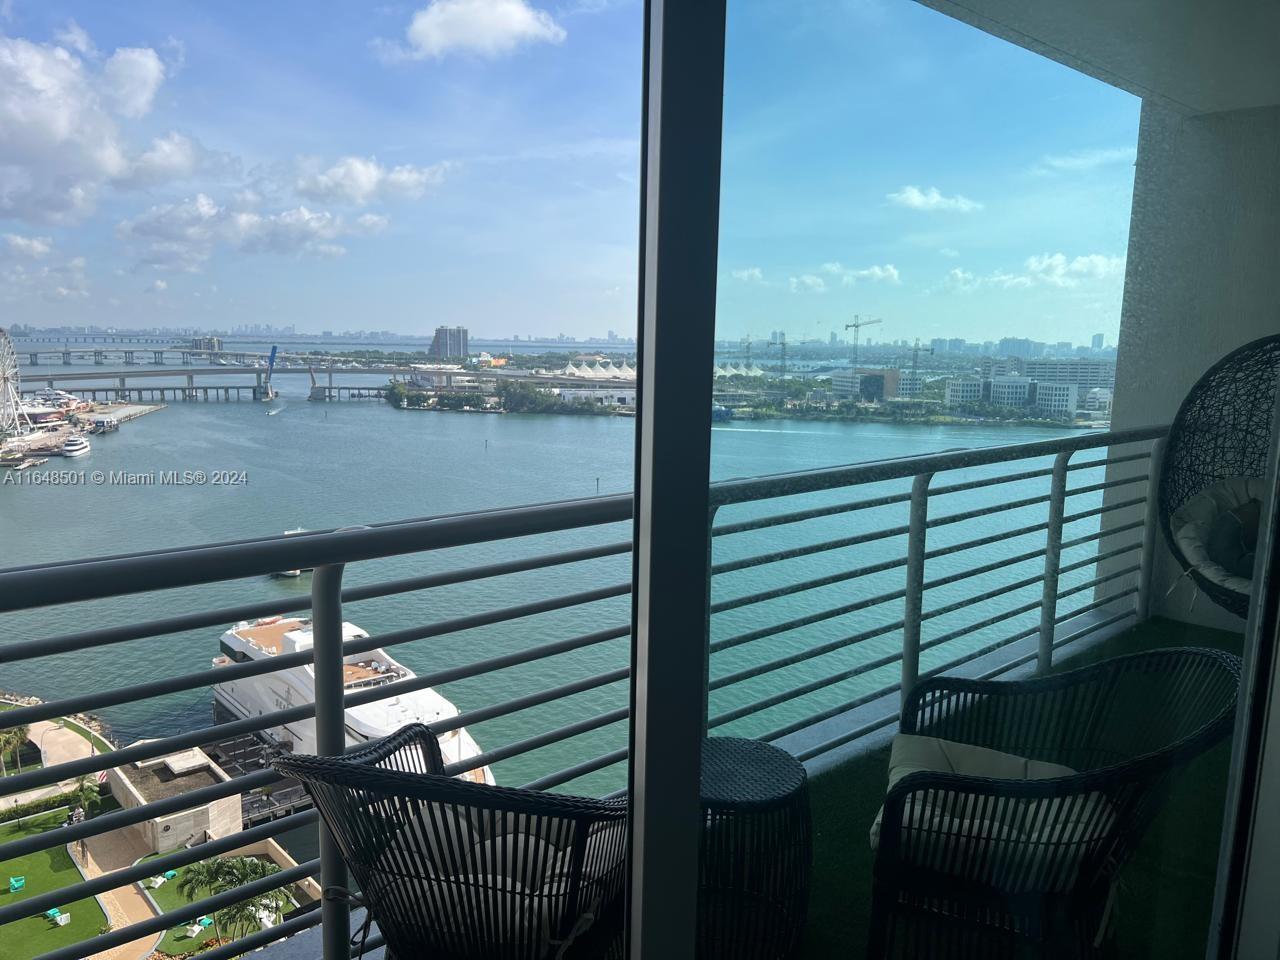
Active
$590,000
1
bds
|
1
ba
|
846
sqft
|
built
2005
335 S Biscayne Blvd, Miami, FL 33131
$-2,353
Cash flow
-20.8%
Cash-on-Cash Return
1.4%
Cap rate
0.5%
Rent to Value Ratio
Active
$4,995,000
6
bds
|
7
ba
|
4,345
sqft
|
built
2023
700 NE 26th Ter, Miami, FL 33137
$-25,921
Cash flow
-27.1%
Cash-on-Cash Return
-0.1%
Cap rate
0.2%
Rent to Value Ratio
Active
$275,000
2
bds
|
3
ba
|
1,196
sqft
|
built
1981
140 NW 87th Ave, Miami, FL 33172
$-470
Cash flow
-8.9%
Cash-on-Cash Return
4.1%
Cap rate
0.8%
Rent to Value Ratio
Active
$349,900
1
bds
|
2
ba
|
978
sqft
|
built
2008
253 NE 2nd St, Miami, FL 33132
$-1,555
Cash flow
-23.2%
Cash-on-Cash Return
0.8%
Cap rate
0.8%
Rent to Value Ratio
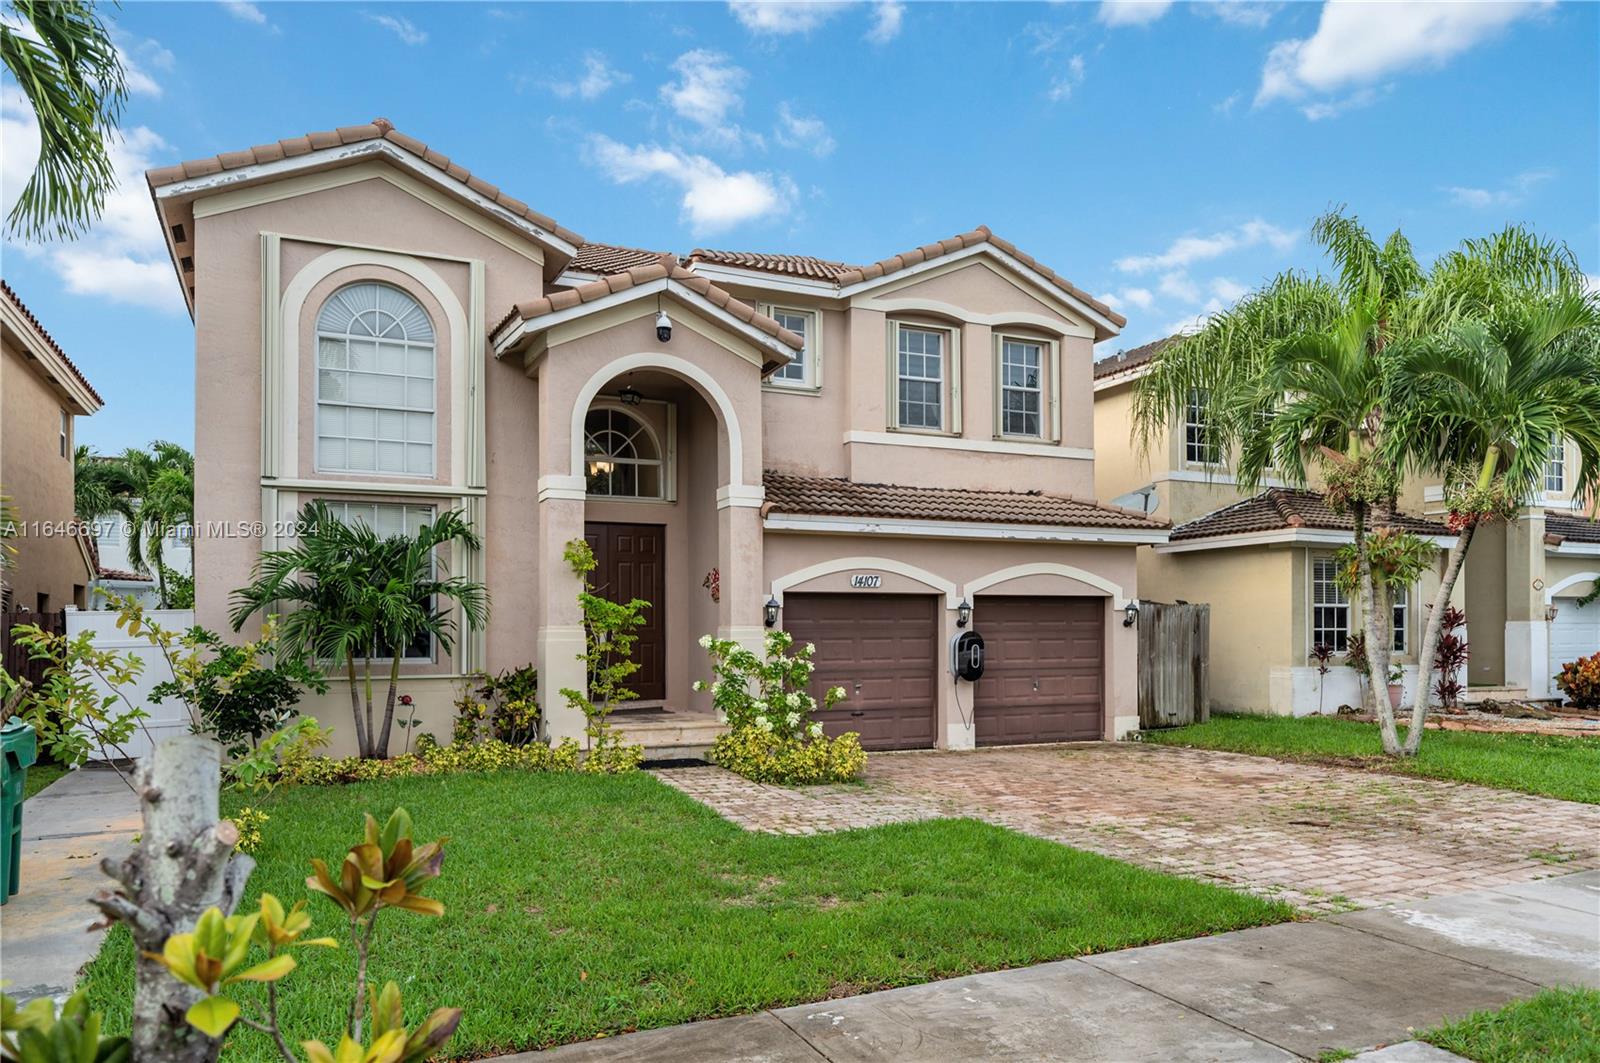
Active
$769,999
4
bds
|
3
ba
|
2,539
sqft
|
built
2003
14107 SW 155th St, Miami, FL 33177
$-1,228
Cash flow
-8.3%
Cash-on-Cash Return
4.2%
Cap rate
0.6%
Rent to Value Ratio