Miami, FL Investment Properties for Sale
Browse homes for sale and investment properties in Miami, FL. Refine your search by price, property type, or more.
Best cash flowing properties in Miami, FL
Active
$349,000
2
bds
|
1
ba
|
1,080
sqft
|
built
1943
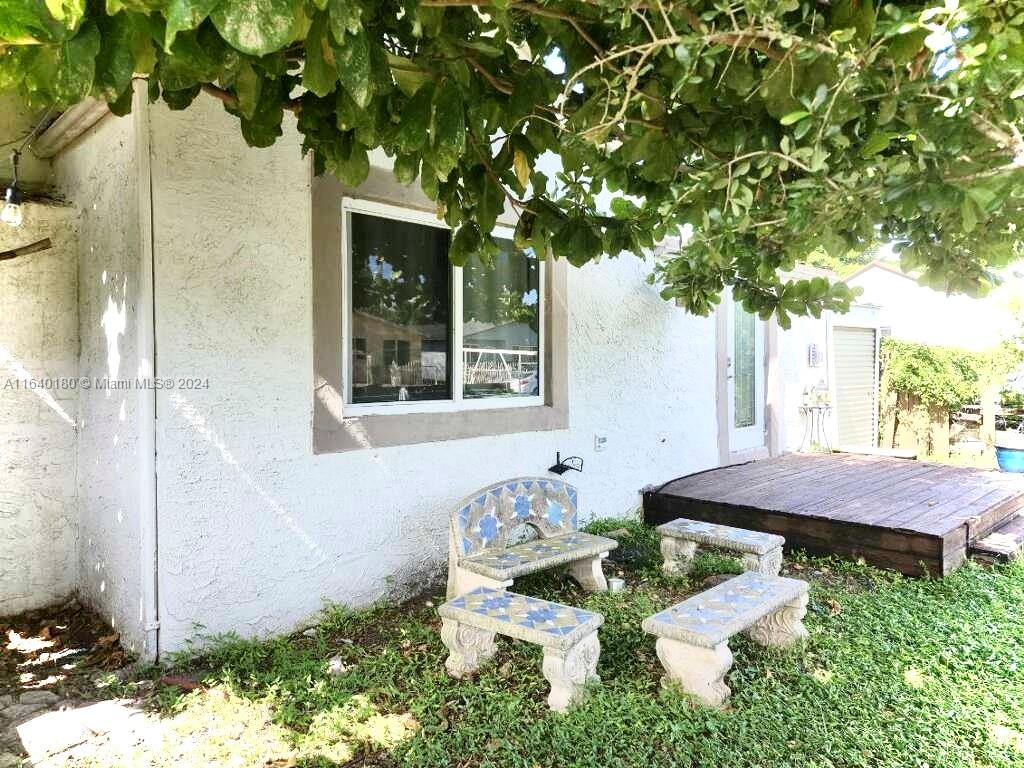
1851 NW 48th St, Miami, FL 33142
$-180
Cash flow
-2.7%
Cash-on-Cash Return
5.7%
Cap rate
0.7%
Rent to Value Ratio
Active
$349,000
2
bds
|
1
ba
|
752
sqft
|
built
1970
444 SW 4th St, Miami, FL 33130
$-473
Cash flow
-7.1%
Cash-on-Cash Return
4.7%
Cap rate
0.8%
Rent to Value Ratio
6,163 out of 6,996 properties for sale in Miami, FL
Limited Results Shown
Create a free account, or log in to reveal all property listings and enjoy the complete experience.
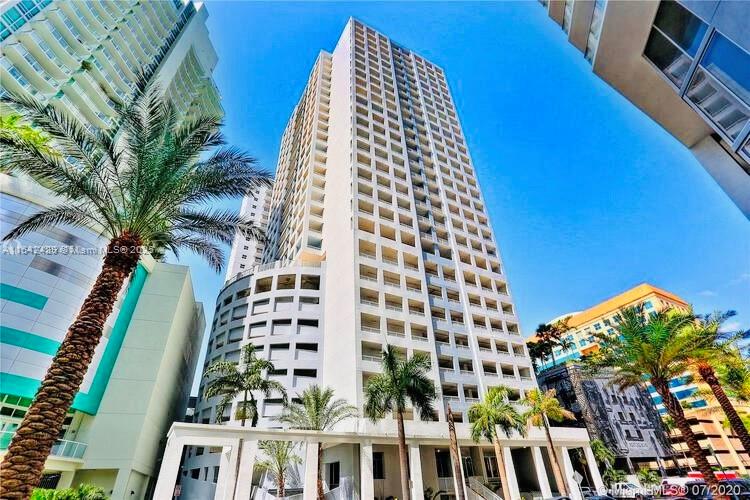
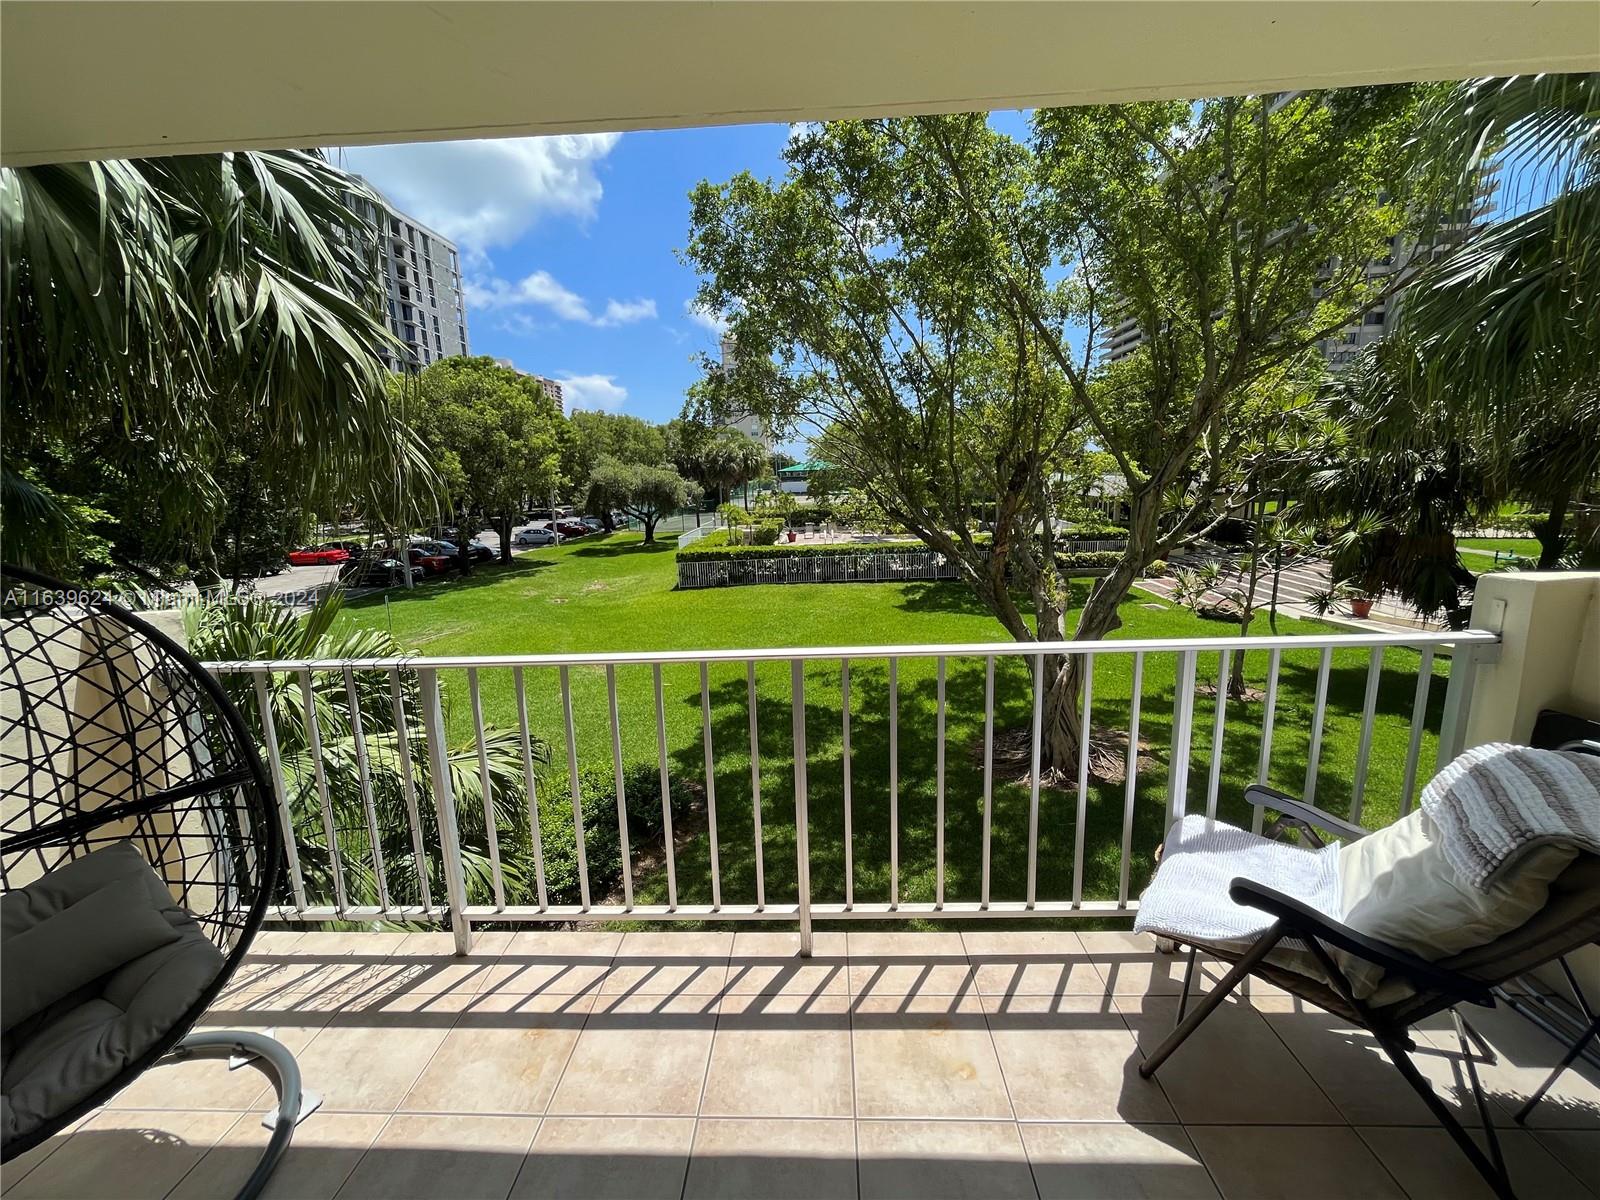
Active
$535,000
1
bds
|
1
ba
|
620
sqft
|
built
2017
45 SW 9th St, Miami, FL 33130
$-2,173
Cash flow
-21.2%
Cash-on-Cash Return
1.4%
Cap rate
0.6%
Rent to Value Ratio
Active
$2,380,000
4
bds
|
0
ba
|
1,344
sqft
|
built
1937
3308 NW 3rd Ave, Miami, FL 33127
$-9,798
Cash flow
-21.5%
Cash-on-Cash Return
1.3%
Cap rate
0.2%
Rent to Value Ratio
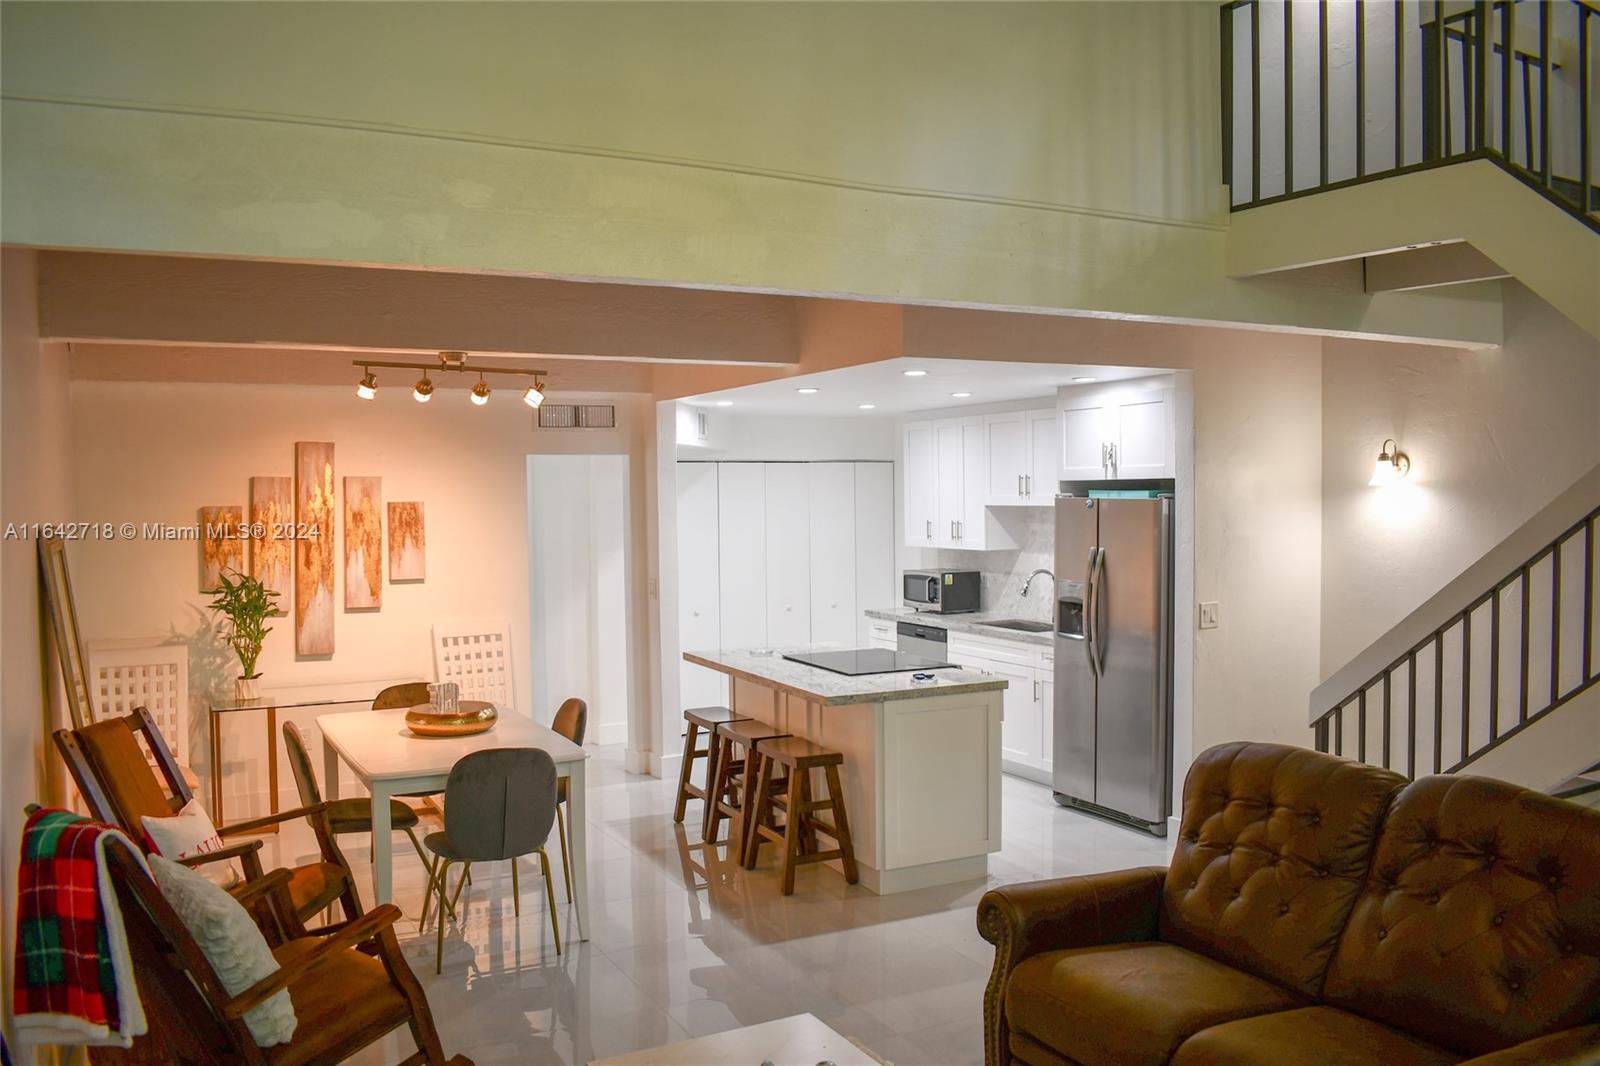
Active
$349,000
3
bds
|
3
ba
|
1,580
sqft
|
built
1981
5800 SW 127th Ave, Miami, FL 33183
$-514
Cash flow
-7.7%
Cash-on-Cash Return
4.5%
Cap rate
0.9%
Rent to Value Ratio

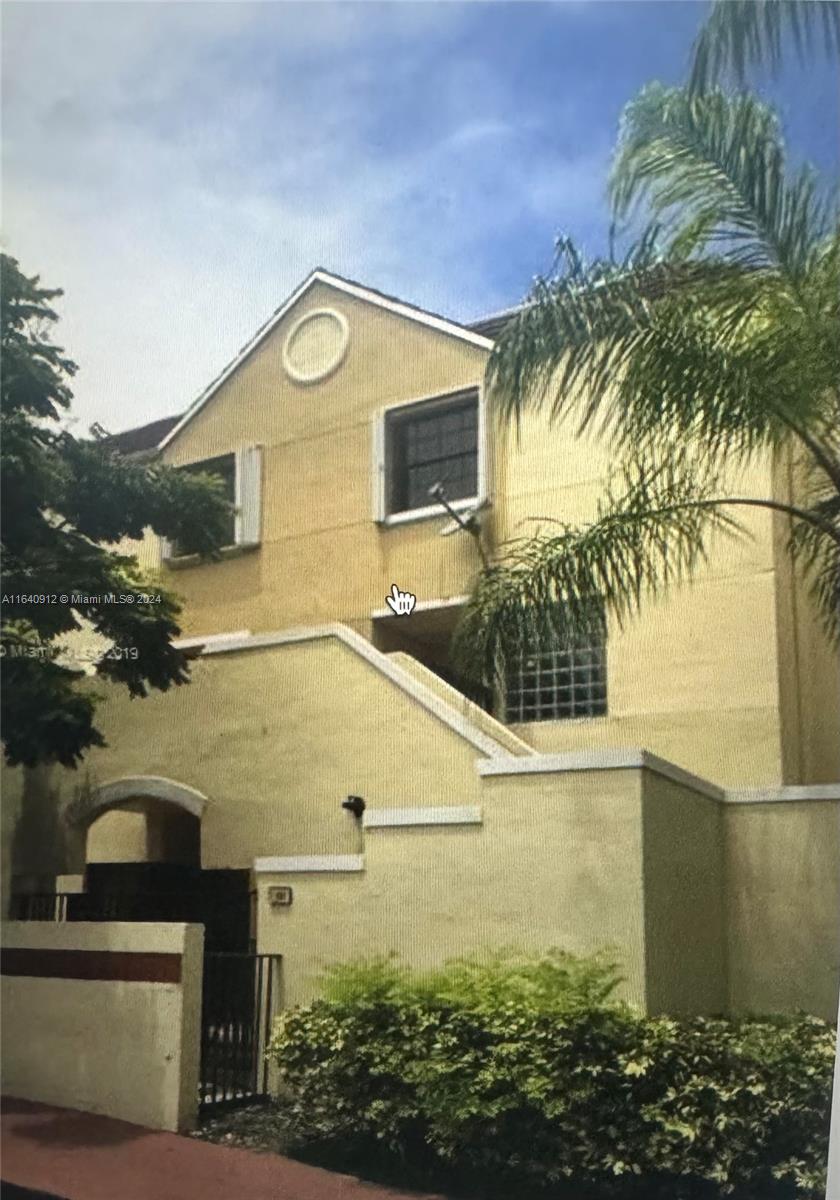
Active
$1,299,000
4
bds
|
4
ba
|
2,454
sqft
|
built
1981
2711 SW 117th Ave, Miami, FL 33175
$-1,046
Cash flow
-4.2%
Cash-on-Cash Return
5.3%
Cap rate
0.7%
Rent to Value Ratio
Active
$789,000
1
bds
|
1
ba
|
579
sqft
|
built
2022
398 NE 5th St, Miami, FL 33132
$-3,034
Cash flow
-20.1%
Cash-on-Cash Return
1.7%
Cap rate
0.5%
Rent to Value Ratio

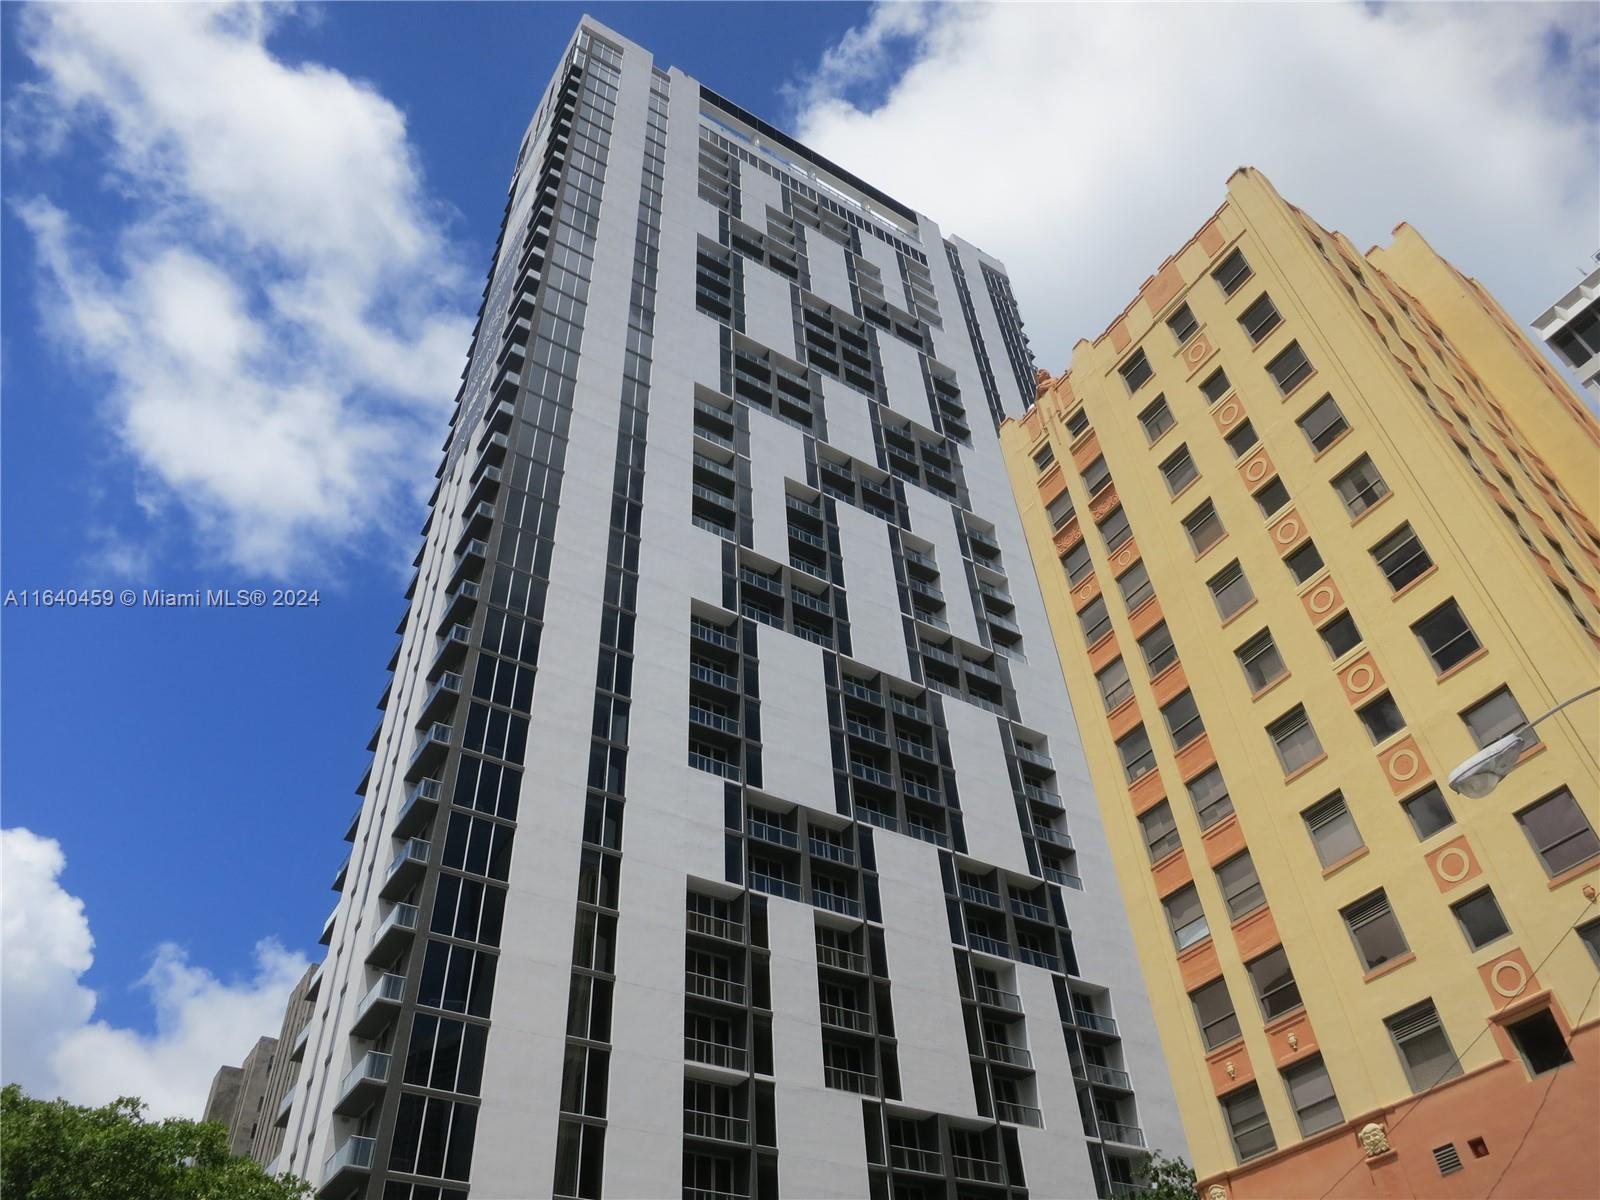
Active
$780,000
1
bds
|
1
ba
|
790
sqft
|
built
2009
485 Brickell Ave, Miami, FL 33131
$-2,198
Cash flow
-14.7%
Cash-on-Cash Return
2.9%
Cap rate
0.6%
Rent to Value Ratio
Active
$400,000
3
bds
|
3
ba
|
1,693
sqft
|
built
1974
19212 NE 25th Ave, Miami, FL 33180
$-979
Cash flow
-12.8%
Cash-on-Cash Return
3.3%
Cap rate
0.9%
Rent to Value Ratio

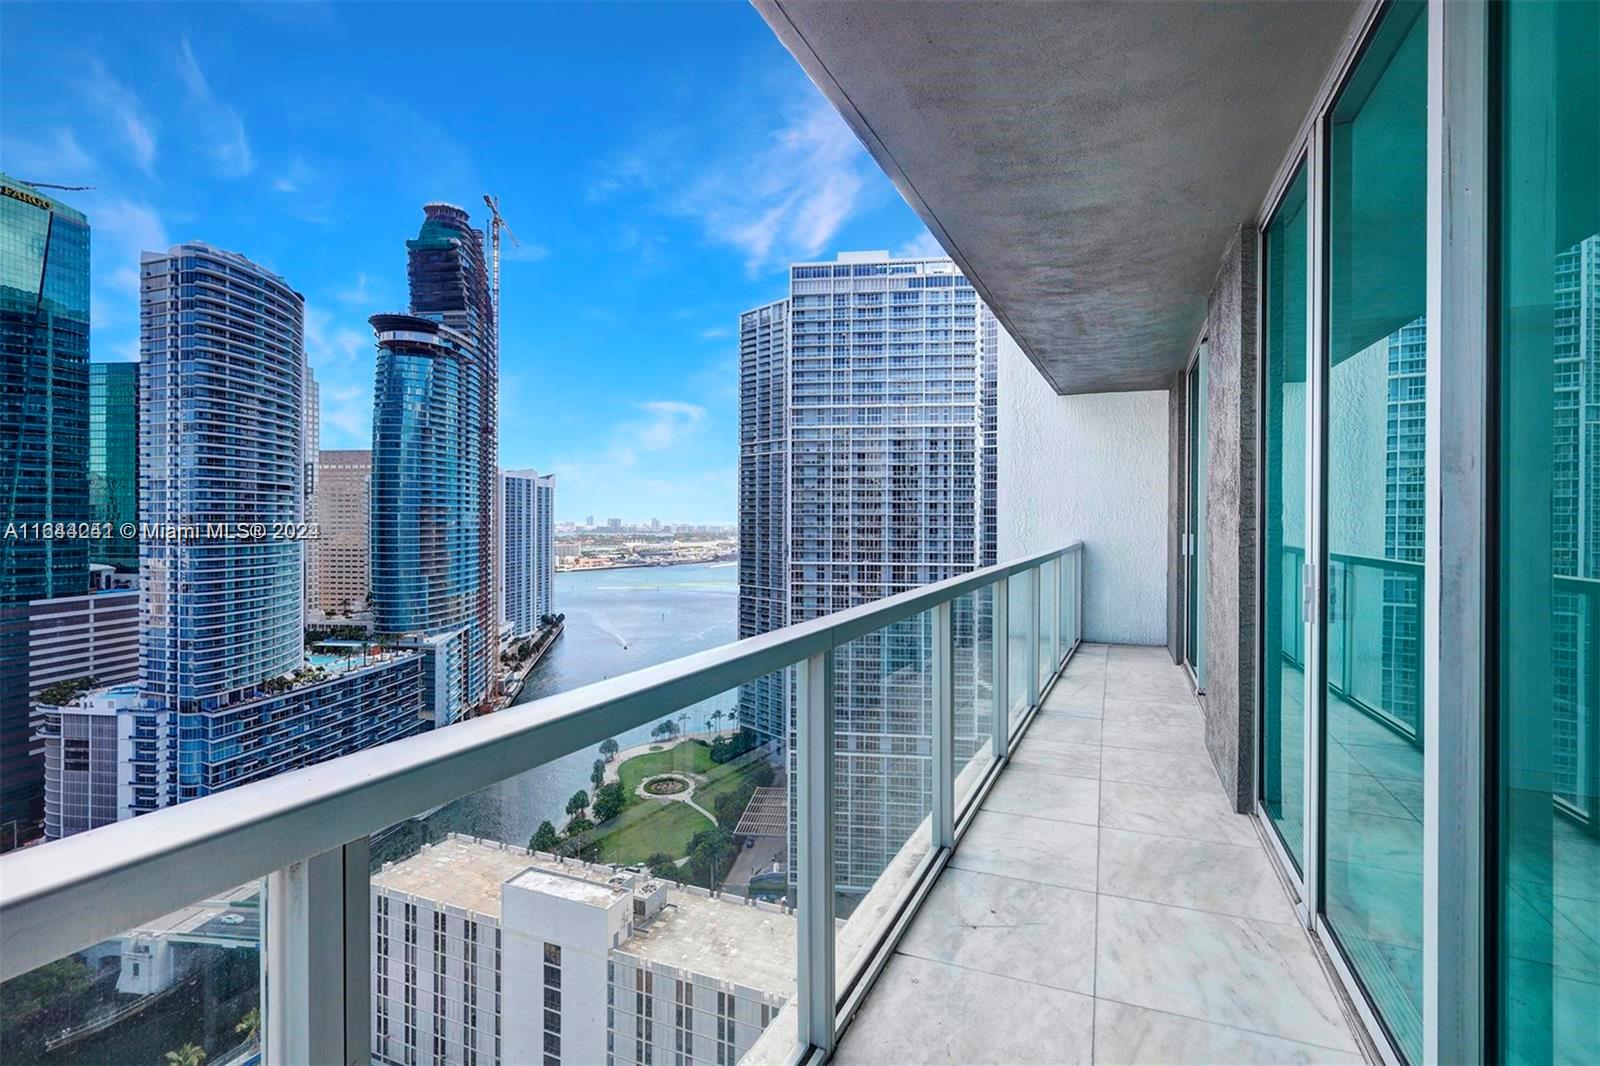
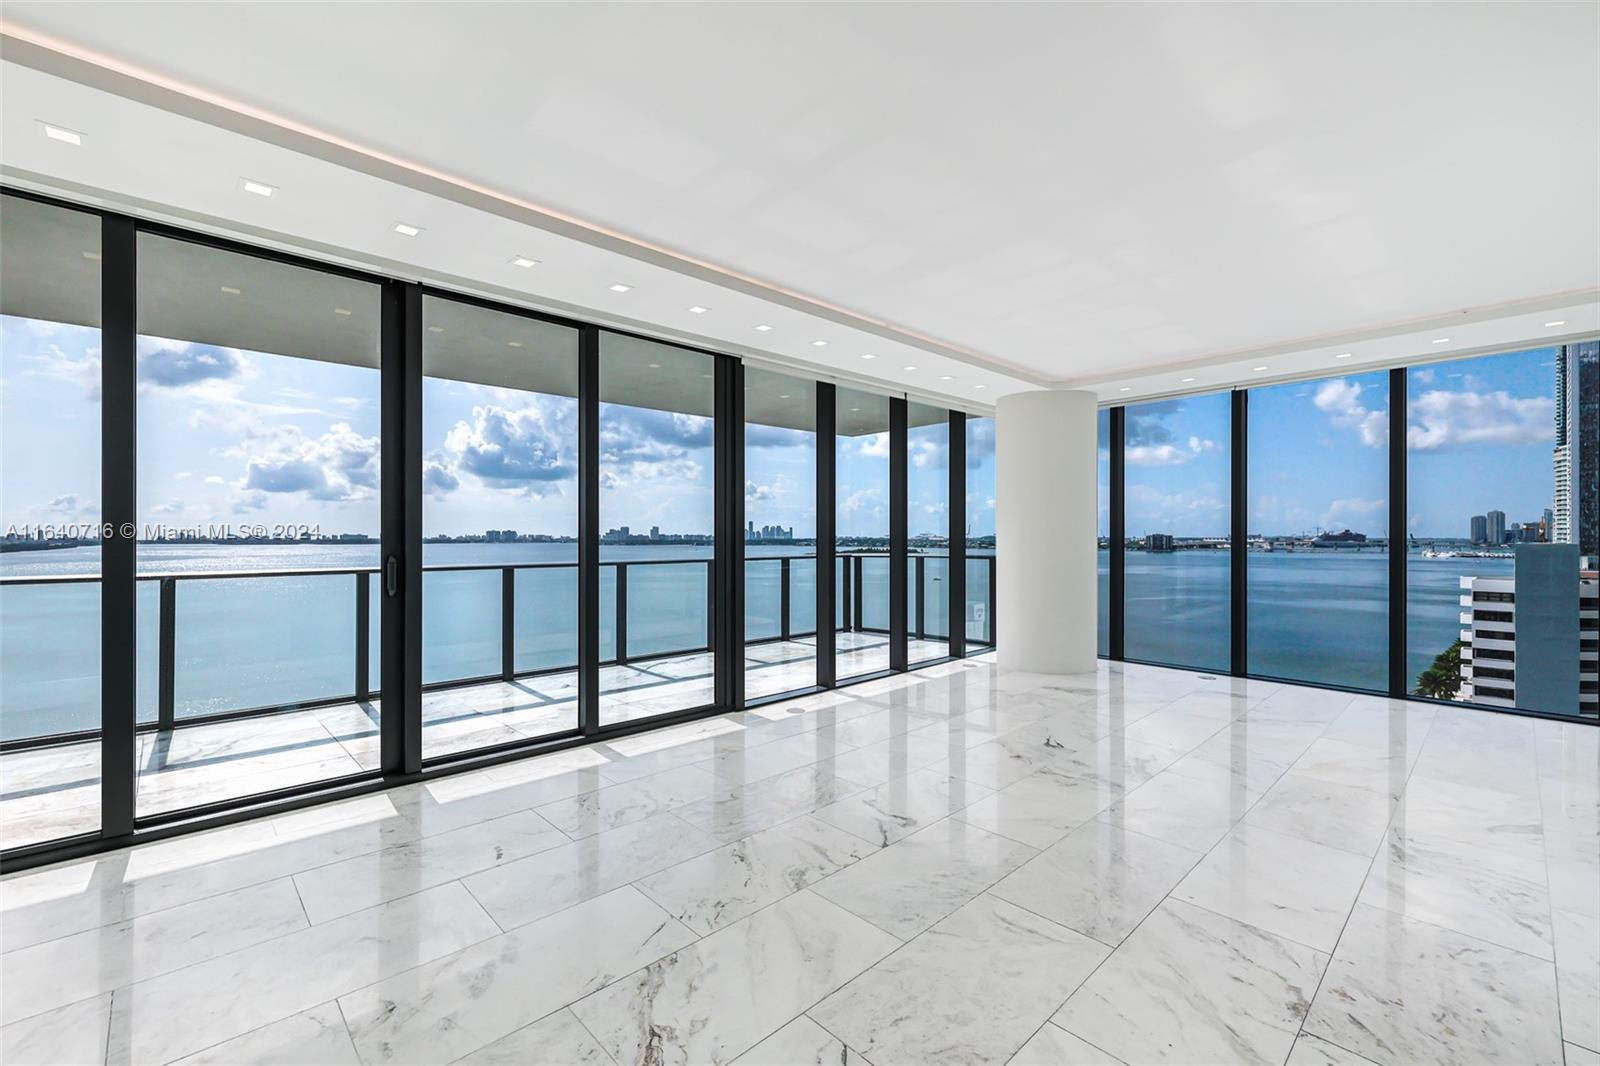
Active
$719,900
1
bds
|
2
ba
|
1,031
sqft
|
built
2008
900 Biscayne Blvd, Miami, FL 33132
$-3,307
Cash flow
-24.0%
Cash-on-Cash Return
0.8%
Cap rate
0.5%
Rent to Value Ratio
Active
$609,900
1
bds
|
2
ba
|
852
sqft
|
built
2017
45 SW 9th St, Miami, FL 33130
$-1,636
Cash flow
-14.0%
Cash-on-Cash Return
3.1%
Cap rate
0.7%
Rent to Value Ratio
Active
$1,600,000
4
bds
|
3
ba
|
1,332
sqft
|
built
1947
15 NW 52nd St, Miami, FL 33127
$-5,938
Cash flow
-19.4%
Cash-on-Cash Return
1.8%
Cap rate
0.4%
Rent to Value Ratio
Active
$649,000
2
bds
|
3
ba
|
1,610
sqft
|
built
2000
3370 NE 190th St, Miami, FL 33180
$-553
Cash flow
-4.4%
Cash-on-Cash Return
5.3%
Cap rate
0.8%
Rent to Value Ratio

Active
$1,765,000
2
bds
|
3
ba
|
1,730
sqft
|
built
2004
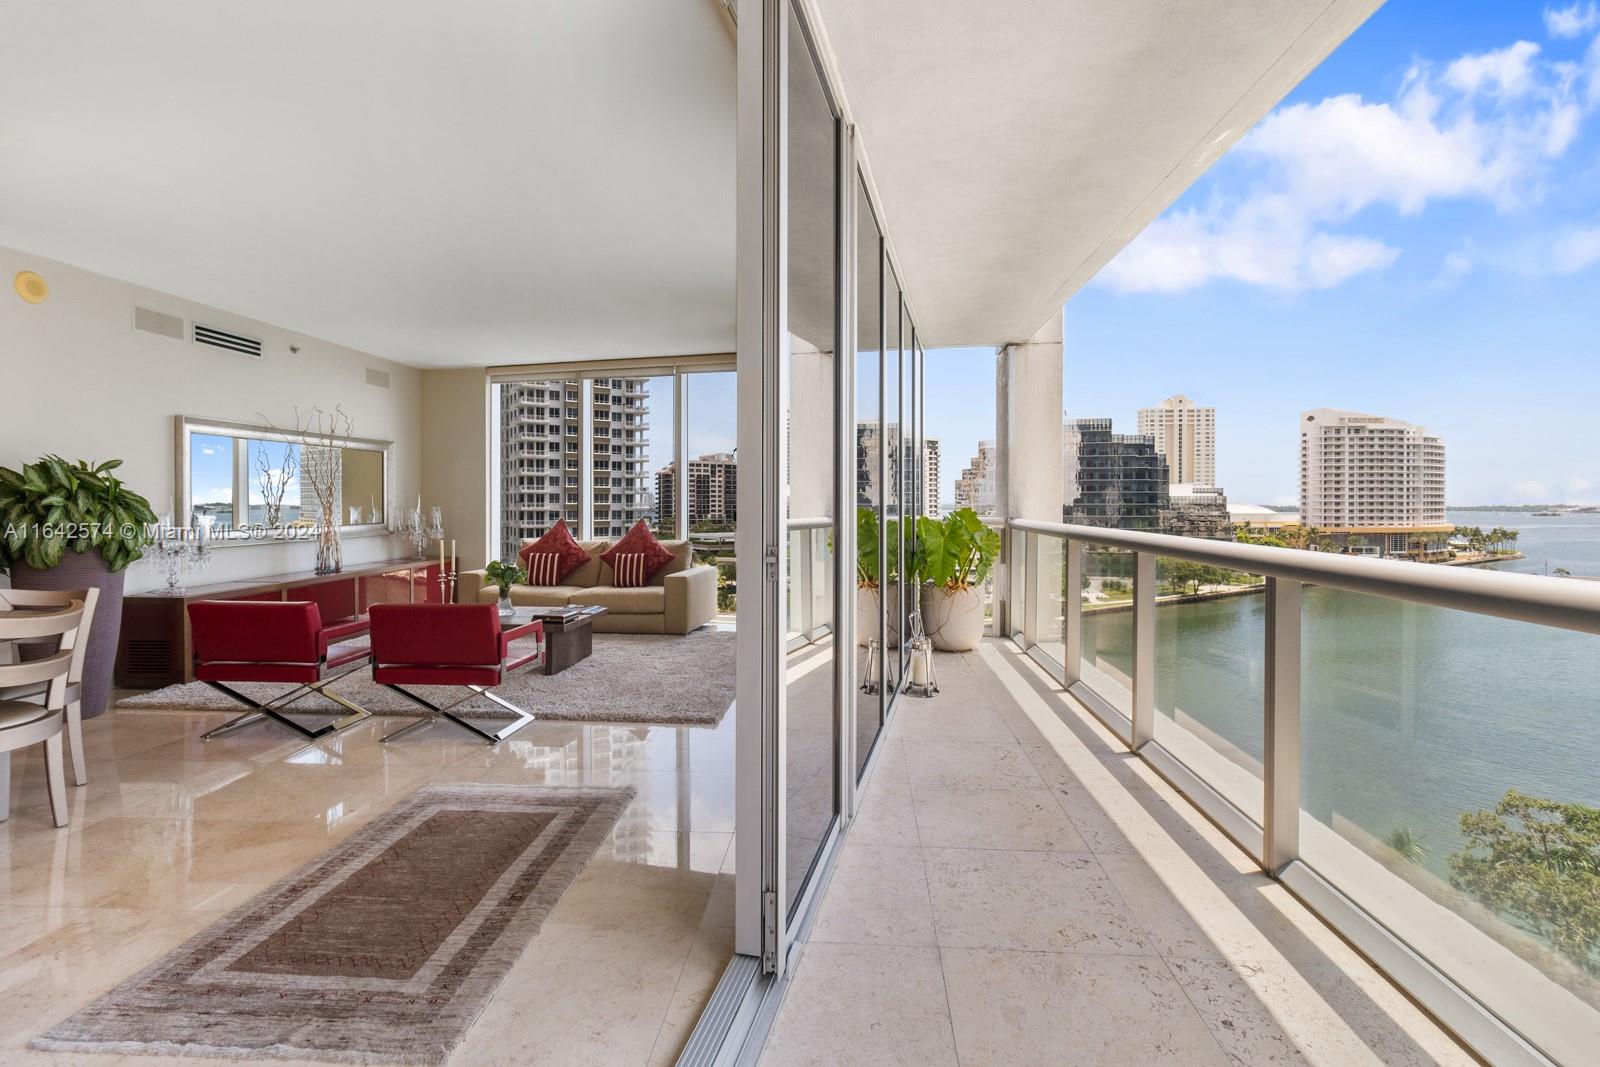
1331 Brickell Bay Dr, Miami, FL 33131
$-7,725
Cash flow
-22.8%
Cash-on-Cash Return
1.0%
Cap rate
0.5%
Rent to Value Ratio
Active
$1,100,000
2
bds
|
2
ba
|
1,286
sqft
|
built
2009
485 Brickell Ave, Miami, FL 33131
$-3,367
Cash flow
-16.0%
Cash-on-Cash Return
2.6%
Cap rate
0.7%
Rent to Value Ratio
Active
$1,050,000
2
bds
|
0
ba
|
2,011
sqft
|
built
1935
655 NE 80th St, Miami, FL 33138
$-5,683
Cash flow
-28.2%
Cash-on-Cash Return
-0.2%
Cap rate
0.2%
Rent to Value Ratio
Active
$699,000
2
bds
|
2
ba
|
1,123
sqft
|
built
2008
55 SE 6th St, Miami, FL 33131
$-3,144
Cash flow
-23.5%
Cash-on-Cash Return
0.9%
Cap rate
0.6%
Rent to Value Ratio
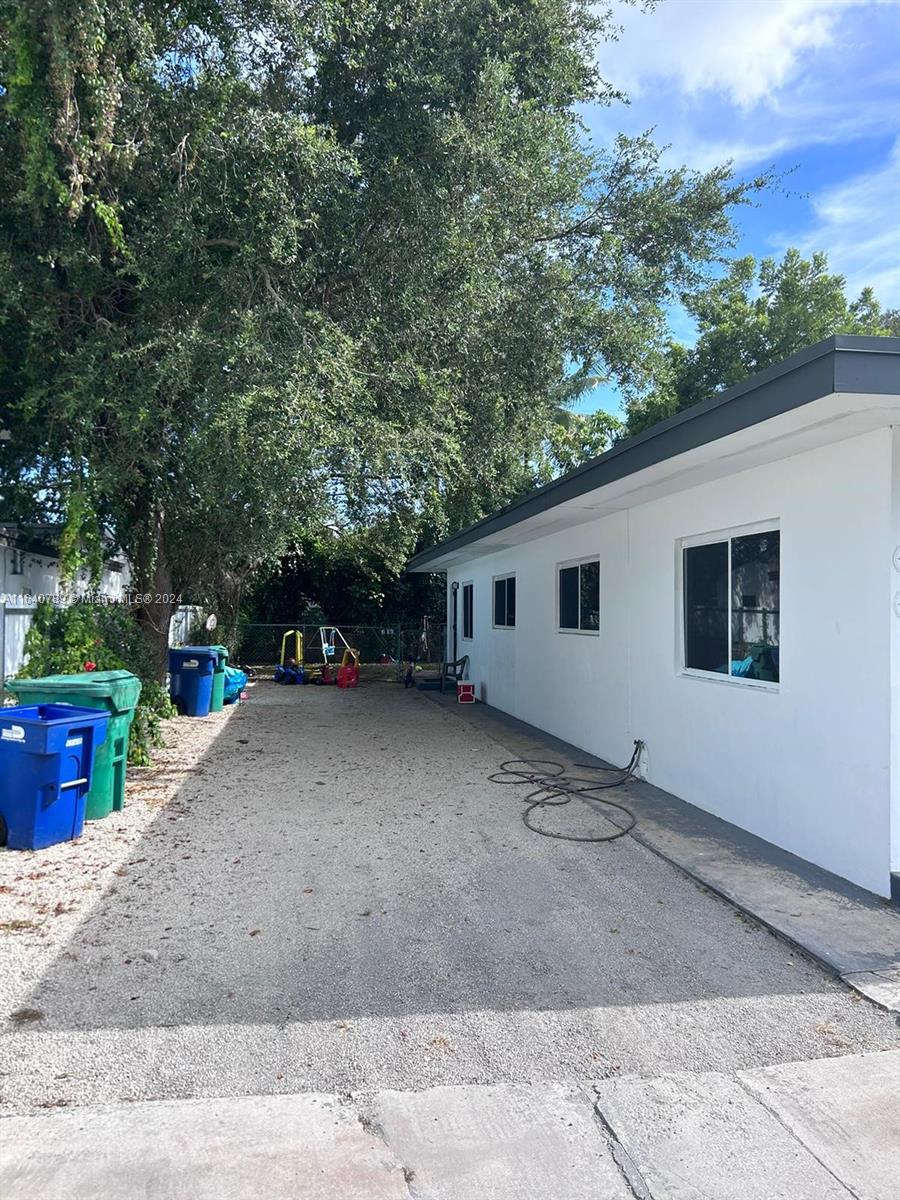
Active
$650,000
4
bds
|
0
ba
|
1,430
sqft
|
built
1942
1128 NW 76th St, Miami, FL 33150
$-2,371
Cash flow
-19.0%
Cash-on-Cash Return
1.9%
Cap rate
0.3%
Rent to Value Ratio
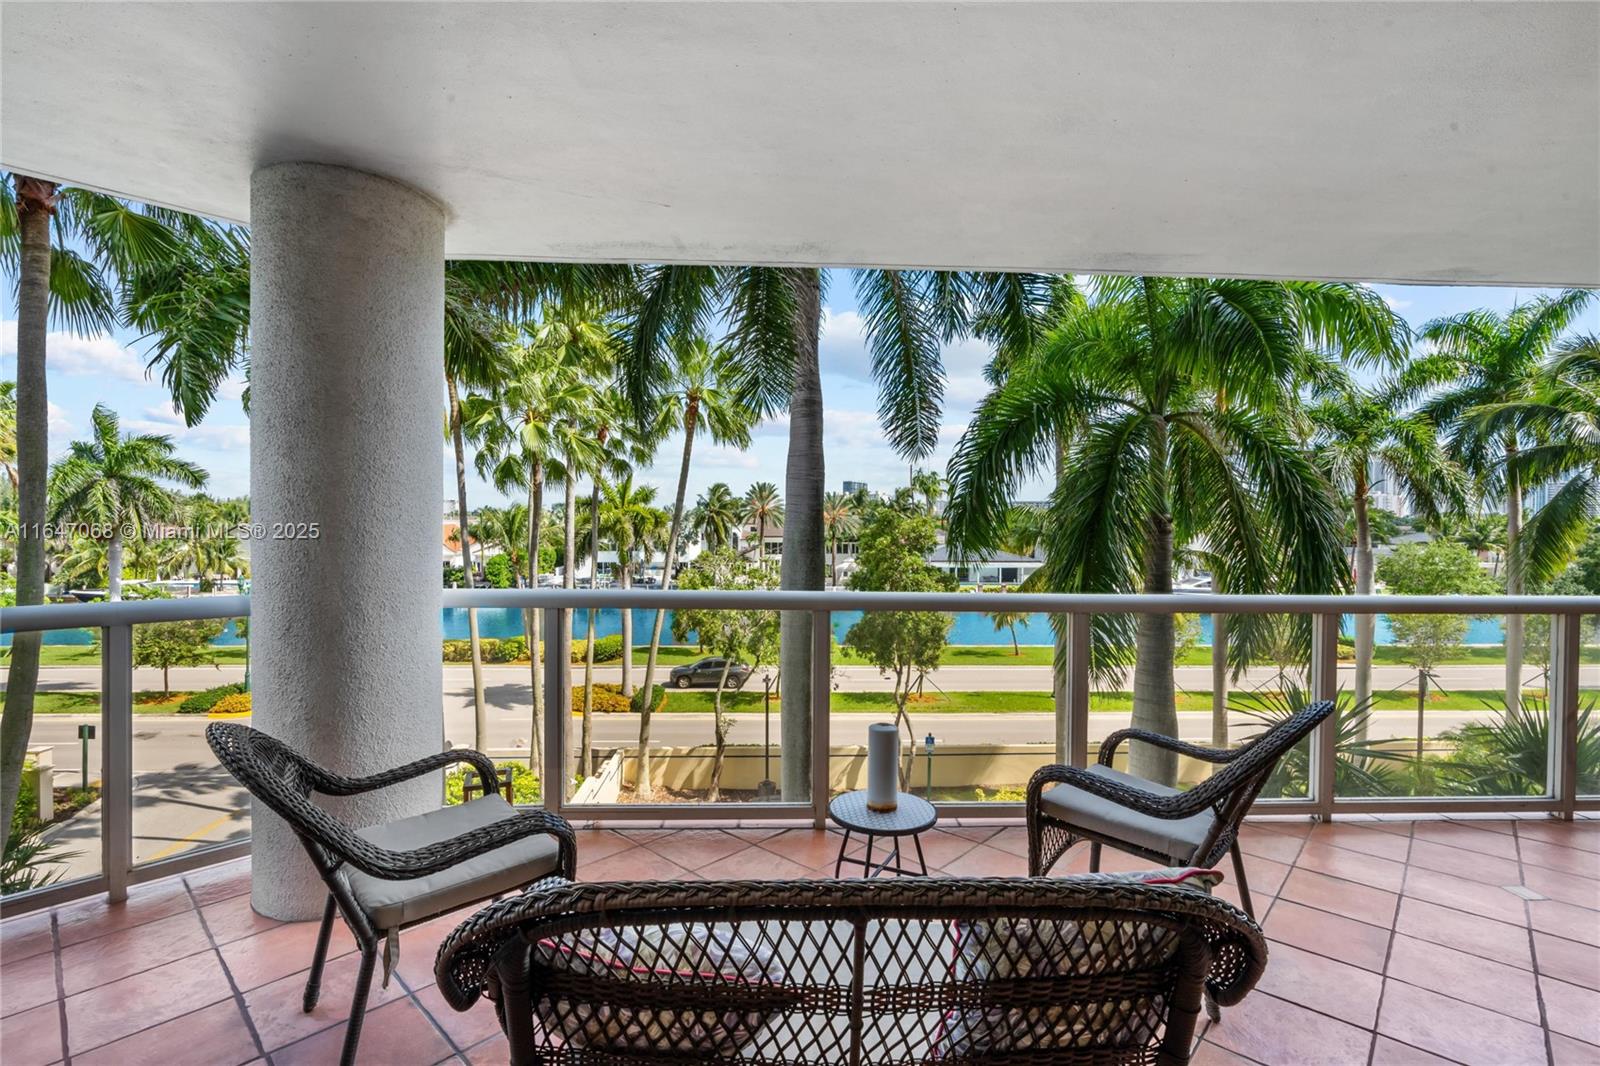
Active
$668,000
3
bds
|
2
ba
|
1,820
sqft
|
built
1993
3598 Yacht Club Dr, Miami, FL 33180
$-2,630
Cash flow
-20.5%
Cash-on-Cash Return
1.6%
Cap rate
0.7%
Rent to Value Ratio
Active
$1,449,999
3
bds
|
4
ba
|
2,165
sqft
|
built
2019
851 NE 1st Ave, Miami, FL 33132
$-7,475
Cash flow
-26.9%
Cash-on-Cash Return
0.1%
Cap rate
0.6%
Rent to Value Ratio
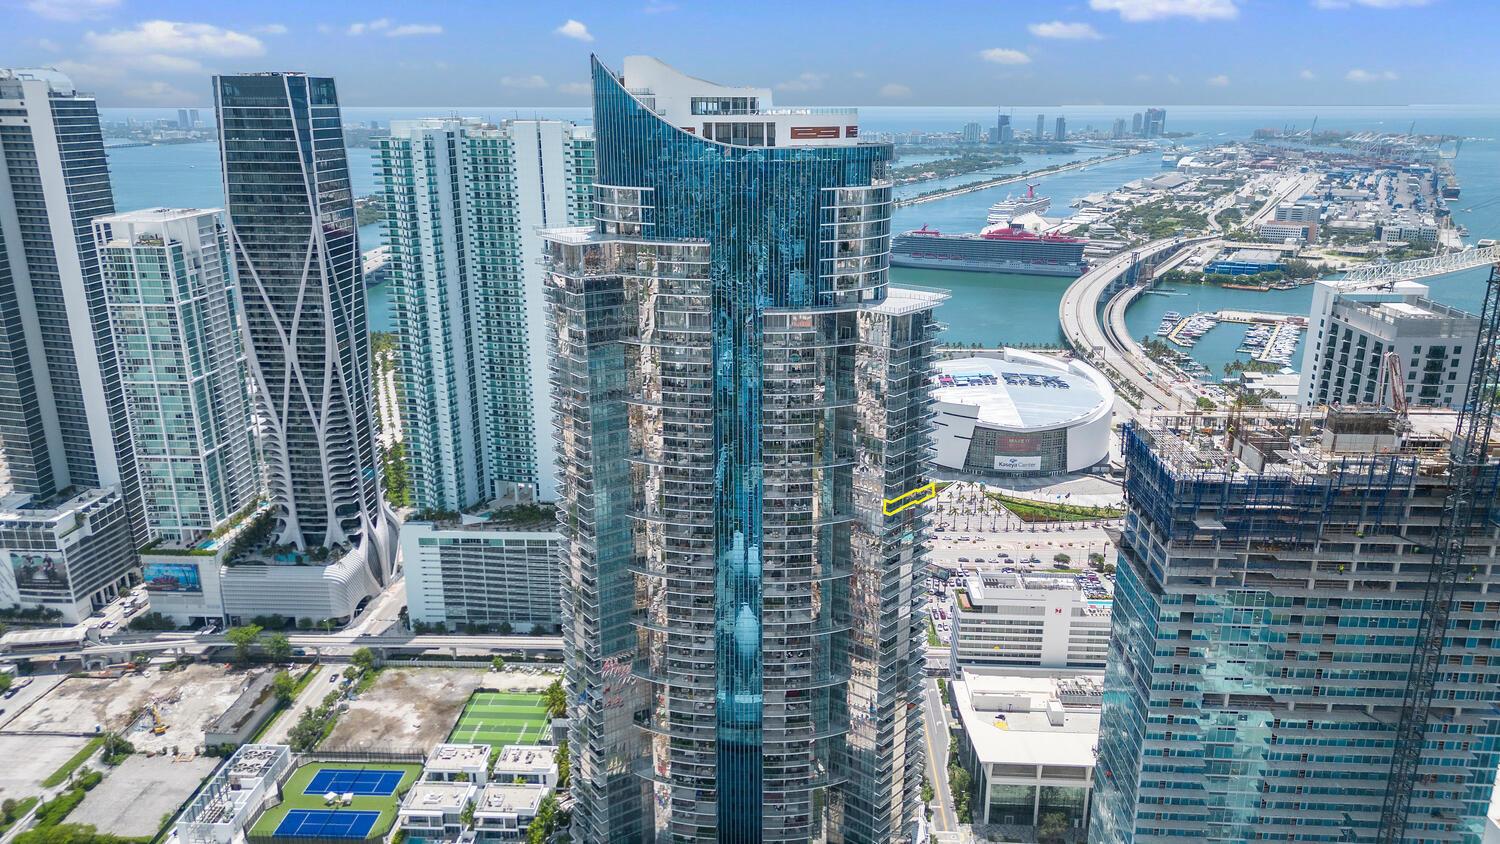
Active
$1,699,999
3
bds
|
2
ba
|
1,870
sqft
|
built
2009
495 Brickell Ave, Miami, FL 33131
$-6,433
Cash flow
-19.7%
Cash-on-Cash Return
1.7%
Cap rate
0.5%
Rent to Value Ratio
Active
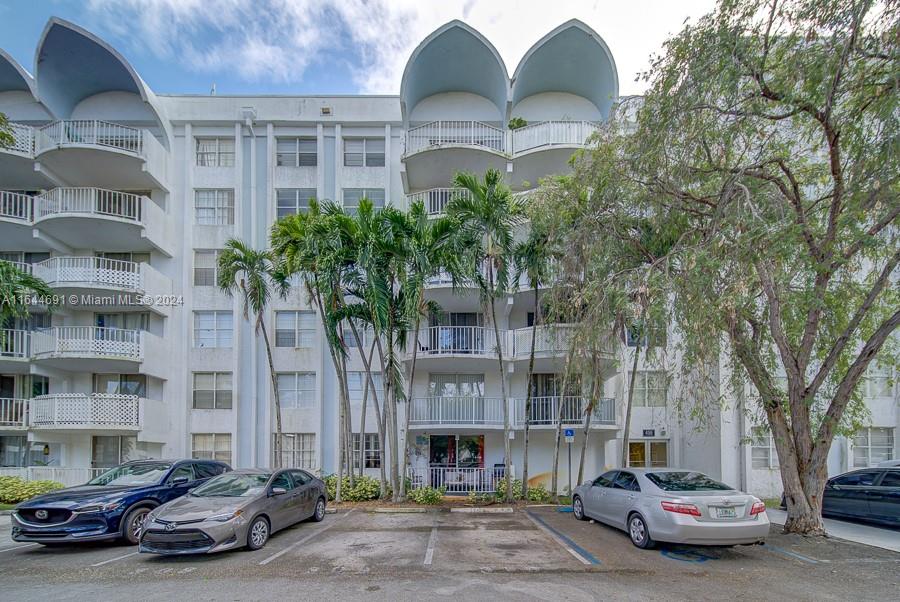
$209,000
2
bds
|
2
ba
|
1,175
sqft
|
built
1972
498 NW 165th Street Rd, Miami, FL 33169
$-668
Cash flow
-16.7%
Cash-on-Cash Return
2.4%
Cap rate
1.1%
Rent to Value Ratio
Active
$559,900
2
bds
|
2
ba
|
942
sqft
|
built
2006
170 SE 14th St, Miami, FL 33131
$-1,793
Cash flow
-16.7%
Cash-on-Cash Return
2.4%
Cap rate
0.6%
Rent to Value Ratio
Active
$465,000
3
bds
|
3
ba
|
1,693
sqft
|
built
1973
19420 NE 26th Ave, Miami, FL 33180
$-1,702
Cash flow
-19.1%
Cash-on-Cash Return
1.9%
Cap rate
0.7%
Rent to Value Ratio
Active
$900,000
1
bds
|
2
ba
|
938
sqft
|
built
2008
900 Biscayne Blvd, Miami, FL 33132
$-2,528
Cash flow
-14.7%
Cash-on-Cash Return
2.9%
Cap rate
0.6%
Rent to Value Ratio
Active
$700,000
3
bds
|
2
ba
|
1,619
sqft
|
built
1978
6751 SW 13th Ter, Miami, FL 33144
$-1,127
Cash flow
-8.4%
Cash-on-Cash Return
4.4%
Cap rate
0.6%
Rent to Value Ratio

Active
$350,000
1
bds
|
1
ba
|
640
sqft
|
built
1998
185 SE 14th Ter, Miami, FL 33131
$-1,221
Cash flow
-18.2%
Cash-on-Cash Return
2.1%
Cap rate
0.8%
Rent to Value Ratio
Active
$220,000
1
bds
|
1
ba
|
635
sqft
|
built
1968
7304 SW 82nd St, Miami, FL 33143
$-545
Cash flow
-12.9%
Cash-on-Cash Return
3.3%
Cap rate
0.8%
Rent to Value Ratio
Active
$639,000
2
bds
|
2
ba
|
1,170
sqft
|
built
2001
2475 Brickell Ave, Miami, FL 33129
$-2,831
Cash flow
-23.1%
Cash-on-Cash Return
1.0%
Cap rate
0.6%
Rent to Value Ratio
Active
$780,000
1
bds
|
2
ba
|
997
sqft
|
built
2016
88 SW 7th St, Miami, FL 33130
$-2,887
Cash flow
-19.3%
Cash-on-Cash Return
1.8%
Cap rate
0.7%
Rent to Value Ratio
Active
$849,000
1
bds
|
2
ba
|
997
sqft
|
built
2016
88 SW 7th St, Miami, FL 33130
$-3,440
Cash flow
-21.1%
Cash-on-Cash Return
1.4%
Cap rate
0.6%
Rent to Value Ratio
Active
$1,570,000
5
bds
|
4
ba
|
3,645
sqft
|
built
1954
7100 Miller Dr, Miami, FL 33155
$-2,587
Cash flow
-8.6%
Cash-on-Cash Return
4.3%
Cap rate
0.6%
Rent to Value Ratio
Active
$1,000,000
5
bds
|
4
ba
|
3,153
sqft
|
built
2004
6049 SW 165th Ave, Miami, FL 33193
$-4,761
Cash flow
-24.8%
Cash-on-Cash Return
0.6%
Cap rate
0.2%
Rent to Value Ratio
Active
$349,000
2
bds
|
1
ba
|
752
sqft
|
built
1970
444 SW 4th St, Miami, FL 33130
$-473
Cash flow
-7.1%
Cash-on-Cash Return
4.7%
Cap rate
0.8%
Rent to Value Ratio
Active
$225,000
2
bds
|
2
ba
|
1,353
sqft
|
built
1972
11111 Biscayne Blvd, Miami, FL 33181
$-1,061
Cash flow
-24.6%
Cash-on-Cash Return
0.6%
Cap rate
1.2%
Rent to Value Ratio
Active
$429,000
2
bds
|
1
ba
|
736
sqft
|
built
2016
151 SE 1st St, Miami, FL 33131
$-1,611
Cash flow
-19.6%
Cash-on-Cash Return
1.8%
Cap rate
0.7%
Rent to Value Ratio
Active
$1,899,000
3
bds
|
4
ba
|
1,634
sqft
|
built
2018
3131 NE 7th Ave, Miami, FL 33137
$-6,393
Cash flow
-17.6%
Cash-on-Cash Return
2.2%
Cap rate
0.6%
Rent to Value Ratio
Active
$380,000
3
bds
|
3
ba
|
1,214
sqft
|
built
1988
13037 SW 88th Ln, Miami, FL 33186
$-813
Cash flow
-11.2%
Cash-on-Cash Return
3.7%
Cap rate
0.7%
Rent to Value Ratio
Active
$349,000
2
bds
|
1
ba
|
1,080
sqft
|
built
1943
1851 NW 48th St, Miami, FL 33142
$-180
Cash flow
-2.7%
Cash-on-Cash Return
5.7%
Cap rate
0.7%
Rent to Value Ratio
Active
$525,000
2
bds
|
2
ba
|
1,018
sqft
|
built
2018
1600 NE 1st Ave, Miami, FL 33132
$-1,749
Cash flow
-17.4%
Cash-on-Cash Return
2.3%
Cap rate
0.7%
Rent to Value Ratio
Active
$975,000
2
bds
|
3
ba
|
1,198
sqft
|
built
2018
650 NE 32nd St, Miami, FL 33137
$-4,170
Cash flow
-22.3%
Cash-on-Cash Return
1.2%
Cap rate
0.5%
Rent to Value Ratio

Active
$220,000
1
bds
|
1
ba
|
796
sqft
|
built
1984
8215 SW 152nd Ave, Miami, FL 33193
$-544
Cash flow
-12.9%
Cash-on-Cash Return
3.3%
Cap rate
0.8%
Rent to Value Ratio