Miami, FL Investment Properties for Sale
Browse homes for sale and investment properties in Miami, FL. Refine your search by price, property type, or more.
Best cash flowing properties in Miami, FL
Active
$349,000
2
bds
|
1
ba
|
1,080
sqft
|
built
1943
1851 NW 48th St, Miami, FL 33142
$-180
Cash flow
-2.7%
Cash-on-Cash Return
5.7%
Cap rate
0.7%
Rent to Value Ratio
Active
$304,900
2
bds
|
2
ba
|
1,131
sqft
|
built
1975
9150 Fontainebleau Blvd, Miami, FL 33172
$-282
Cash flow
-4.8%
Cash-on-Cash Return
5.2%
Cap rate
0.8%
Rent to Value Ratio
6,178 out of 7,014 properties for sale in Miami, FL
Limited Results Shown
Create a free account, or log in to reveal all property listings and enjoy the complete experience.
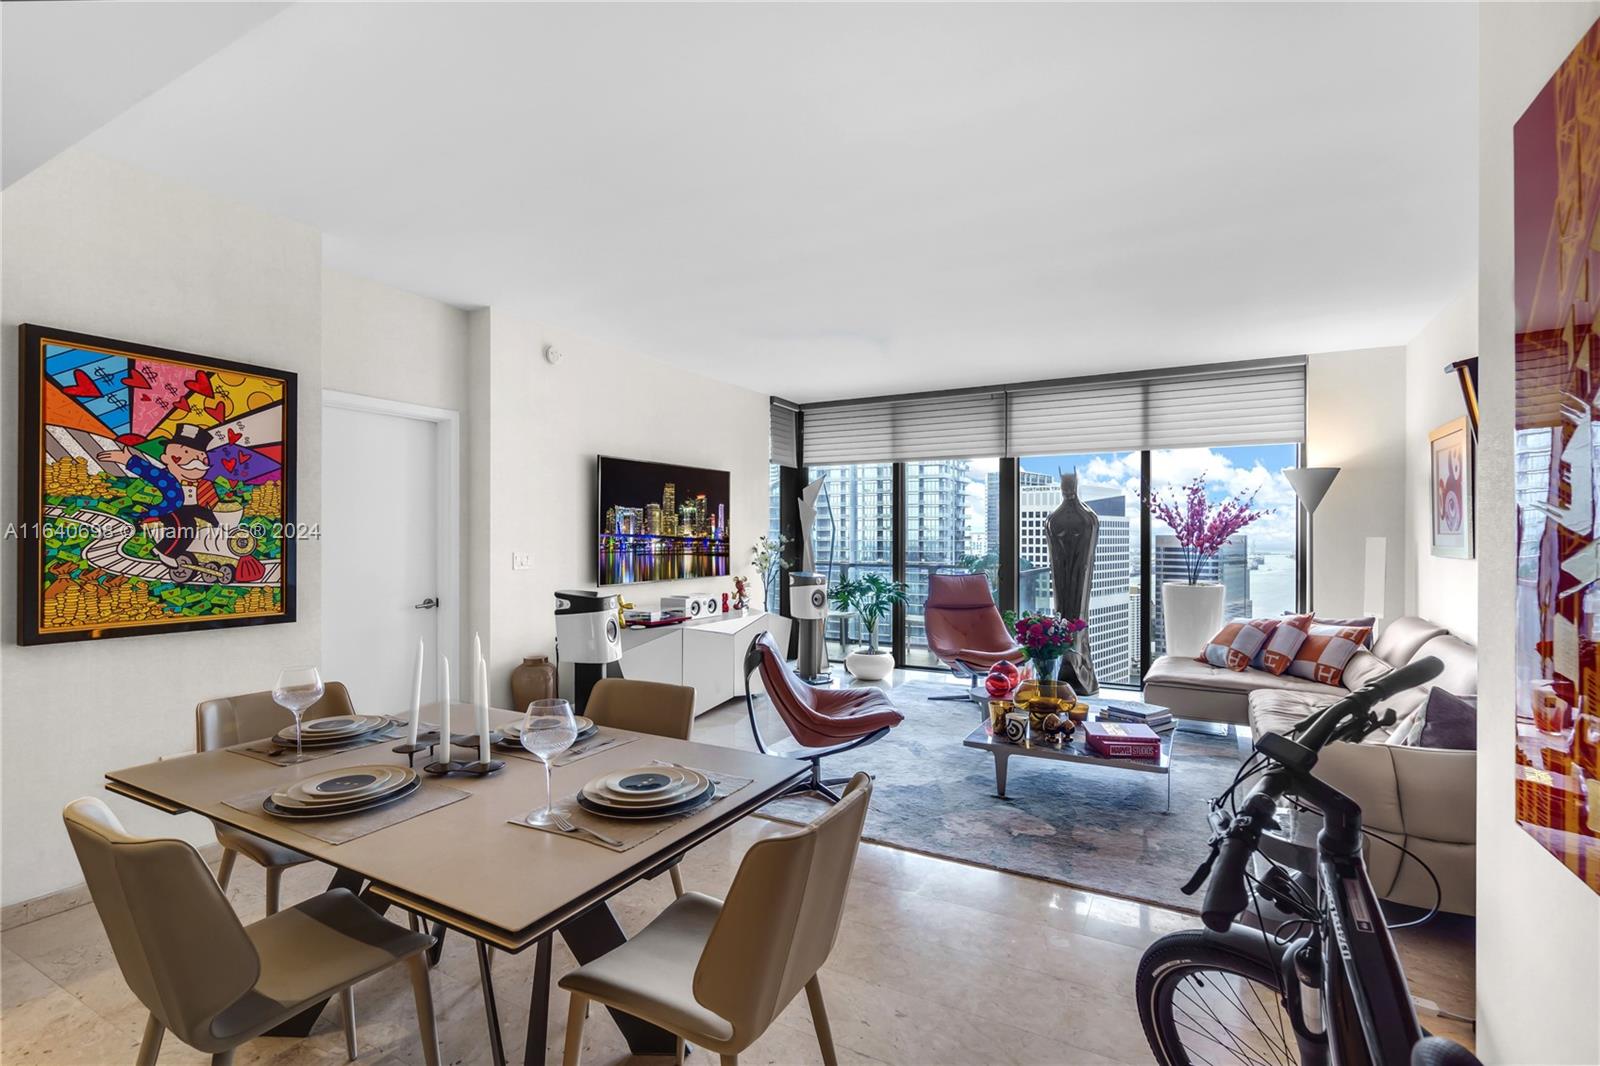
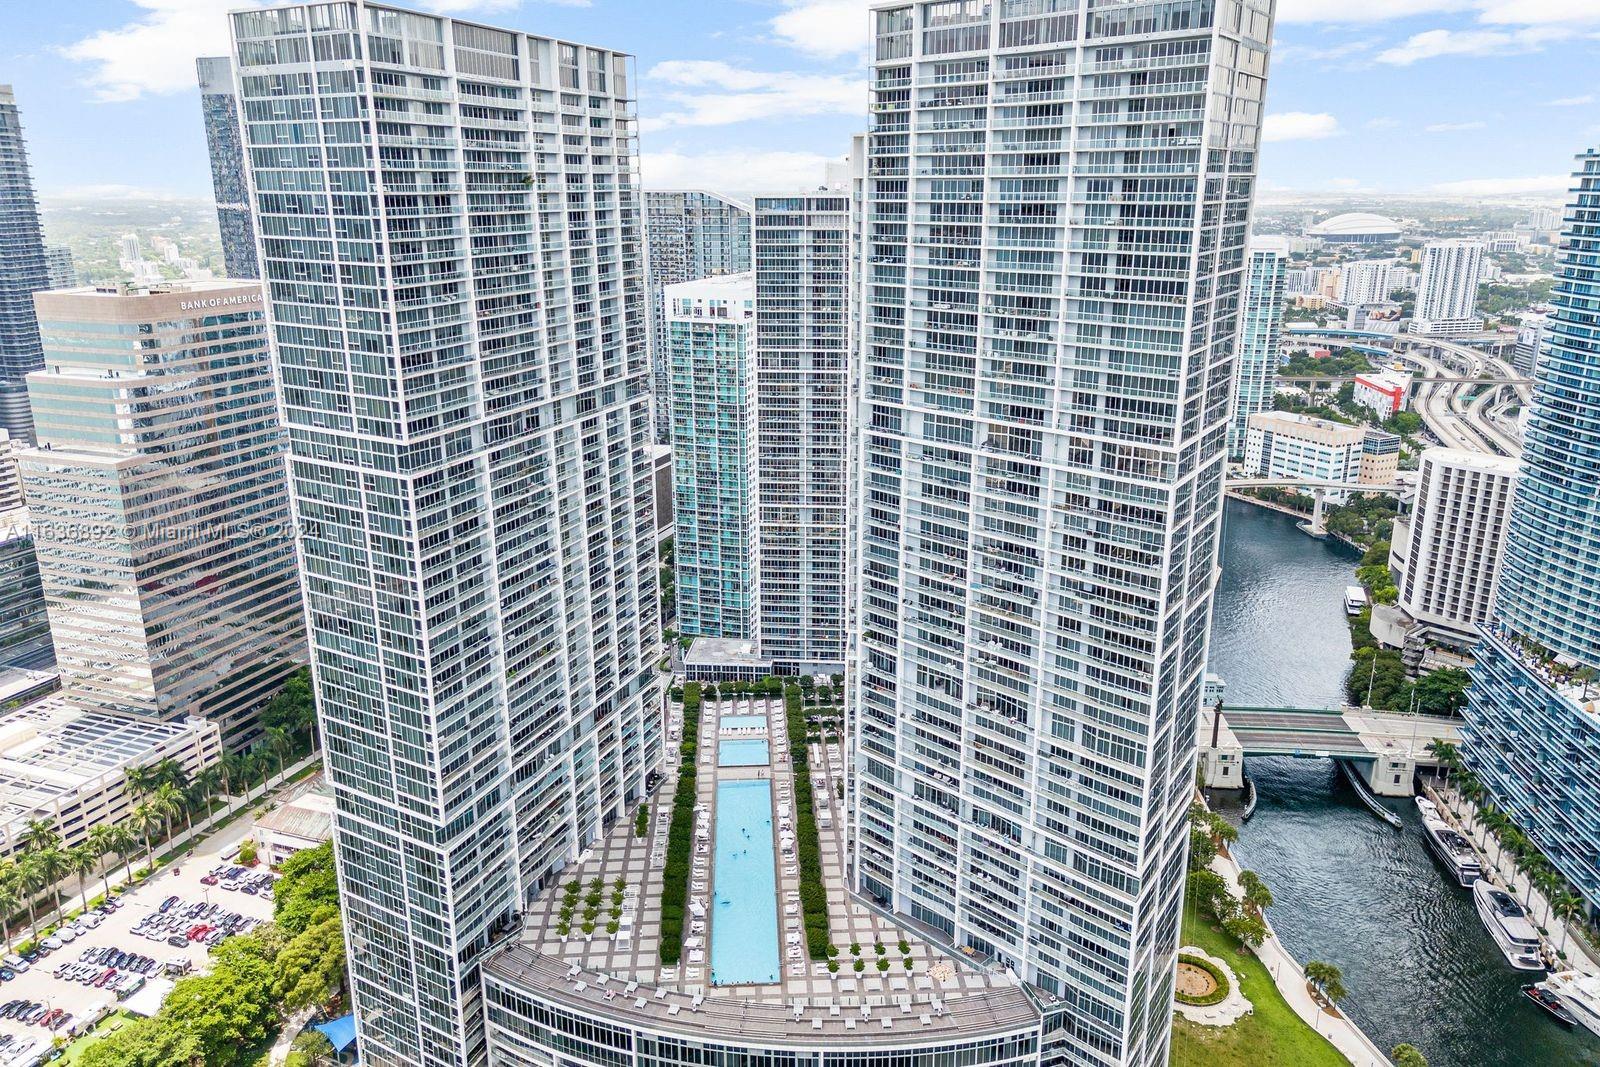
Active
$639,000
2
bds
|
2
ba
|
1,170
sqft
|
built
2001
2475 Brickell Ave, Miami, FL 33129
$-2,831
Cash flow
-23.1%
Cash-on-Cash Return
1.0%
Cap rate
0.6%
Rent to Value Ratio
Active
$220,000
1
bds
|
1
ba
|
635
sqft
|
built
1968
7304 SW 82nd St, Miami, FL 33143
$-545
Cash flow
-12.9%
Cash-on-Cash Return
3.3%
Cap rate
0.8%
Rent to Value Ratio
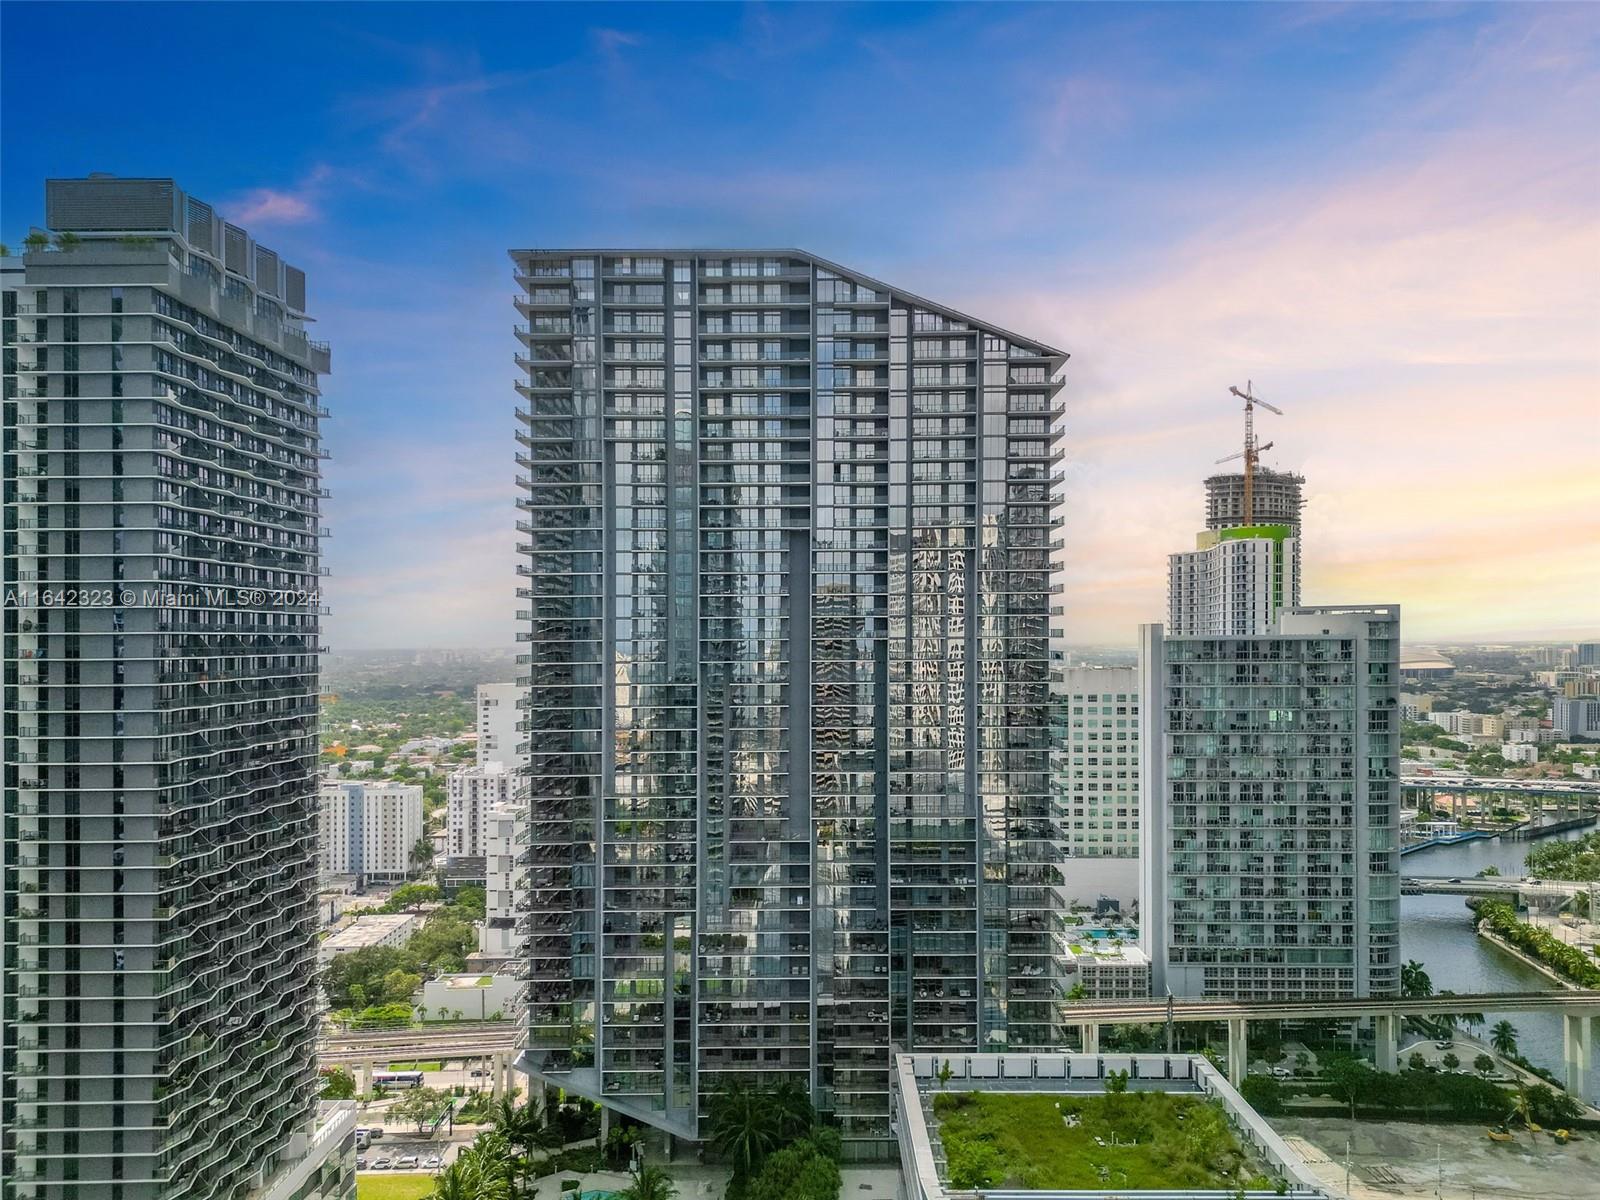
Active
$780,000
1
bds
|
2
ba
|
997
sqft
|
built
2016
88 SW 7th St, Miami, FL 33130
$-2,887
Cash flow
-19.3%
Cash-on-Cash Return
1.8%
Cap rate
0.7%
Rent to Value Ratio
Active
$849,000
1
bds
|
2
ba
|
997
sqft
|
built
2016
88 SW 7th St, Miami, FL 33130
$-3,440
Cash flow
-21.1%
Cash-on-Cash Return
1.4%
Cap rate
0.6%
Rent to Value Ratio
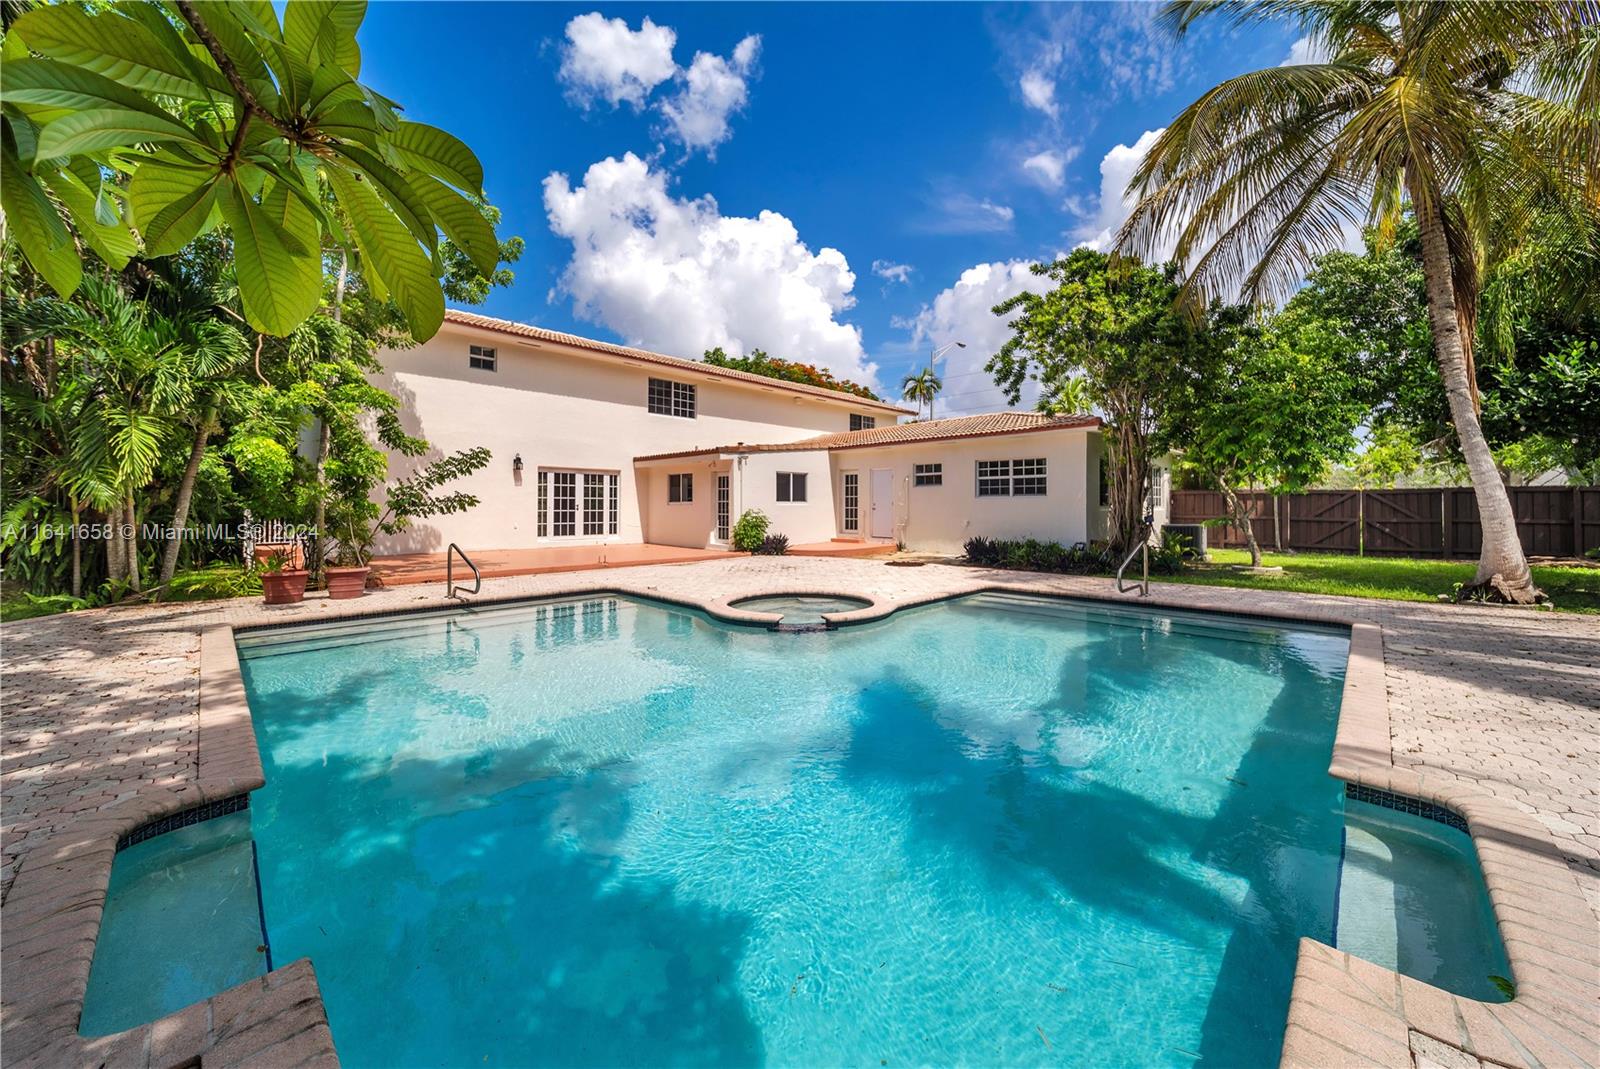
Active
$1,570,000
5
bds
|
4
ba
|
3,645
sqft
|
built
1954
7100 Miller Dr, Miami, FL 33155
$-2,587
Cash flow
-8.6%
Cash-on-Cash Return
4.3%
Cap rate
0.6%
Rent to Value Ratio
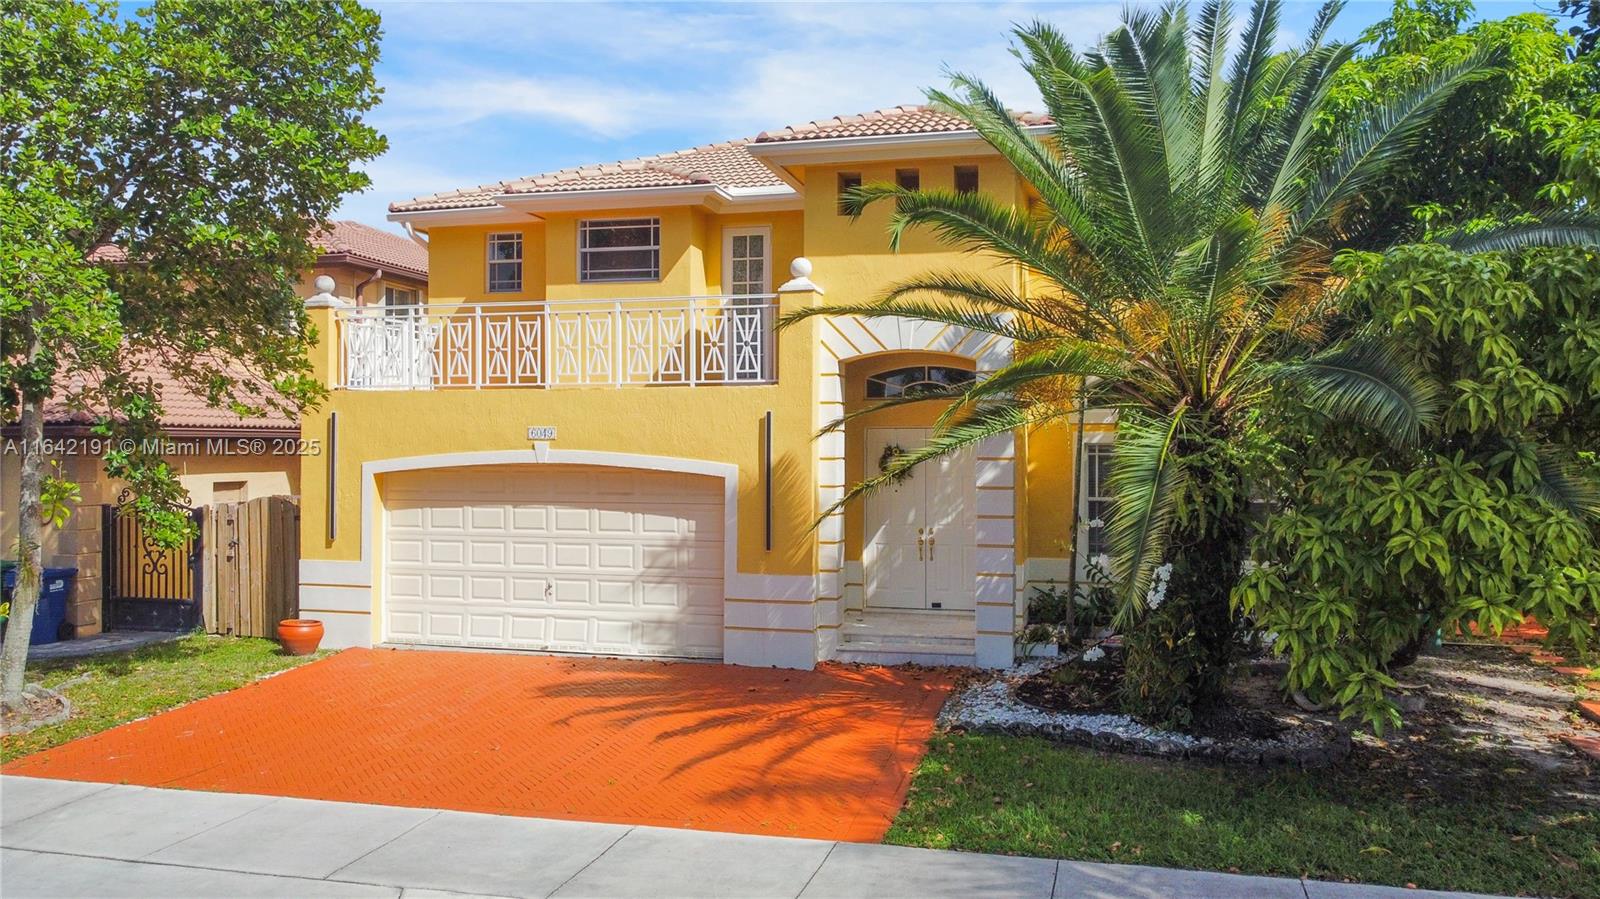
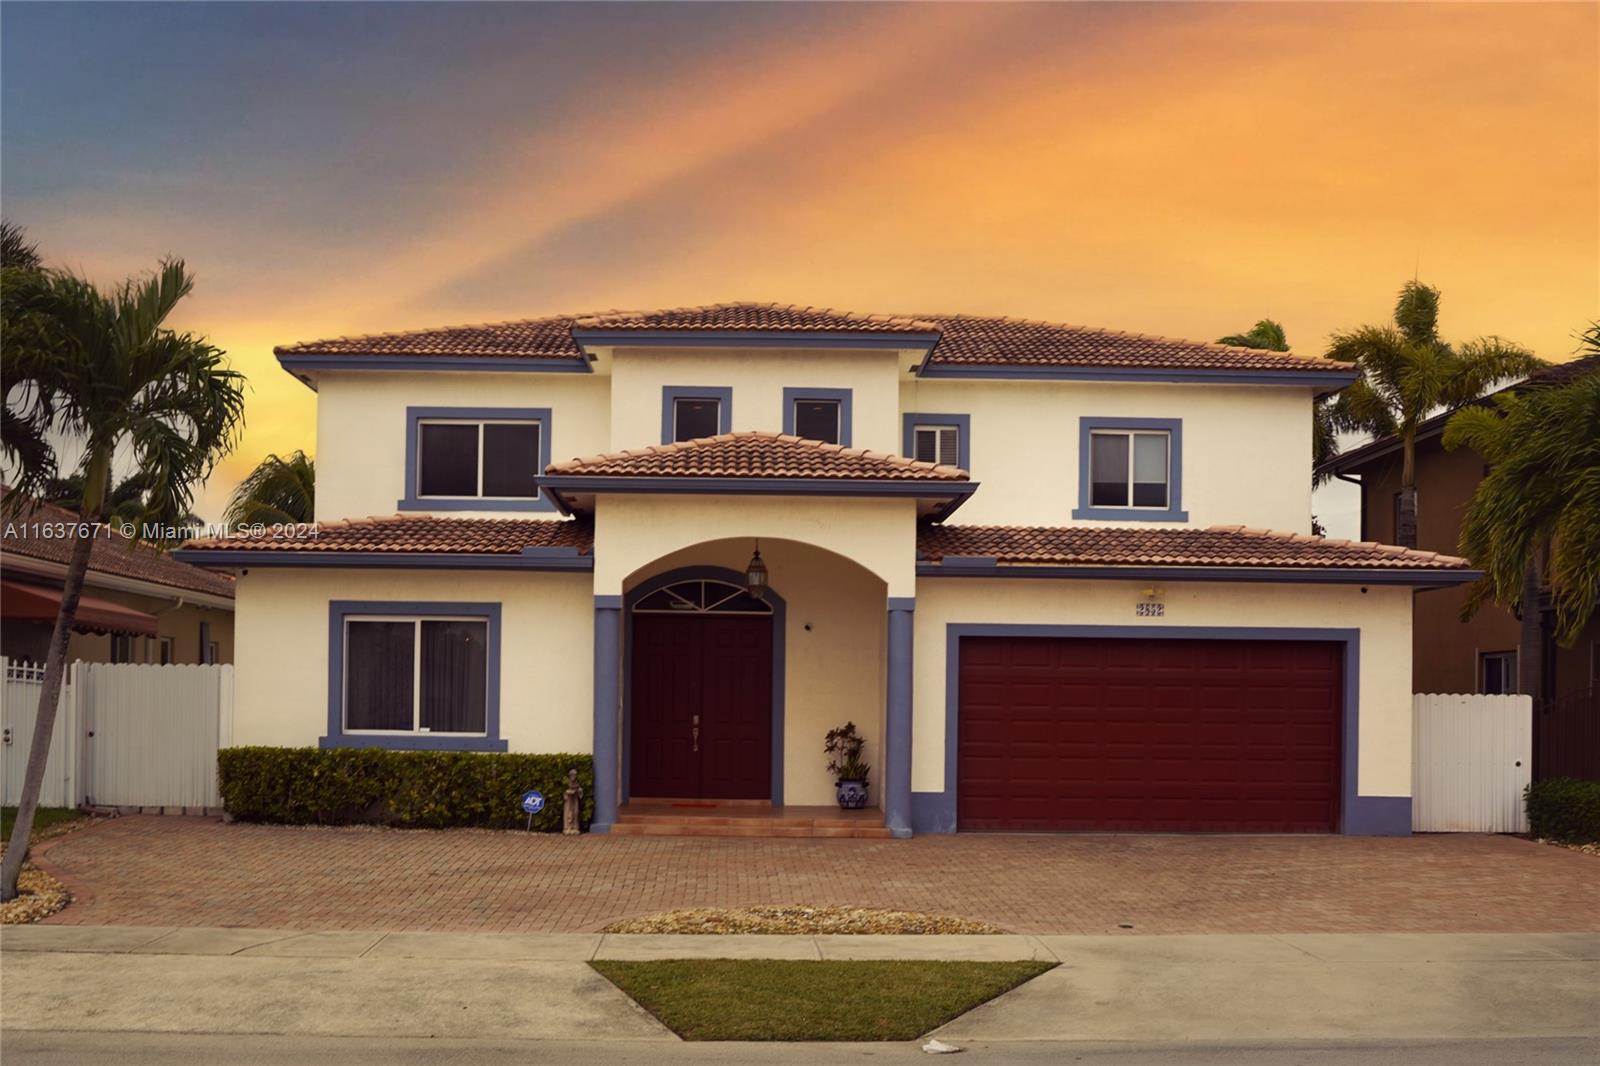
Active
$1,000,000
5
bds
|
4
ba
|
3,153
sqft
|
built
2004
6049 SW 165th Ave, Miami, FL 33193
$-4,761
Cash flow
-24.8%
Cash-on-Cash Return
0.6%
Cap rate
0.2%
Rent to Value Ratio
Active
$349,000
2
bds
|
1
ba
|
752
sqft
|
built
1970
444 SW 4th St, Miami, FL 33130
$-473
Cash flow
-7.1%
Cash-on-Cash Return
4.7%
Cap rate
0.8%
Rent to Value Ratio
Active
$225,000
2
bds
|
2
ba
|
1,353
sqft
|
built
1972
11111 Biscayne Blvd, Miami, FL 33181
$-1,061
Cash flow
-24.6%
Cash-on-Cash Return
0.6%
Cap rate
1.2%
Rent to Value Ratio
Active
$429,000
2
bds
|
1
ba
|
736
sqft
|
built
2016
151 SE 1st St, Miami, FL 33131
$-1,611
Cash flow
-19.6%
Cash-on-Cash Return
1.8%
Cap rate
0.7%
Rent to Value Ratio
Active
$1,899,000
3
bds
|
4
ba
|
1,634
sqft
|
built
2018
3131 NE 7th Ave, Miami, FL 33137
$-6,393
Cash flow
-17.6%
Cash-on-Cash Return
2.2%
Cap rate
0.6%
Rent to Value Ratio
Active
$380,000
3
bds
|
3
ba
|
1,214
sqft
|
built
1988
13037 SW 88th Ln, Miami, FL 33186
$-813
Cash flow
-11.2%
Cash-on-Cash Return
3.7%
Cap rate
0.7%
Rent to Value Ratio
Active
$349,000
2
bds
|
1
ba
|
1,080
sqft
|
built
1943
1851 NW 48th St, Miami, FL 33142
$-180
Cash flow
-2.7%
Cash-on-Cash Return
5.7%
Cap rate
0.7%
Rent to Value Ratio
Active
$525,000
2
bds
|
2
ba
|
1,018
sqft
|
built
2018
1600 NE 1st Ave, Miami, FL 33132
$-1,749
Cash flow
-17.4%
Cash-on-Cash Return
2.3%
Cap rate
0.7%
Rent to Value Ratio
Active
$975,000
2
bds
|
3
ba
|
1,198
sqft
|
built
2018
650 NE 32nd St, Miami, FL 33137
$-4,170
Cash flow
-22.3%
Cash-on-Cash Return
1.2%
Cap rate
0.5%
Rent to Value Ratio

Active
$220,000
1
bds
|
1
ba
|
796
sqft
|
built
1984
8215 SW 152nd Ave, Miami, FL 33193
$-544
Cash flow
-12.9%
Cash-on-Cash Return
3.3%
Cap rate
0.8%
Rent to Value Ratio
Active
$600,000
2
bds
|
2
ba
|
1,218
sqft
|
built
1973
600 NE 36th St, Miami, FL 33137
$-1,685
Cash flow
-14.7%
Cash-on-Cash Return
2.9%
Cap rate
0.6%
Rent to Value Ratio

Active
$949,999
4
bds
|
4
ba
|
2,216
sqft
|
built
1989
4260 SW 149th Ct, Miami, FL 33185
$-1,413
Cash flow
-7.8%
Cash-on-Cash Return
4.5%
Cap rate
0.7%
Rent to Value Ratio
Active
$1,800,000
5
bds
|
4
ba
|
3,224
sqft
|
built
1956
16255 SW 216th St, Miami, FL 33170
$-5,840
Cash flow
-16.9%
Cash-on-Cash Return
2.4%
Cap rate
0.4%
Rent to Value Ratio

Active
$1,150,000
5
bds
|
3
ba
|
3,260
sqft
|
built
1976
22455 SW 182nd Ave, Miami, FL 33170
$-3,507
Cash flow
-15.9%
Cash-on-Cash Return
2.6%
Cap rate
0.5%
Rent to Value Ratio
Active
$1,249,999
5
bds
|
4
ba
|
3,319
sqft
|
built
2007
12969 SW 220th Ter, Miami, FL 33170
$-2,712
Cash flow
-11.3%
Cash-on-Cash Return
3.7%
Cap rate
0.5%
Rent to Value Ratio
Active
$299,000
2
bds
|
2
ba
|
970
sqft
|
built
1969
1251 NE 108th St, Miami, FL 33161
$-784
Cash flow
-13.7%
Cash-on-Cash Return
3.1%
Cap rate
0.8%
Rent to Value Ratio
Active
$240,000
2
bds
|
2
ba
|
829
sqft
|
built
1990
468 NE 206th Ln, Miami, FL 33179
$-334
Cash flow
-7.3%
Cash-on-Cash Return
4.6%
Cap rate
1.0%
Rent to Value Ratio

Active
$440,000
2
bds
|
2
ba
|
1,262
sqft
|
built
1967
9456 SW 77th Ave, Miami, FL 33156
$-1,494
Cash flow
-17.7%
Cash-on-Cash Return
2.2%
Cap rate
0.6%
Rent to Value Ratio

Active
$4,900,000
4
bds
|
5
ba
|
3,852
sqft
|
built
2019
851 NE 1st Ave, Miami, FL 33132
$-27,935
Cash flow
-29.7%
Cash-on-Cash Return
-0.6%
Cap rate
0.2%
Rent to Value Ratio

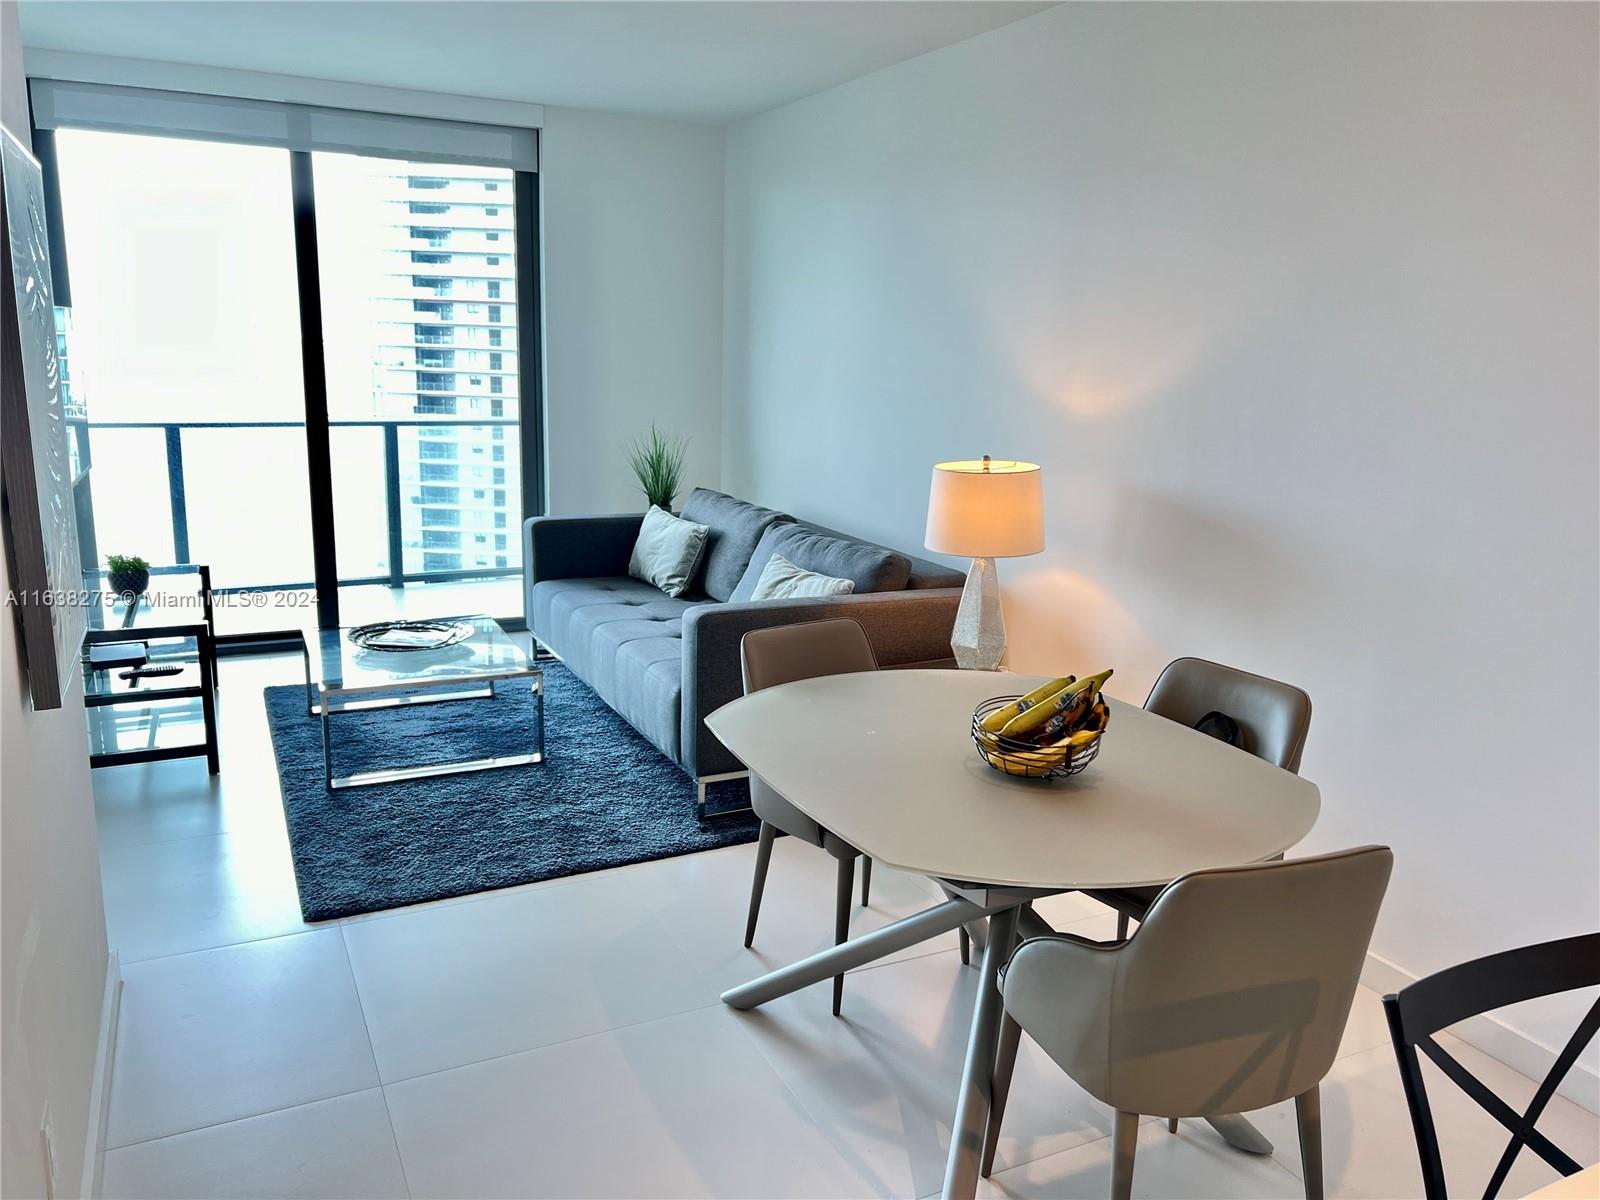
Active
$849,000
2
bds
|
2
ba
|
1,048
sqft
|
built
2008
1750 N Bayshore Dr, Miami, FL 33132
$-3,954
Cash flow
-24.3%
Cash-on-Cash Return
0.7%
Cap rate
0.4%
Rent to Value Ratio
Active
$1,780,000
6
bds
|
3
ba
|
2,858
sqft
|
built
2016
6920 SW 96th Ct, Miami, FL 33173
$-4,881
Cash flow
-14.3%
Cash-on-Cash Return
3.0%
Cap rate
0.4%
Rent to Value Ratio
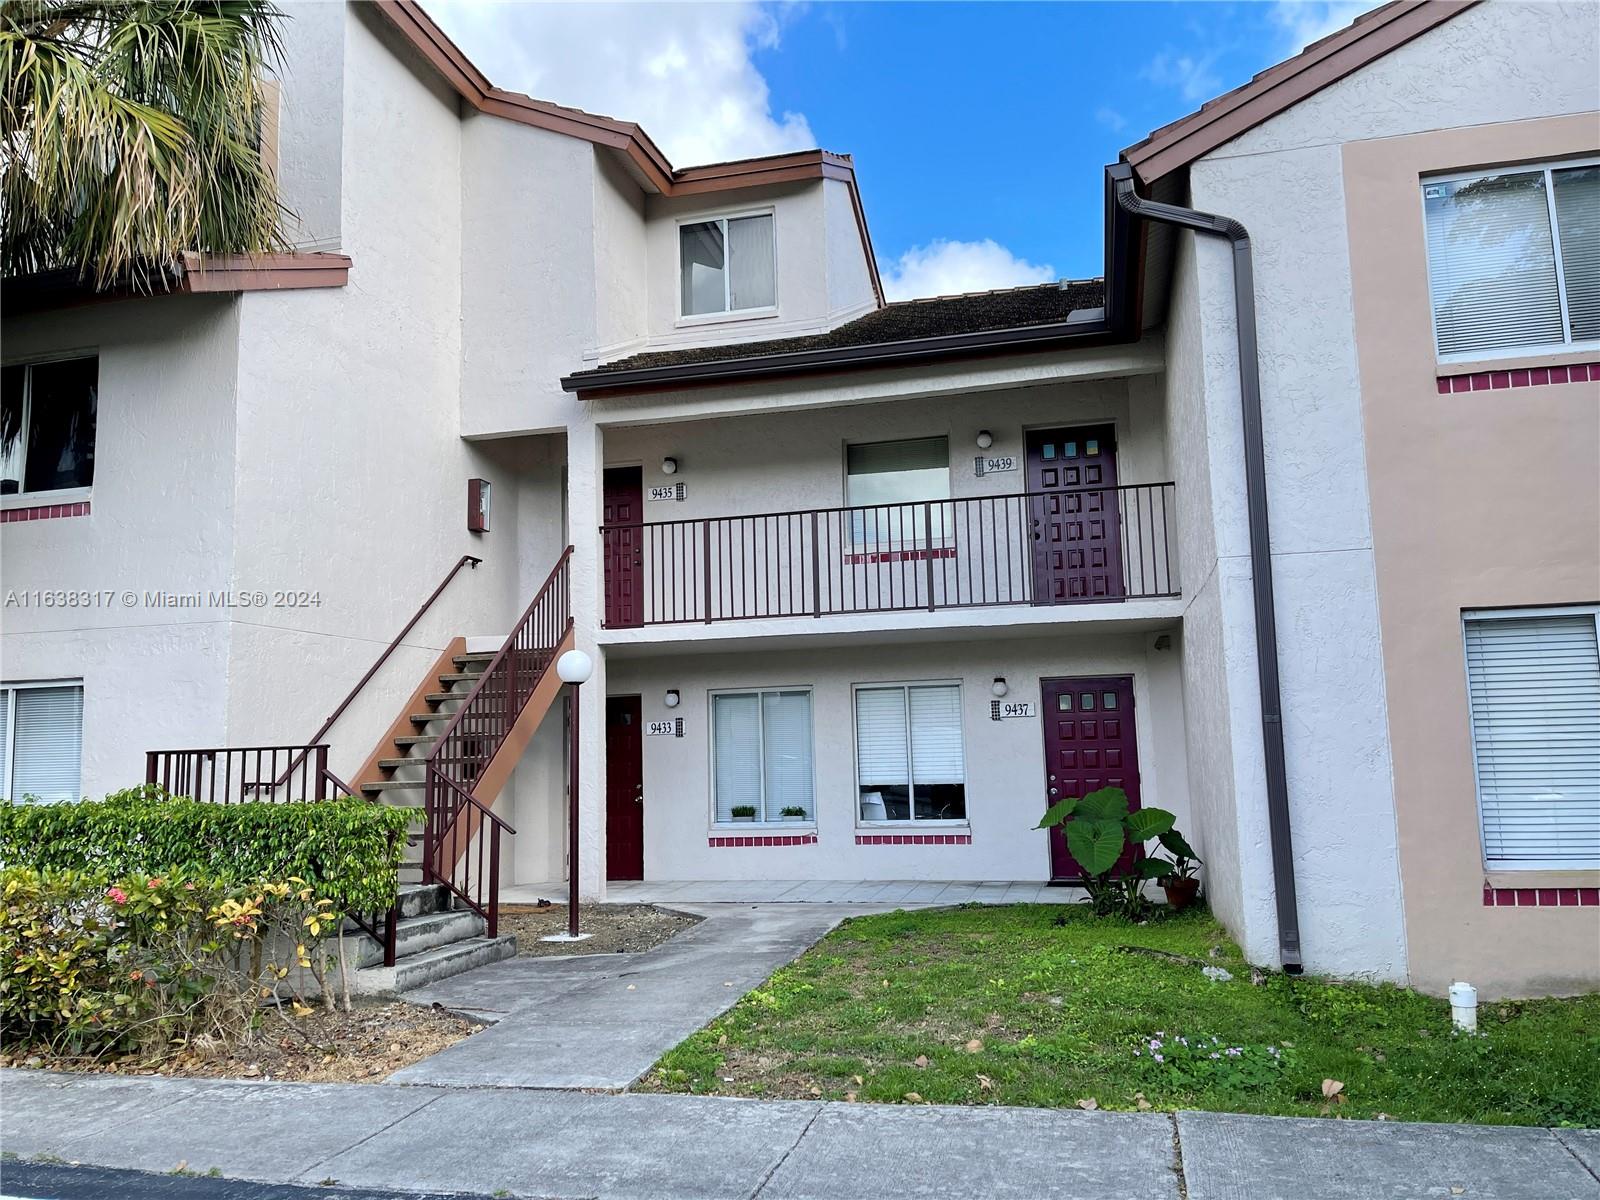
Active
$355,000
2
bds
|
2
ba
|
1,312
sqft
|
built
1987
9435 SW 140th Ct, Miami, FL 33186
$-1,050
Cash flow
-15.4%
Cash-on-Cash Return
2.7%
Cap rate
0.7%
Rent to Value Ratio

Active
$2,350,000
4
bds
|
5
ba
|
2,349
sqft
|
built
2018
650 NE 32nd St, Miami, FL 33137
$-9,491
Cash flow
-21.1%
Cash-on-Cash Return
1.4%
Cap rate
0.5%
Rent to Value Ratio
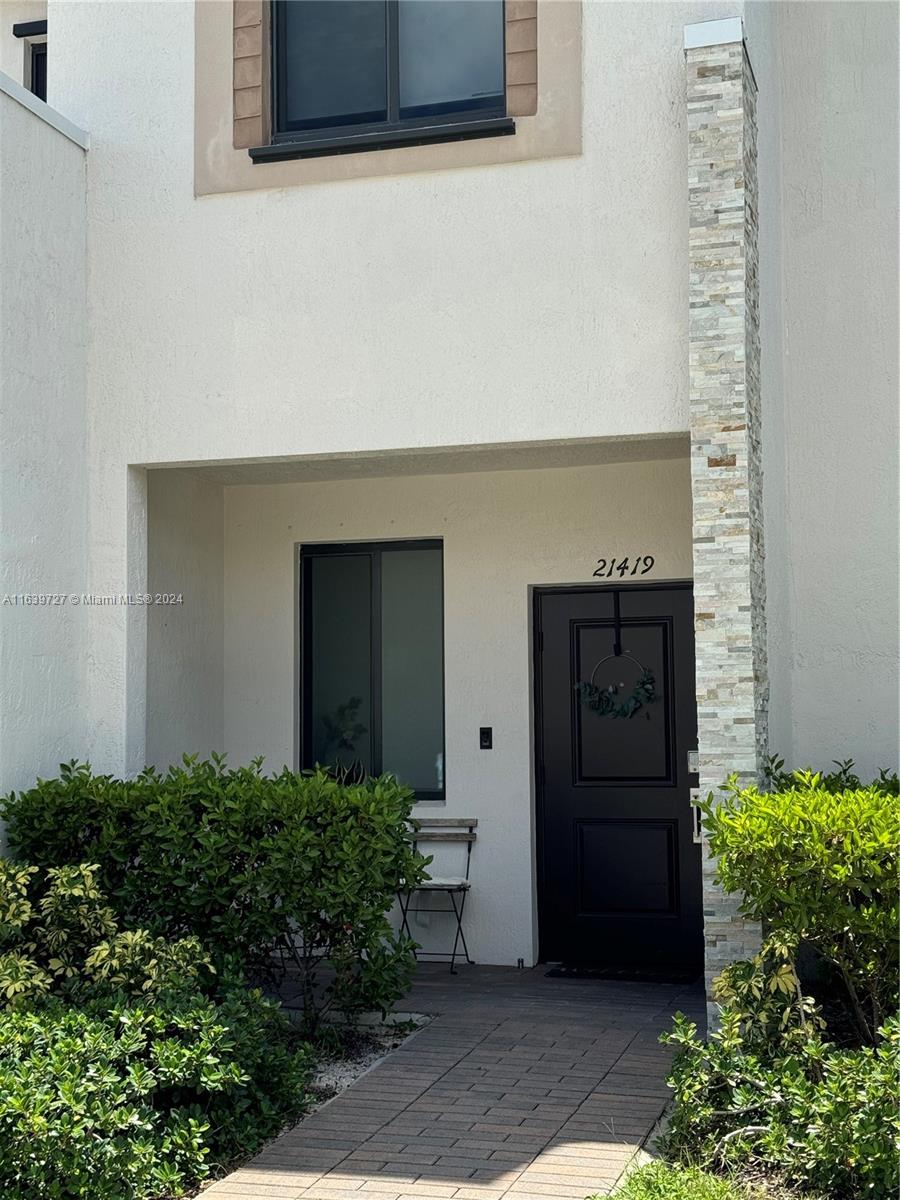
Active
$455,000
3
bds
|
3
ba
|
1,485
sqft
|
built
2020
21419 NE 2nd Path, Miami, FL 33179
$-1,398
Cash flow
-16.0%
Cash-on-Cash Return
2.6%
Cap rate
0.6%
Rent to Value Ratio
Active
$499,500
1
bds
|
2
ba
|
610
sqft
|
built
2018
501 NE 31st St, Miami, FL 33137
$-1,756
Cash flow
-18.3%
Cash-on-Cash Return
2.1%
Cap rate
0.7%
Rent to Value Ratio

Active
$539,000
1
bds
|
1
ba
|
812
sqft
|
built
2016
601 NE 27th St, Miami, FL 33137
$-1,730
Cash flow
-16.7%
Cash-on-Cash Return
2.4%
Cap rate
0.7%
Rent to Value Ratio

Active
$605,000
2
bds
|
2
ba
|
1,048
sqft
|
built
2008
1750 N Bayshore Dr, Miami, FL 33132
$-2,195
Cash flow
-18.9%
Cash-on-Cash Return
1.9%
Cap rate
0.7%
Rent to Value Ratio
Active
$1,270,000
2
bds
|
2
ba
|
1,313
sqft
|
built
2008
465 Brickell Ave, Miami, FL 33131
$-4,042
Cash flow
-16.6%
Cash-on-Cash Return
2.5%
Cap rate
0.6%
Rent to Value Ratio
Active
$1,500,000
6
bds
|
4
ba
|
0
sqft
|
built
2005
2852 SW 139th Ct, Miami, FL 33175
$-4,268
Cash flow
-14.8%
Cash-on-Cash Return
2.9%
Cap rate
0.4%
Rent to Value Ratio
Active
$495,000
1
bds
|
1
ba
|
738
sqft
|
built
2008
55 SE 6th St, Miami, FL 33131
$-2,121
Cash flow
-22.4%
Cash-on-Cash Return
1.1%
Cap rate
0.6%
Rent to Value Ratio
Active
$700,000
1
bds
|
2
ba
|
1,185
sqft
|
built
2019
851 NE 1st St, Miami, FL 33132
$-3,562
Cash flow
-26.5%
Cash-on-Cash Return
0.2%
Cap rate
0.6%
Rent to Value Ratio

Active
$400,000
3
bds
|
1
ba
|
764
sqft
|
built
1950
1434 NW 116th St, Miami, FL 33167
$-550
Cash flow
-7.2%
Cash-on-Cash Return
4.6%
Cap rate
0.7%
Rent to Value Ratio
Active
$304,900
2
bds
|
2
ba
|
1,131
sqft
|
built
1975
9150 Fontainebleau Blvd, Miami, FL 33172
$-282
Cash flow
-4.8%
Cash-on-Cash Return
5.2%
Cap rate
0.8%
Rent to Value Ratio
Active
$399,000
3
bds
|
1
ba
|
1,152
sqft
|
built
1947
1487 NW 100th St, Miami, FL 33147
$-627
Cash flow
-8.2%
Cash-on-Cash Return
4.4%
Cap rate
0.7%
Rent to Value Ratio
Active
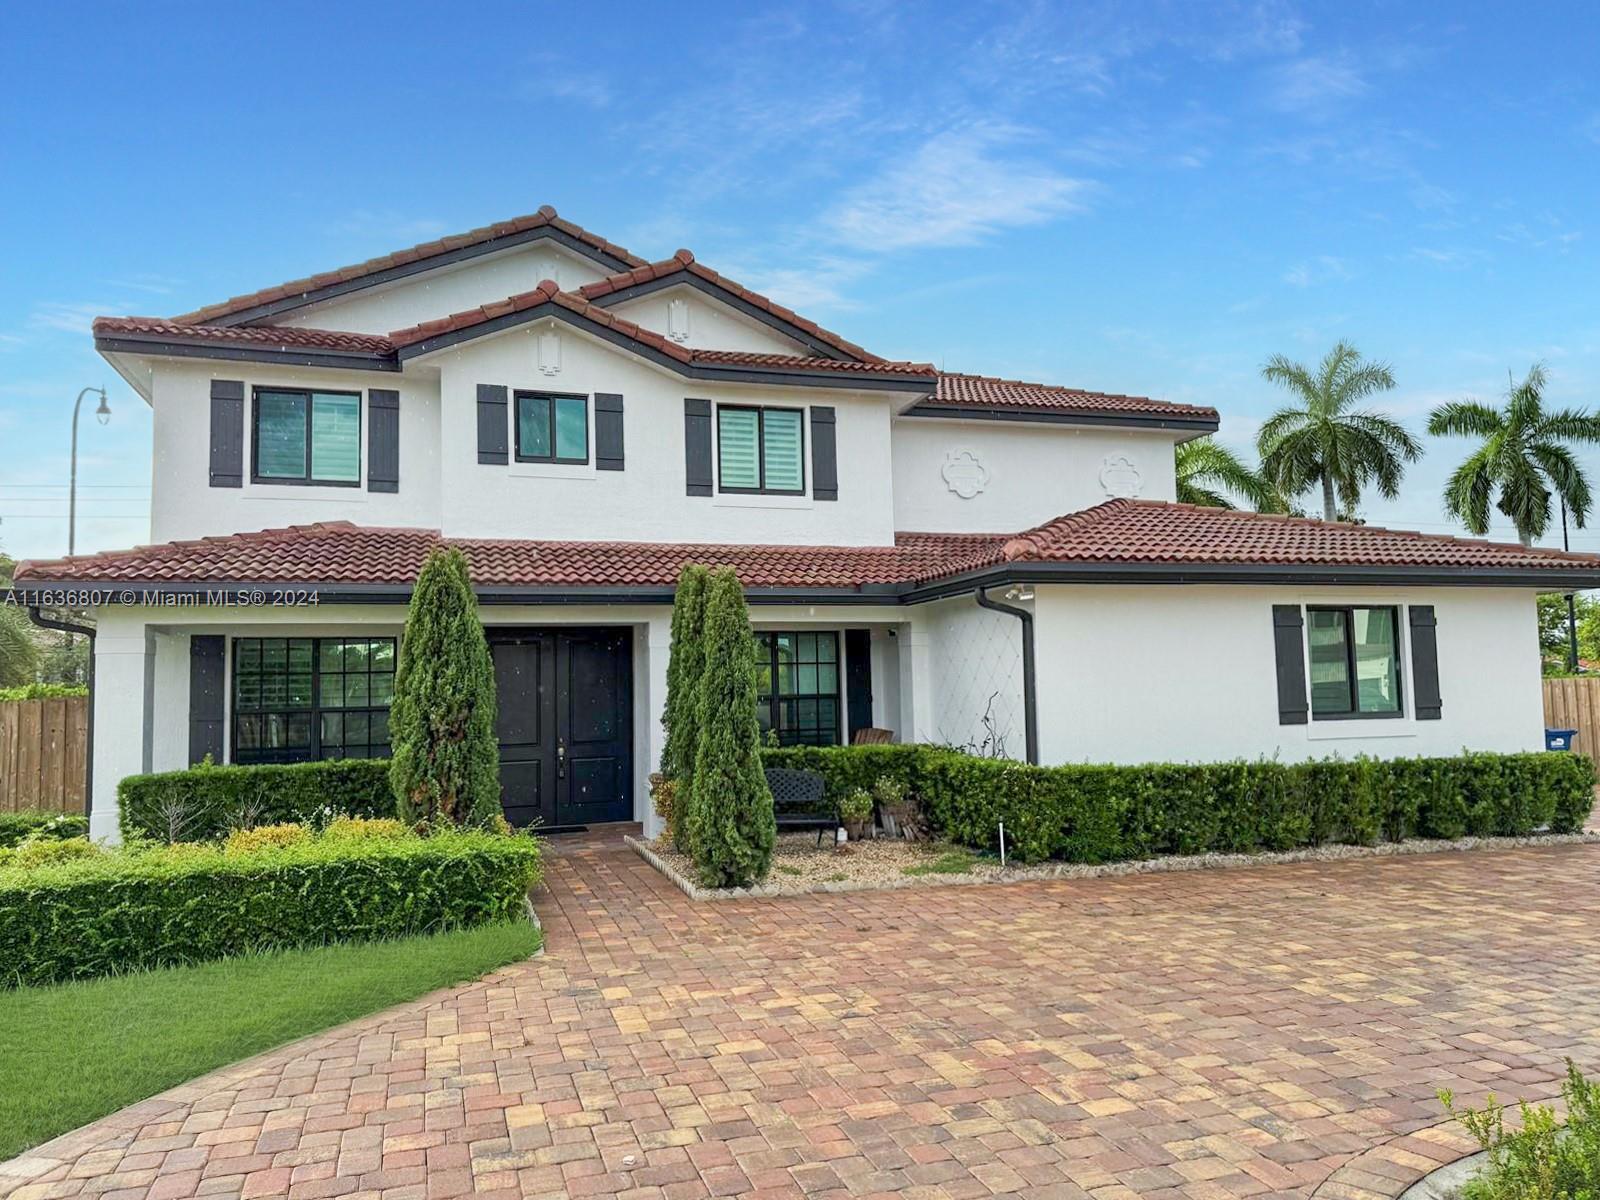
$845,000
5
bds
|
3
ba
|
2,567
sqft
|
built
2013
18302 SW 152nd Ct, Miami, FL 33187
$-1,379
Cash flow
-8.5%
Cash-on-Cash Return
4.3%
Cap rate
0.7%
Rent to Value Ratio