Miami, FL Investment Properties for Sale
Browse homes for sale and investment properties in Miami, FL. Refine your search by price, property type, or more.
Best cash flowing properties in Miami, FL

Active
$309,985
2
bds
|
2
ba
|
1,009
sqft
|
built
1985
11091 NW 7th St, Miami, FL 33172
$-245
Cash flow
-4.1%
Cash-on-Cash Return
5.3%
Cap rate
0.8%
Rent to Value Ratio
Active
$285,000
2
bds
|
3
ba
|
1,415
sqft
|
built
1972
9353 Fontainebleau Blvd, Miami, FL 33172
$-393
Cash flow
-7.2%
Cash-on-Cash Return
4.6%
Cap rate
0.9%
Rent to Value Ratio
6,178 out of 7,014 properties for sale in Miami, FL
Limited Results Shown
Create a free account, or log in to reveal all property listings and enjoy the complete experience.
Active
$849,000
2
bds
|
3
ba
|
1,449
sqft
|
built
2005
601 NE 36th St, Miami, FL 33137
$-609
Cash flow
-3.7%
Cash-on-Cash Return
5.4%
Cap rate
0.8%
Rent to Value Ratio
Active
$499,900
2
bds
|
2
ba
|
998
sqft
|
built
2006
2600 SW 27th Ave, Miami, FL 33133
$-1,556
Cash flow
-16.2%
Cash-on-Cash Return
2.5%
Cap rate
0.6%
Rent to Value Ratio
Active
$2,725,000
2
bds
|
4
ba
|
2,580
sqft
|
built
1997
1643 Brickell Ave, Miami, FL 33129
$-13,172
Cash flow
-25.2%
Cash-on-Cash Return
0.5%
Cap rate
0.3%
Rent to Value Ratio
Active
$789,000
2
bds
|
2
ba
|
1,369
sqft
|
built
2015
999 SW 1st Ave, Miami, FL 33130
$-3,446
Cash flow
-22.8%
Cash-on-Cash Return
1.0%
Cap rate
0.6%
Rent to Value Ratio
Active
$489,999
4
bds
|
0
ba
|
2,253
sqft
|
built
1925
1842 NW 18th Ter, Miami, FL 33125
$-1,737
Cash flow
-18.5%
Cash-on-Cash Return
2.0%
Cap rate
0.5%
Rent to Value Ratio
Active
$1,550,000
3
bds
|
3
ba
|
1,753
sqft
|
built
2017
1010 Brickell Ave, Miami, FL 33131
$-6,656
Cash flow
-22.4%
Cash-on-Cash Return
1.1%
Cap rate
0.5%
Rent to Value Ratio
Active
$1,600,000
4
bds
|
2
ba
|
1,960
sqft
|
built
1965
16000 N Miami Ave, Miami, FL 33169
$-5,413
Cash flow
-17.7%
Cash-on-Cash Return
2.2%
Cap rate
0.3%
Rent to Value Ratio

Active
$395,000
bds
|
1
ba
|
412
sqft
|
built
2022
227 NE 2nd St, Miami, FL 33132
$-1,035
Cash flow
-13.7%
Cash-on-Cash Return
3.1%
Cap rate
0.8%
Rent to Value Ratio
Active
$1,399,999
5
bds
|
0
ba
|
3,055
sqft
|
built
1974
7035 SW 21st St, Miami, FL 33155
$-6,315
Cash flow
-23.5%
Cash-on-Cash Return
0.9%
Cap rate
0.2%
Rent to Value Ratio

Active
$2,250,000
5
bds
|
3
ba
|
2,943
sqft
|
built
1971
2120 NE 204th St, Miami, FL 33179
$-4,922
Cash flow
-11.4%
Cash-on-Cash Return
3.7%
Cap rate
0.5%
Rent to Value Ratio
Active
$309,985
2
bds
|
2
ba
|
1,009
sqft
|
built
1985
11091 NW 7th St, Miami, FL 33172
$-245
Cash flow
-4.1%
Cash-on-Cash Return
5.3%
Cap rate
0.8%
Rent to Value Ratio
Active
$285,000
2
bds
|
3
ba
|
1,415
sqft
|
built
1972
9353 Fontainebleau Blvd, Miami, FL 33172
$-393
Cash flow
-7.2%
Cash-on-Cash Return
4.6%
Cap rate
0.9%
Rent to Value Ratio
Active
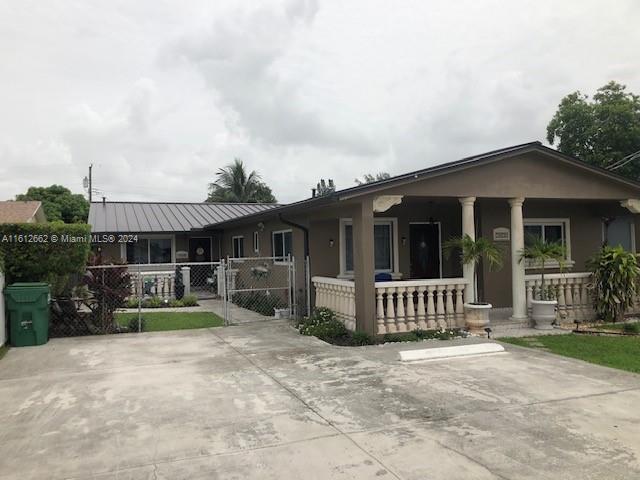
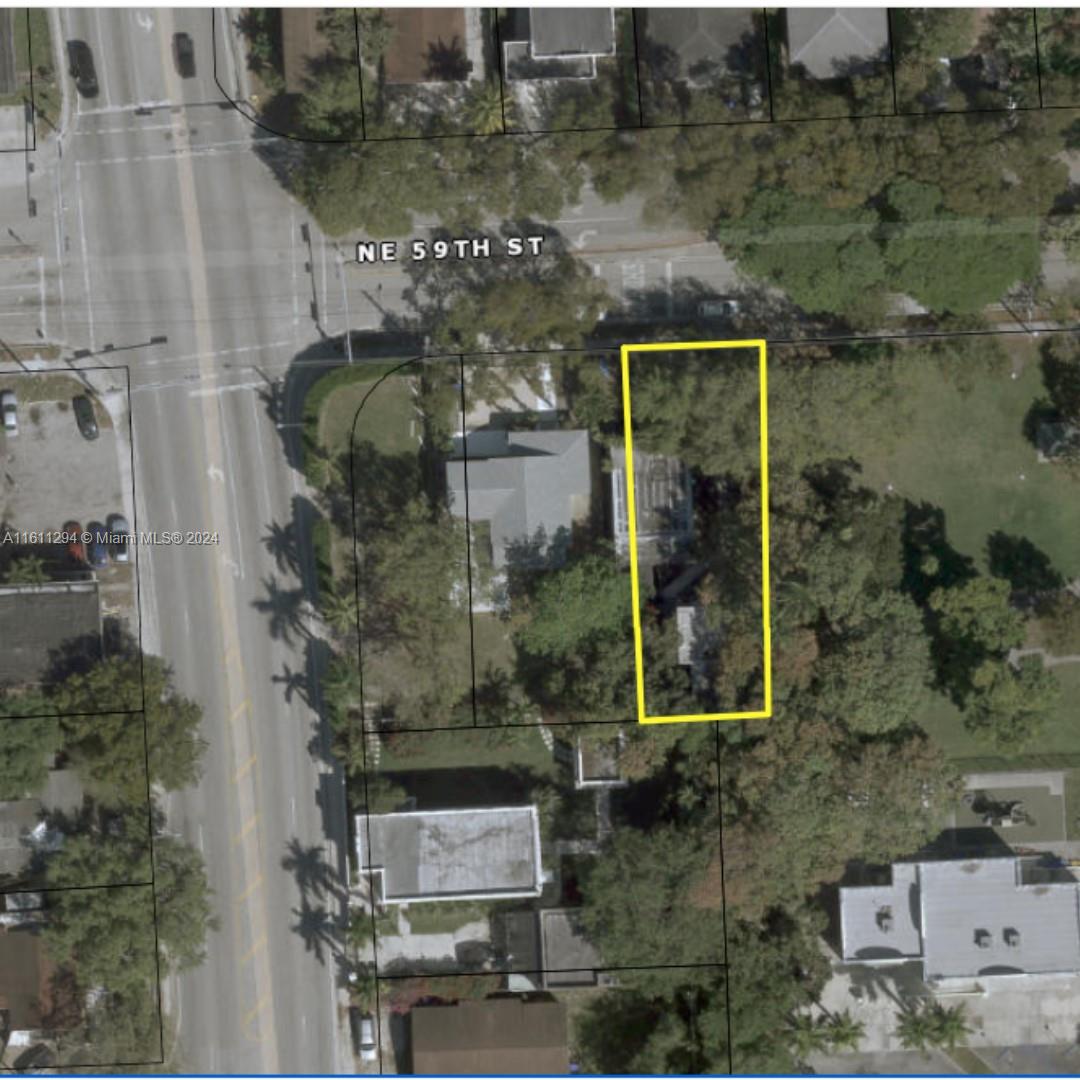
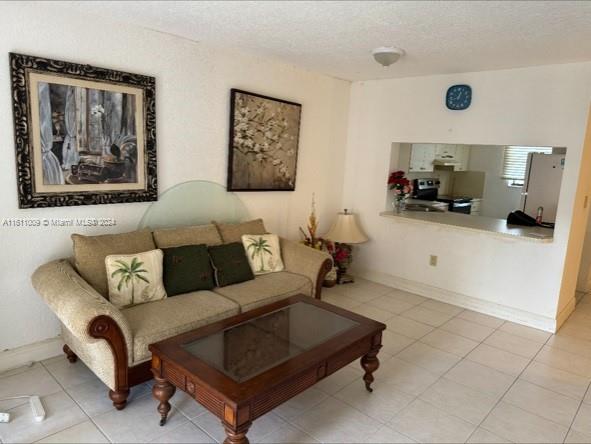
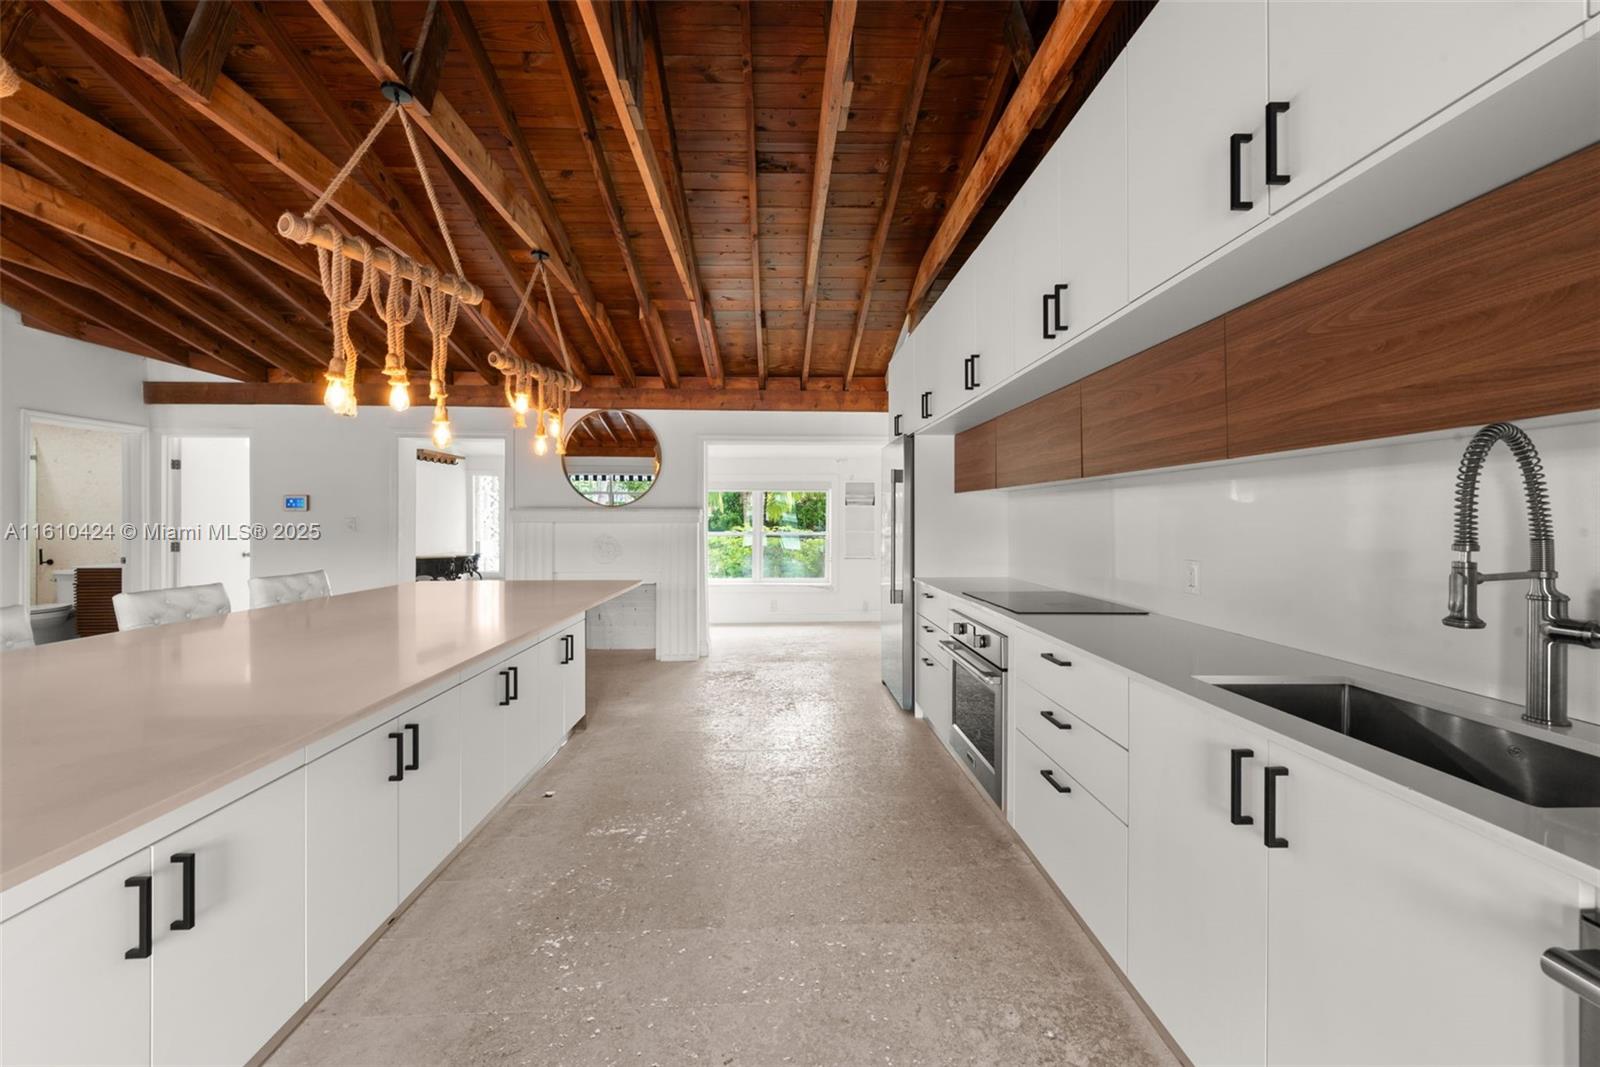
$799,000
2
bds
|
0
ba
|
2,669
sqft
|
built
1930
22 NE 59th St, Miami, FL 33137
$-2,804
Cash flow
-18.3%
Cash-on-Cash Return
2.1%
Cap rate
0.4%
Rent to Value Ratio
Active
$319,900
2
bds
|
2
ba
|
986
sqft
|
built
1984
8517 NW 7th St, Miami, FL 33126
$-819
Cash flow
-13.4%
Cash-on-Cash Return
3.2%
Cap rate
0.6%
Rent to Value Ratio
Active
$4,850,000
4
bds
|
4
ba
|
2,195
sqft
|
built
1940
1110 NW North River Dr, Miami, FL 33136
$-19,742
Cash flow
-21.2%
Cash-on-Cash Return
1.4%
Cap rate
0.2%
Rent to Value Ratio

Active
$429,000
bds
|
1
ba
|
425
sqft
|
built
2004
1200 Brickell Bay Dr, Miami, FL 33131
$-988
Cash flow
-12.0%
Cash-on-Cash Return
3.5%
Cap rate
0.7%
Rent to Value Ratio
Active
$530,000
1
bds
|
1
ba
|
945
sqft
|
built
2015
999 SW 1st Ave, Miami, FL 33130
$-1,816
Cash flow
-17.9%
Cash-on-Cash Return
2.2%
Cap rate
0.7%
Rent to Value Ratio
Active
$13,000,000
7
bds
|
9
ba
|
6,340
sqft
|
built
2021
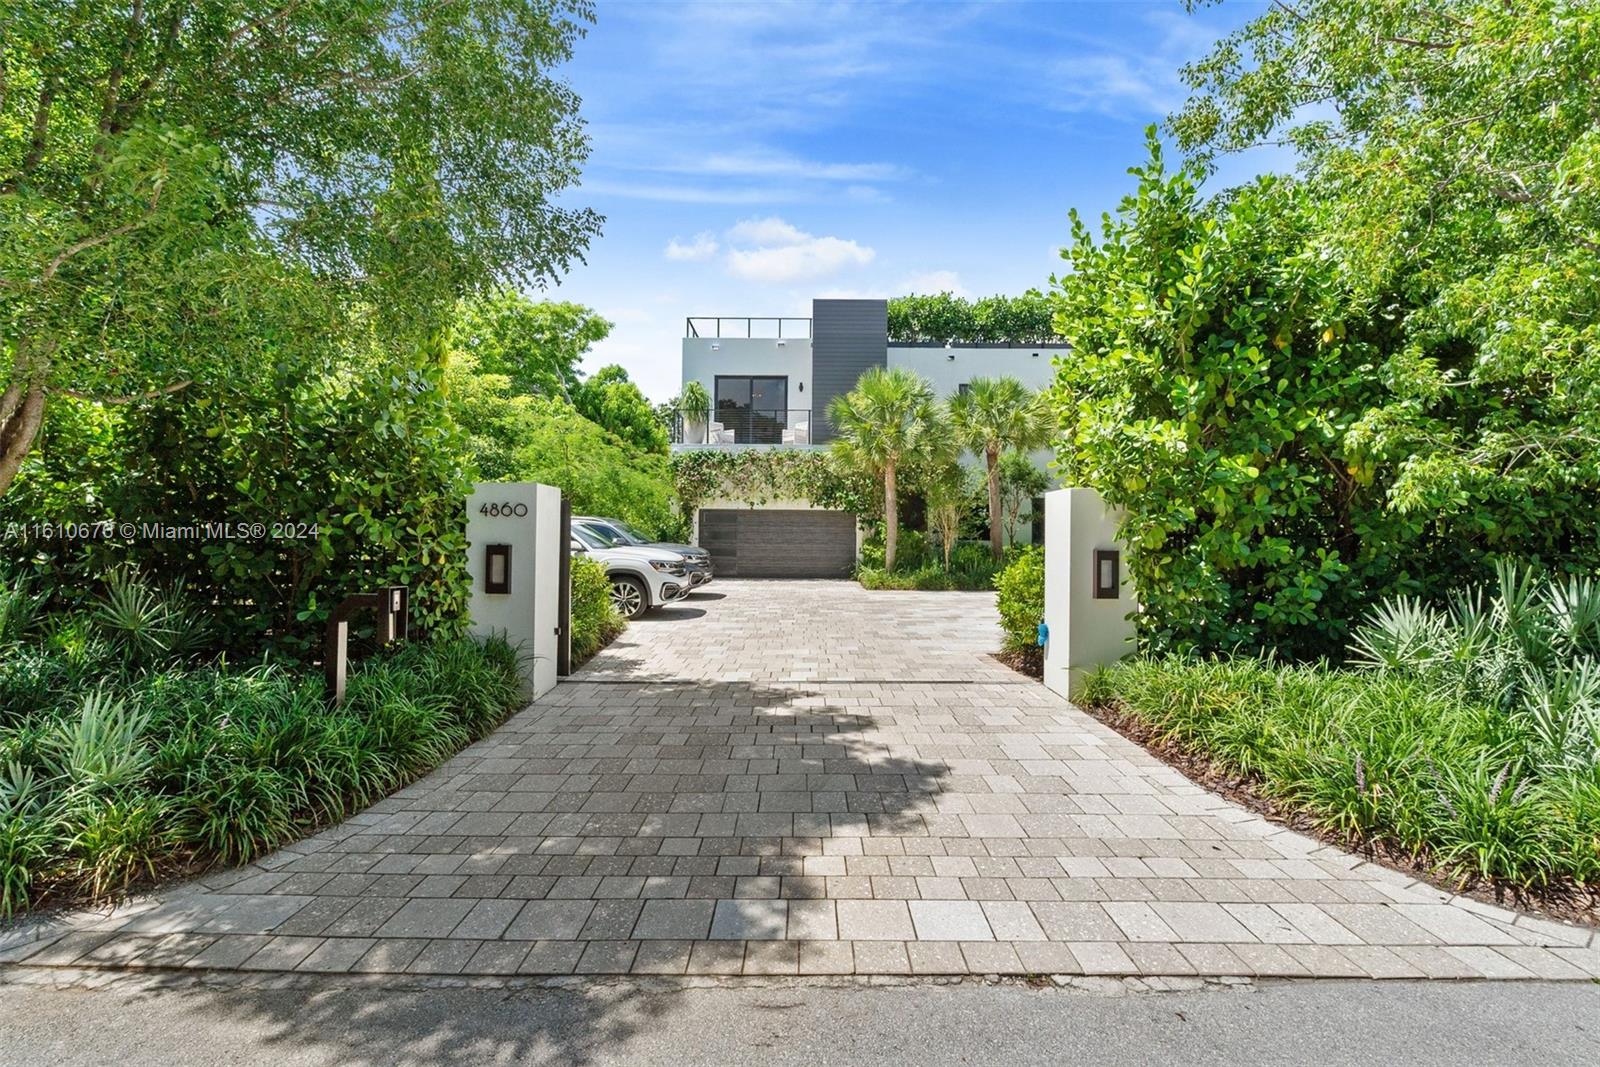
4860 SW 76th St, Miami, FL 33143
$-67,693
Cash flow
-27.2%
Cash-on-Cash Return
0.0%
Cap rate
0.1%
Rent to Value Ratio
Active
$745,000
4
bds
|
0
ba
|
2,114
sqft
|
built
1963
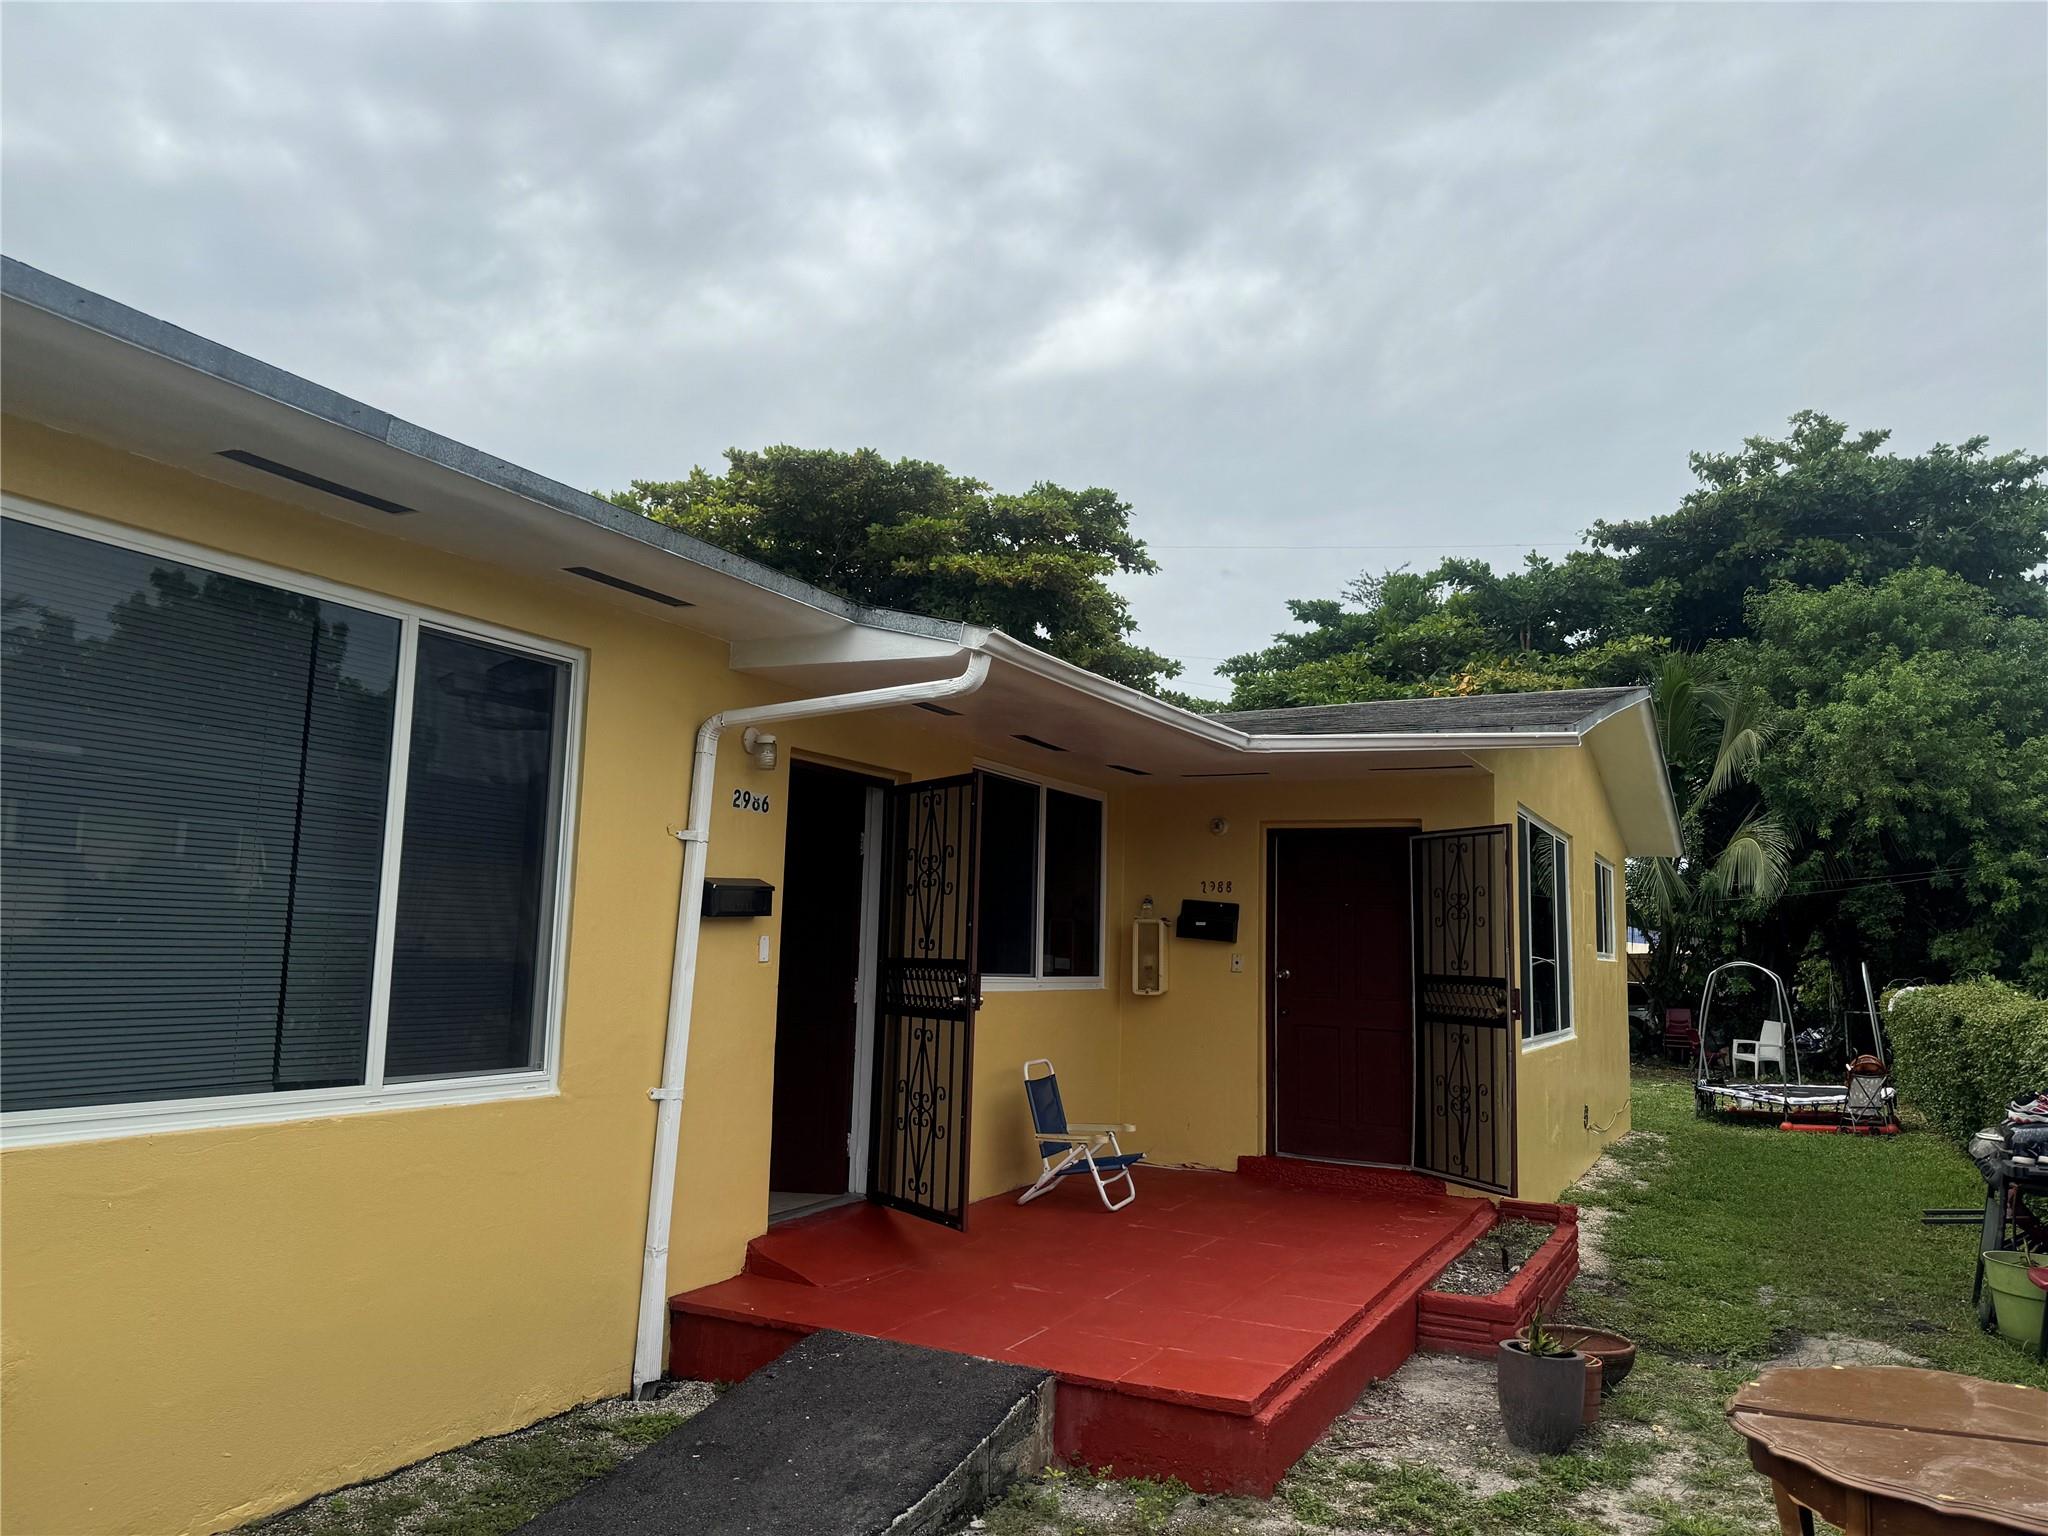
2986 NW 91st St, Miami, FL 33147
$-2,628
Cash flow
-18.4%
Cash-on-Cash Return
2.1%
Cap rate
0.3%
Rent to Value Ratio
Active
$465,000
2
bds
|
2
ba
|
948
sqft
|
built
2008
350 NE 24th St, Miami, FL 33137
$-2,245
Cash flow
-25.2%
Cash-on-Cash Return
0.5%
Cap rate
0.8%
Rent to Value Ratio
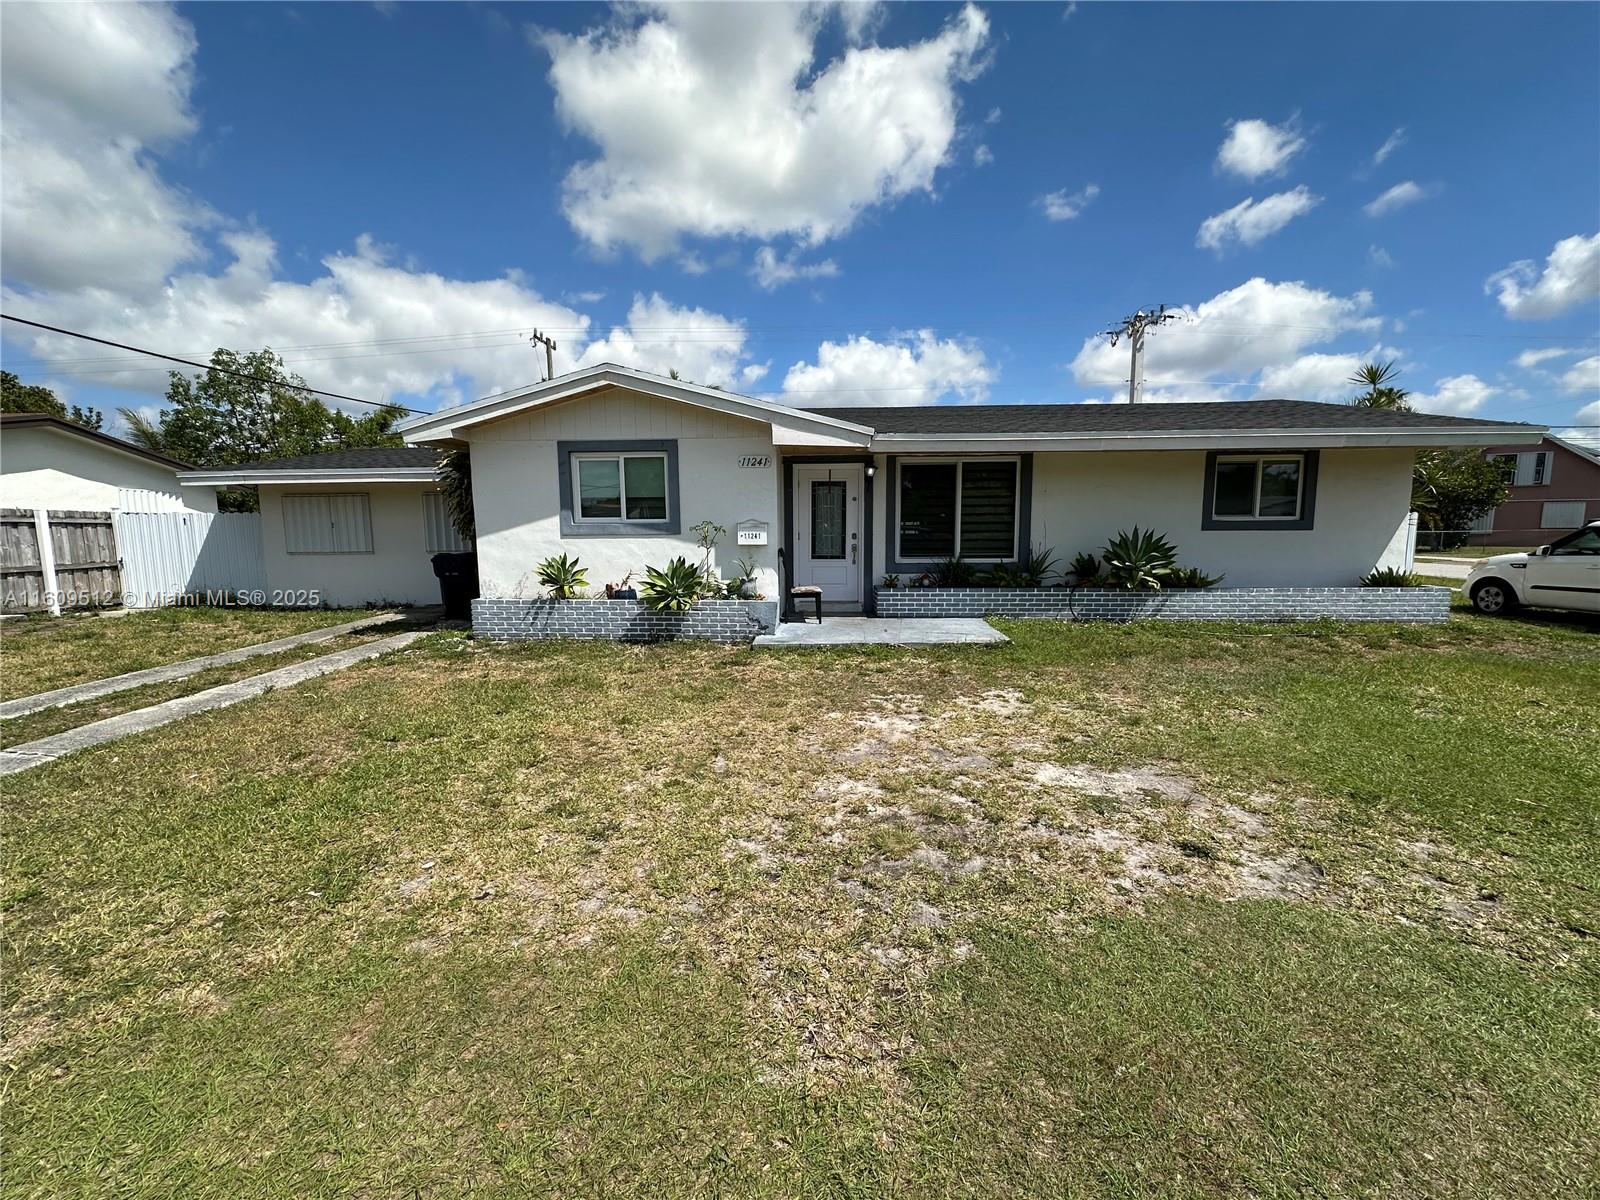
Active
$695,000
4
bds
|
3
ba
|
1,473
sqft
|
built
1961
11241 SW 177th St, Miami, FL 33157
$-1,305
Cash flow
-9.8%
Cash-on-Cash Return
4.0%
Cap rate
0.5%
Rent to Value Ratio
Active
$285,000
2
bds
|
2
ba
|
911
sqft
|
built
1975
10661 SW 108th Ave, Miami, FL 33176
$-394
Cash flow
-7.2%
Cash-on-Cash Return
4.6%
Cap rate
0.8%
Rent to Value Ratio

Active
$3,000,000
5
bds
|
5
ba
|
3,200
sqft
|
built
1995
21301 NE 38th Ave, Miami, FL 33180
$-12,197
Cash flow
-21.2%
Cash-on-Cash Return
1.4%
Cap rate
0.4%
Rent to Value Ratio

Active
$769,000
3
bds
|
2
ba
|
1,200
sqft
|
built
1988
1632 SW 19th Ter, Miami, FL 33145
$-1,737
Cash flow
-11.8%
Cash-on-Cash Return
3.6%
Cap rate
0.5%
Rent to Value Ratio
Active
$355,000
1
bds
|
1
ba
|
825
sqft
|
built
2008
1750 N Bayshore Dr, Miami, FL 33132
$-1,124
Cash flow
-16.5%
Cash-on-Cash Return
2.5%
Cap rate
0.9%
Rent to Value Ratio

Active
$1,550,000
3
bds
|
3
ba
|
2,424
sqft
|
built
1981
3 Grove Isle Dr, Miami, FL 33133
$-3,756
Cash flow
-12.6%
Cash-on-Cash Return
3.4%
Cap rate
0.6%
Rent to Value Ratio

Active
$915,000
4
bds
|
3
ba
|
2,801
sqft
|
built
2007
6042 SW 163rd Ave, Miami, FL 33193
$-1,886
Cash flow
-10.8%
Cash-on-Cash Return
3.8%
Cap rate
0.6%
Rent to Value Ratio

Active
$229,900
1
bds
|
1
ba
|
0
sqft
|
built
1982
325 NW 72nd Ave, Miami, FL 33126
$-438
Cash flow
-9.9%
Cash-on-Cash Return
4.0%
Cap rate
0.8%
Rent to Value Ratio

Active
$270,000
3
bds
|
2
ba
|
1,925
sqft
|
built
1969
800 NE 195th St, Miami, FL 33179
$-703
Cash flow
-13.6%
Cash-on-Cash Return
3.2%
Cap rate
1.1%
Rent to Value Ratio
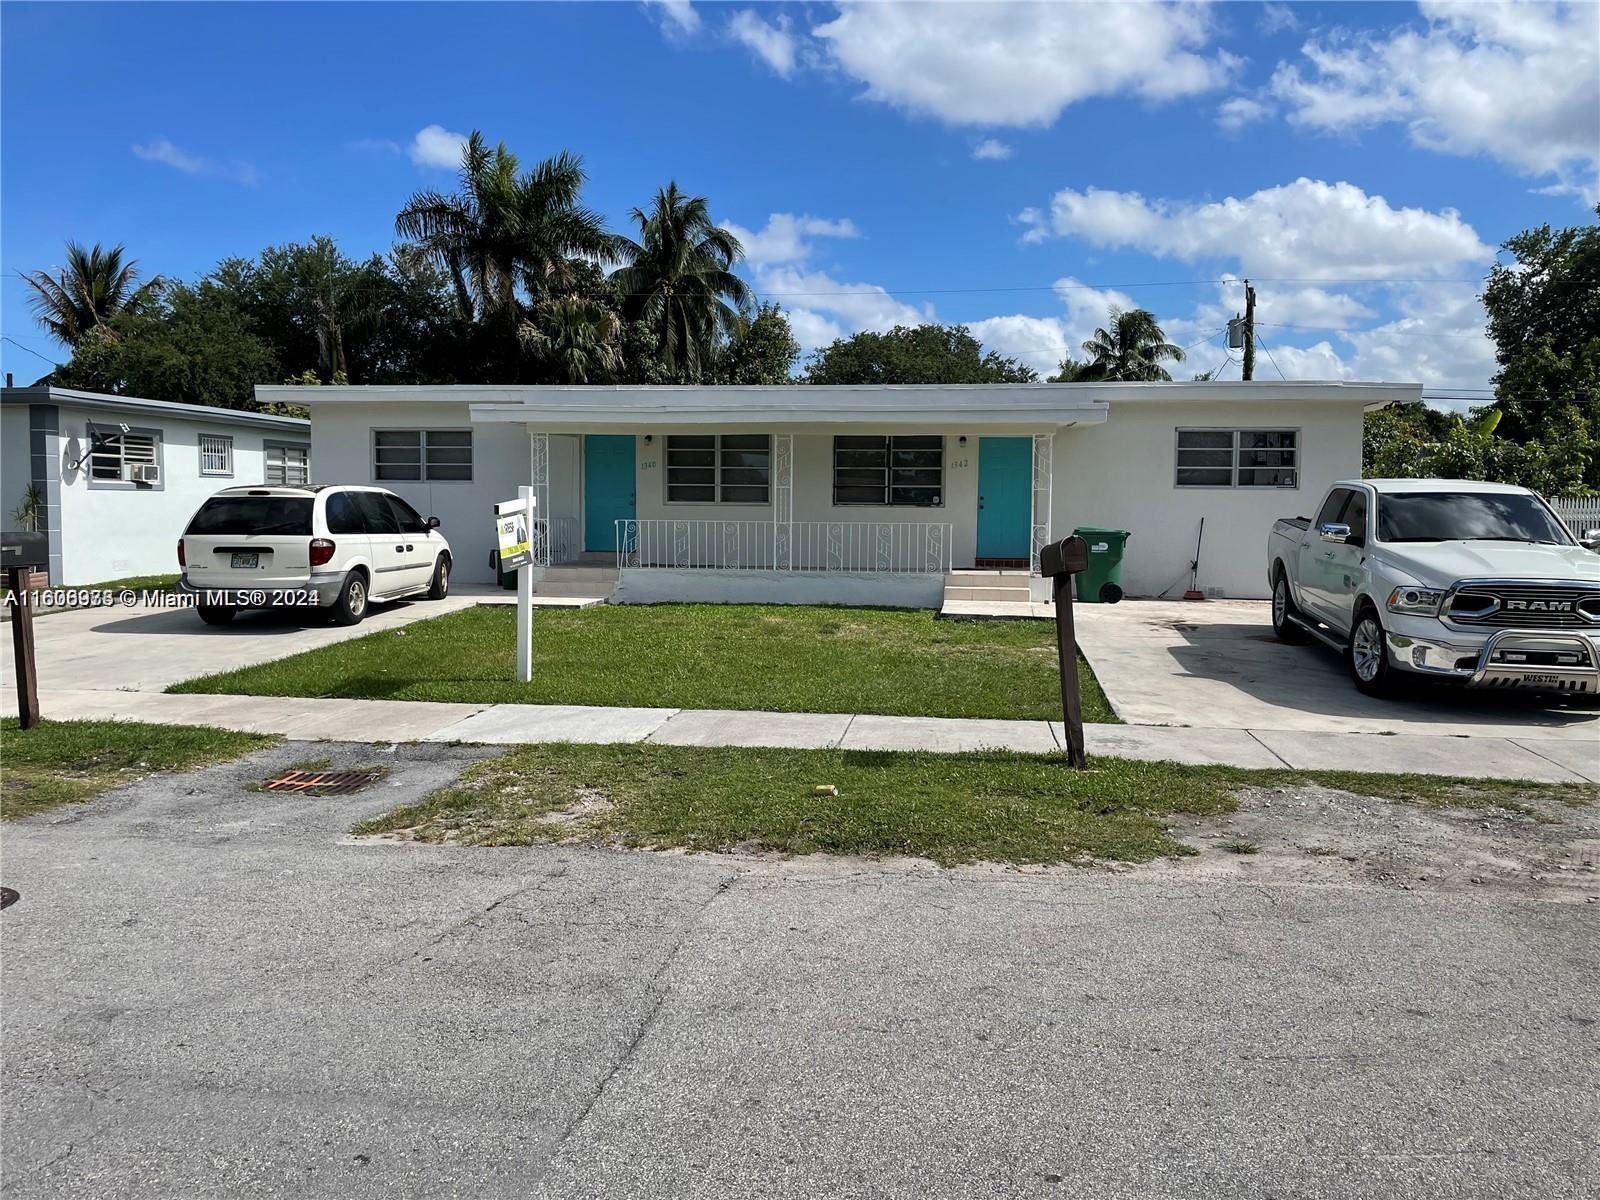
Active
$635,000
4
bds
|
0
ba
|
1,856
sqft
|
built
1955
1340 NW 102nd St, Miami, FL 33147
$-1,854
Cash flow
-15.2%
Cash-on-Cash Return
2.8%
Cap rate
0.4%
Rent to Value Ratio
Active
$610,000
2
bds
|
2
ba
|
1,048
sqft
|
built
2008
1750 N Bayshore Dr, Miami, FL 33132
$-2,229
Cash flow
-19.1%
Cash-on-Cash Return
1.9%
Cap rate
0.7%
Rent to Value Ratio
Active
$794,500
2
bds
|
2
ba
|
1,120
sqft
|
built
2001
2475 Brickell Ave, Miami, FL 33129
$-3,228
Cash flow
-21.2%
Cash-on-Cash Return
1.4%
Cap rate
0.5%
Rent to Value Ratio
Active
$750,000
2
bds
|
2
ba
|
1,385
sqft
|
built
2008
350 S Miami Ave, Miami, FL 33130
$-2,826
Cash flow
-19.7%
Cash-on-Cash Return
1.8%
Cap rate
0.6%
Rent to Value Ratio
Active
$308,000
bds
|
1
ba
|
488
sqft
|
built
2015
4250 Biscayne Blvd, Miami, FL 33137
$-845
Cash flow
-14.3%
Cash-on-Cash Return
3.0%
Cap rate
0.7%
Rent to Value Ratio
Active
$568,000
3
bds
|
2
ba
|
1,618
sqft
|
built
1953
1275 NW 117th St, Miami, FL 33167
$-888
Cash flow
-8.2%
Cash-on-Cash Return
4.4%
Cap rate
0.6%
Rent to Value Ratio
Active
$679,000
2
bds
|
2
ba
|
972
sqft
|
built
2018
121 NE 34th St, Miami, FL 33137
$-2,995
Cash flow
-23.0%
Cash-on-Cash Return
1.0%
Cap rate
0.6%
Rent to Value Ratio
Active
$345,000
1
bds
|
1
ba
|
775
sqft
|
built
2005
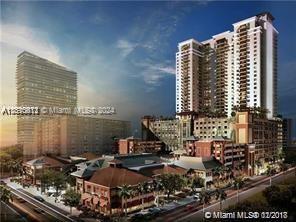
2275 Biscayne Blvd, Miami, FL 33137
$-1,301
Cash flow
-19.7%
Cash-on-Cash Return
1.8%
Cap rate
0.7%
Rent to Value Ratio
Active
$350,000
1
bds
|
1
ba
|
593
sqft
|
built
1989
800 N Miami Ave, Miami, FL 33136
$-1,440
Cash flow
-21.5%
Cash-on-Cash Return
1.3%
Cap rate
0.6%
Rent to Value Ratio
Active
$948,000
1
bds
|
2
ba
|
959
sqft
|
built
2018
3131 NE 7th Ave, Miami, FL 33137
$-3,548
Cash flow
-19.5%
Cash-on-Cash Return
1.8%
Cap rate
0.6%
Rent to Value Ratio
Active
$414,999
1
bds
|
1
ba
|
825
sqft
|
built
2008
1750 N Bayshore Dr, Miami, FL 33132
$-1,795
Cash flow
-22.6%
Cash-on-Cash Return
1.1%
Cap rate
0.7%
Rent to Value Ratio