Miami, FL Investment Properties for Sale
Browse homes for sale and investment properties in Miami, FL. Refine your search by price, property type, or more.
Best cash flowing properties in Miami, FL
Active
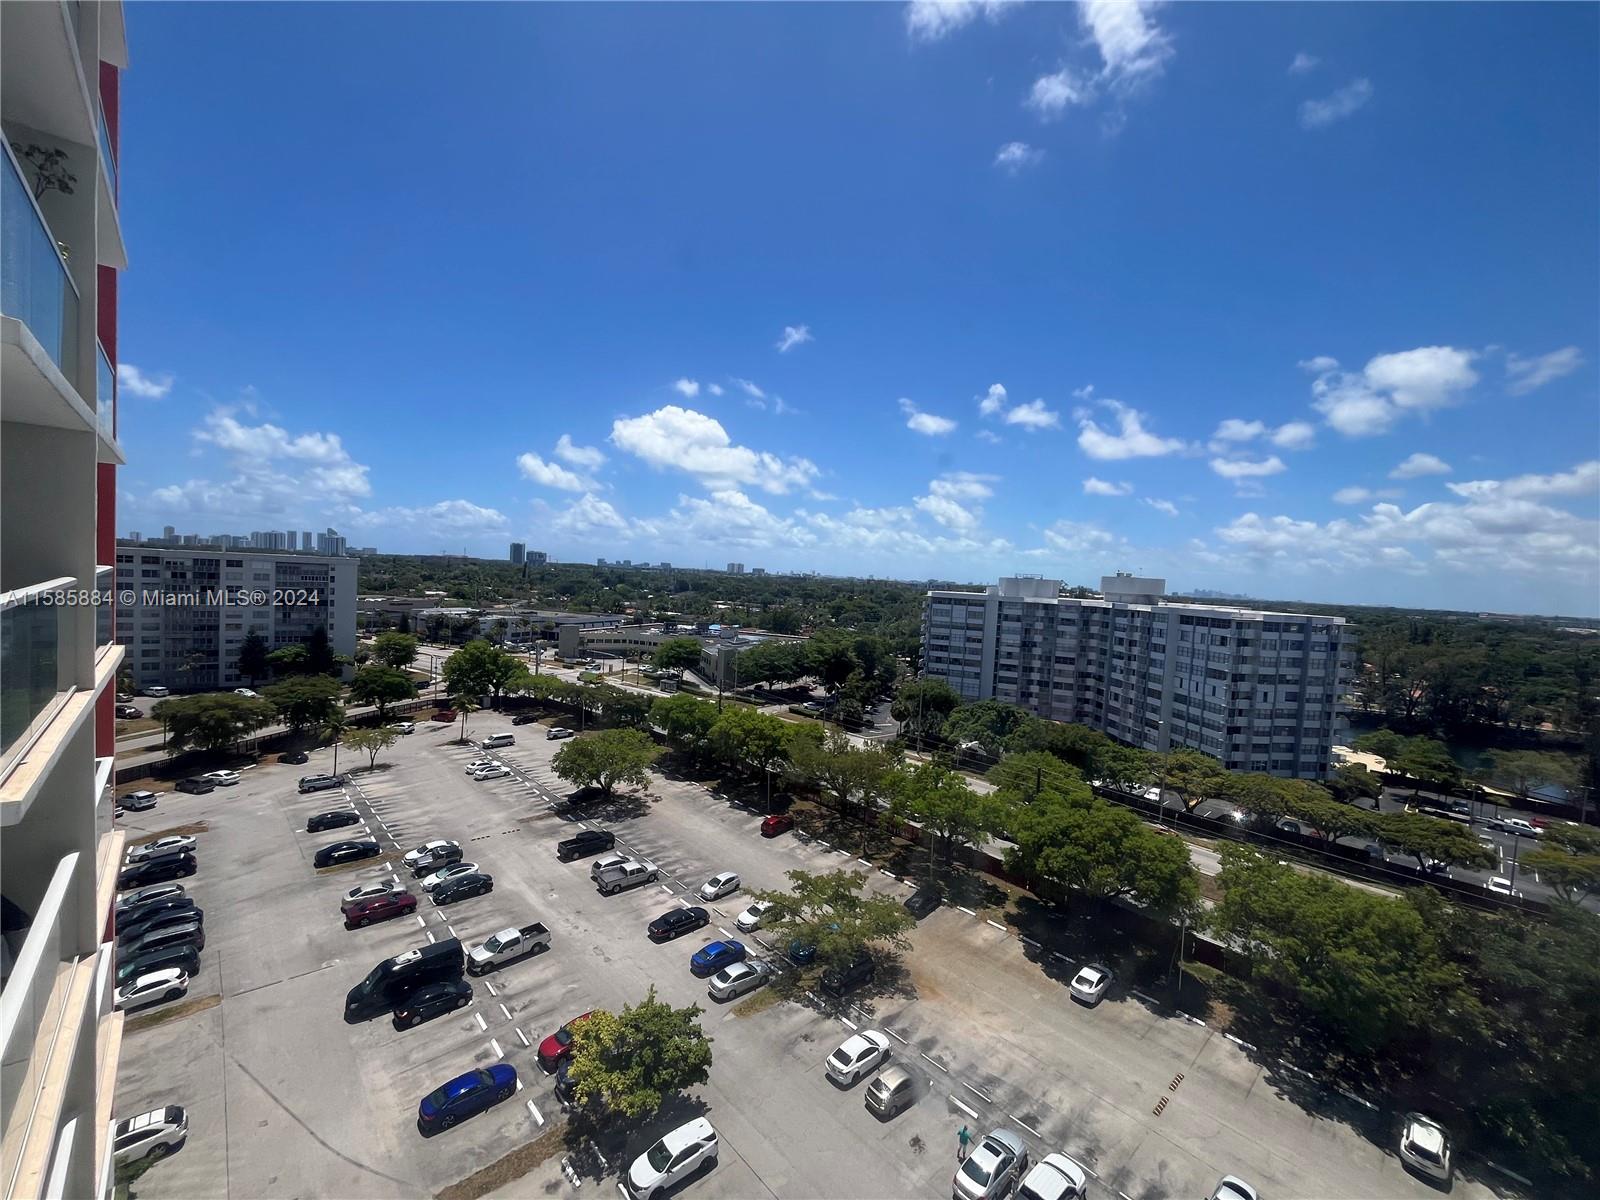
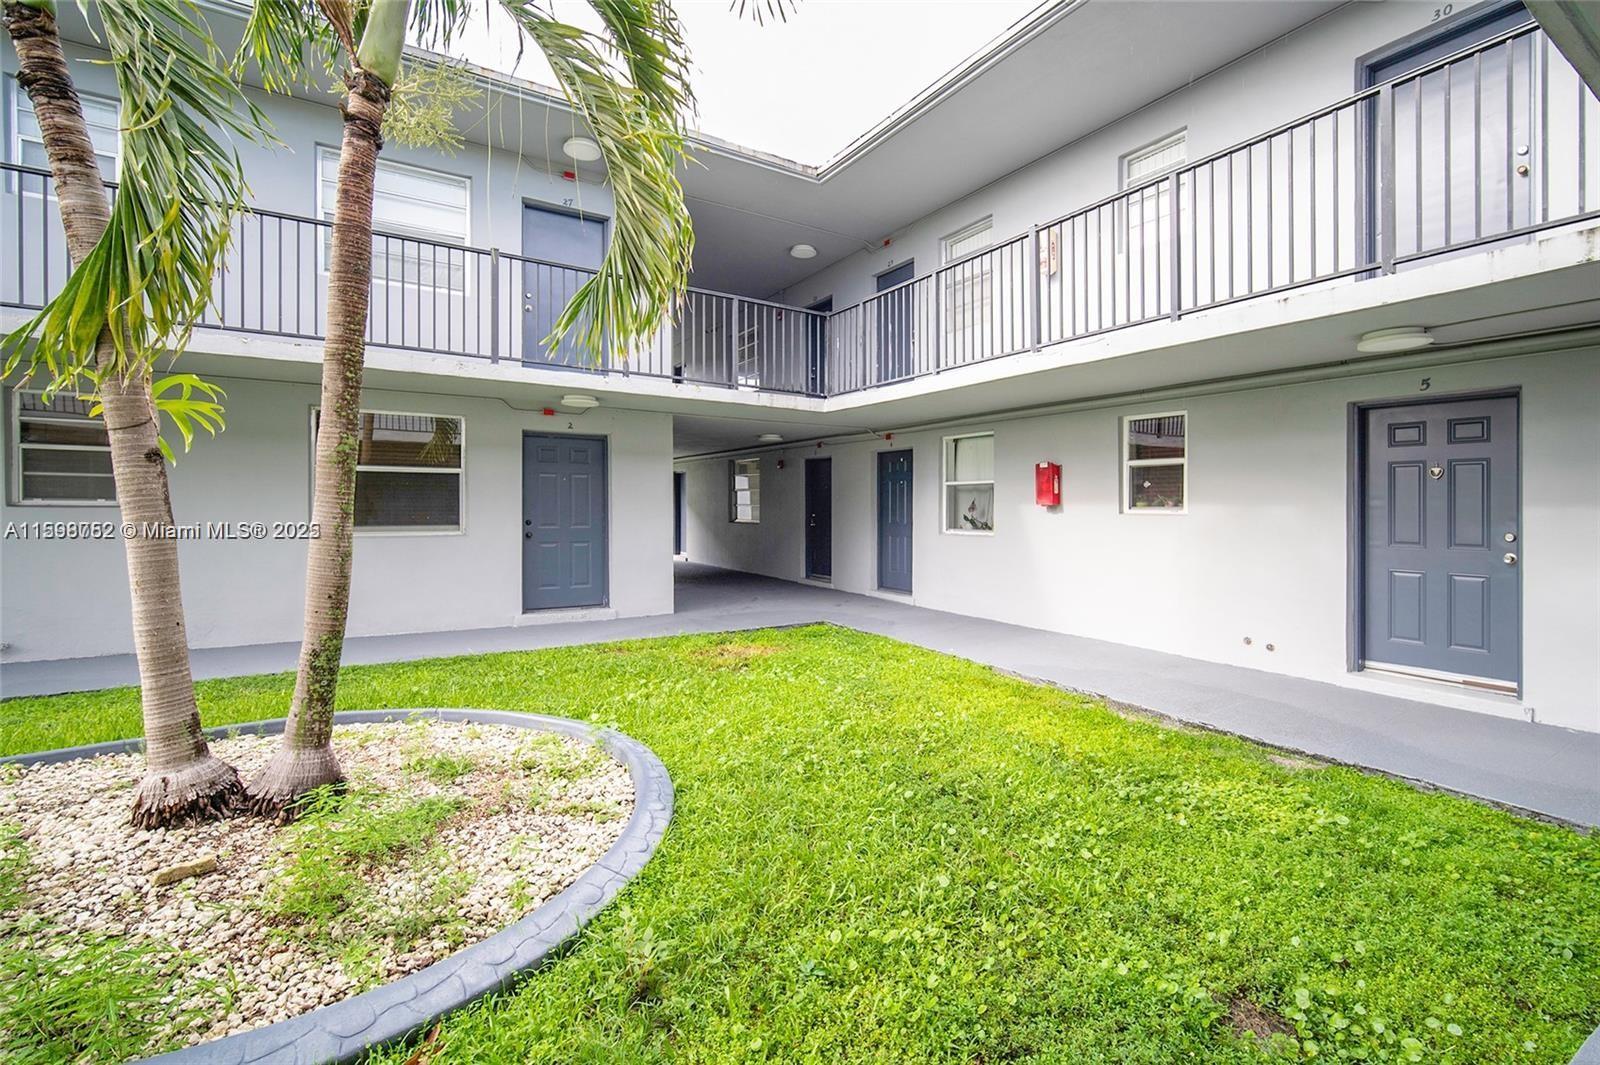
$215,000
1
bds
|
1
ba
|
801
sqft
|
built
1969
1351 NE Miami Gardens Dr, Miami, FL 33179
$-392
Cash flow
-9.5%
Cash-on-Cash Return
4.1%
Cap rate
0.8%
Rent to Value Ratio
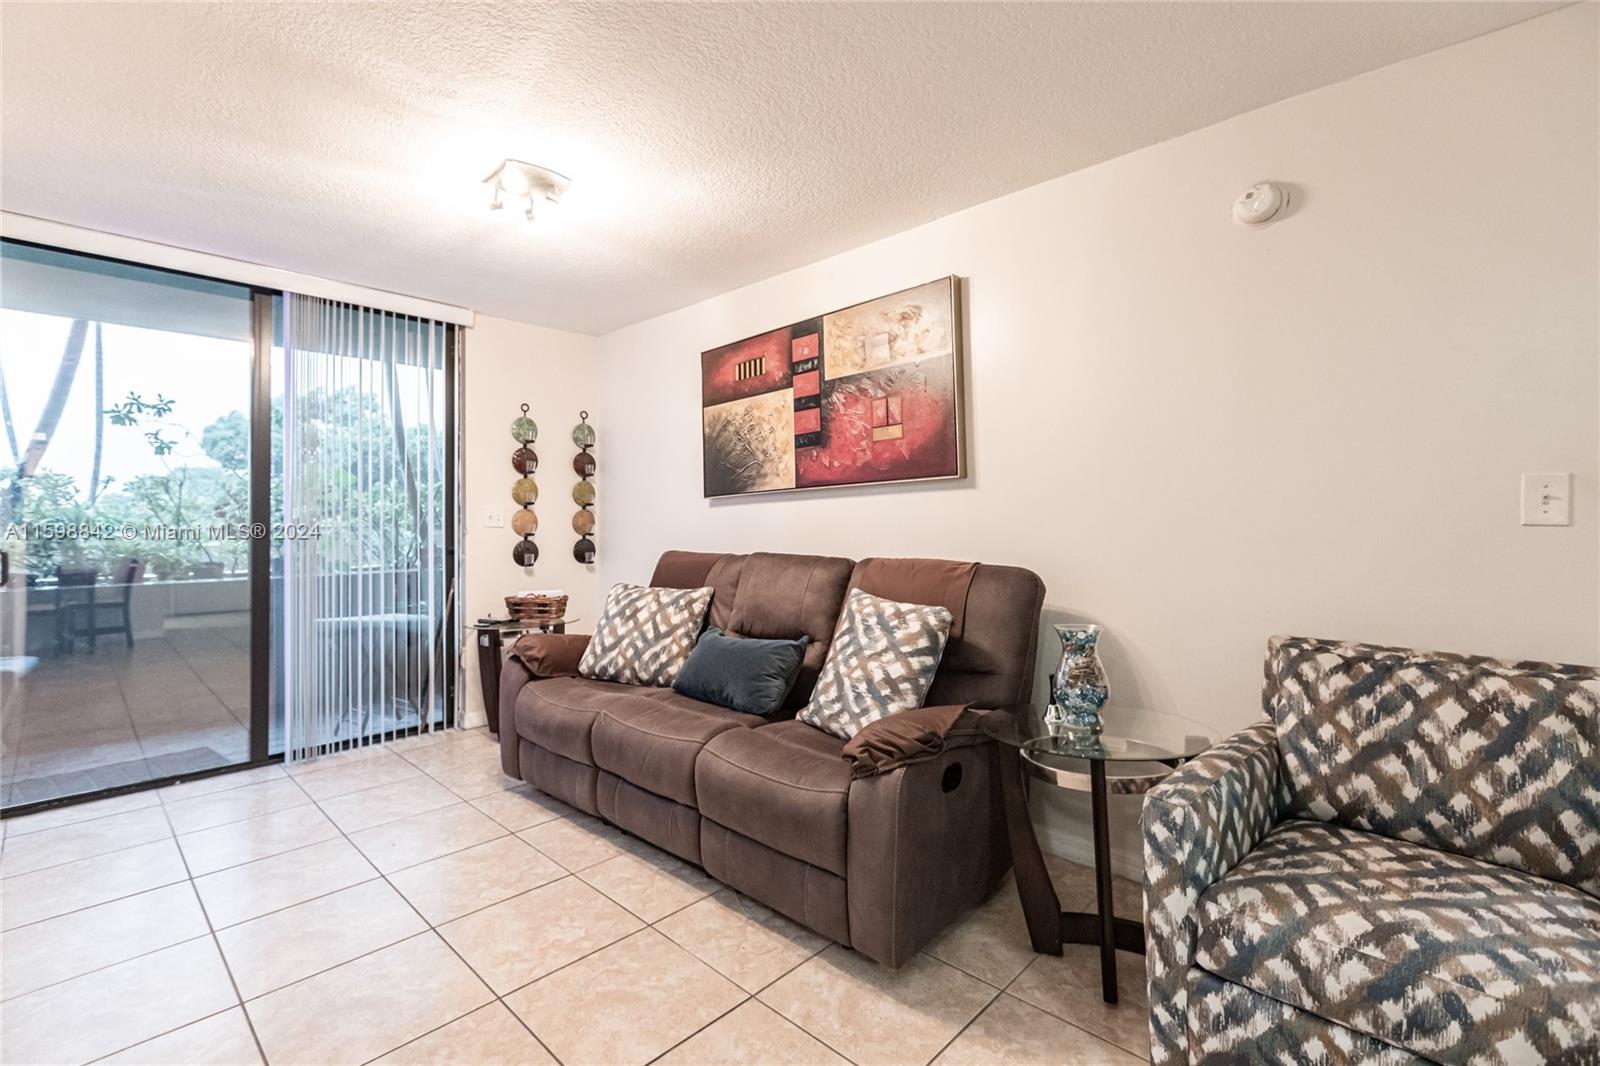
Active
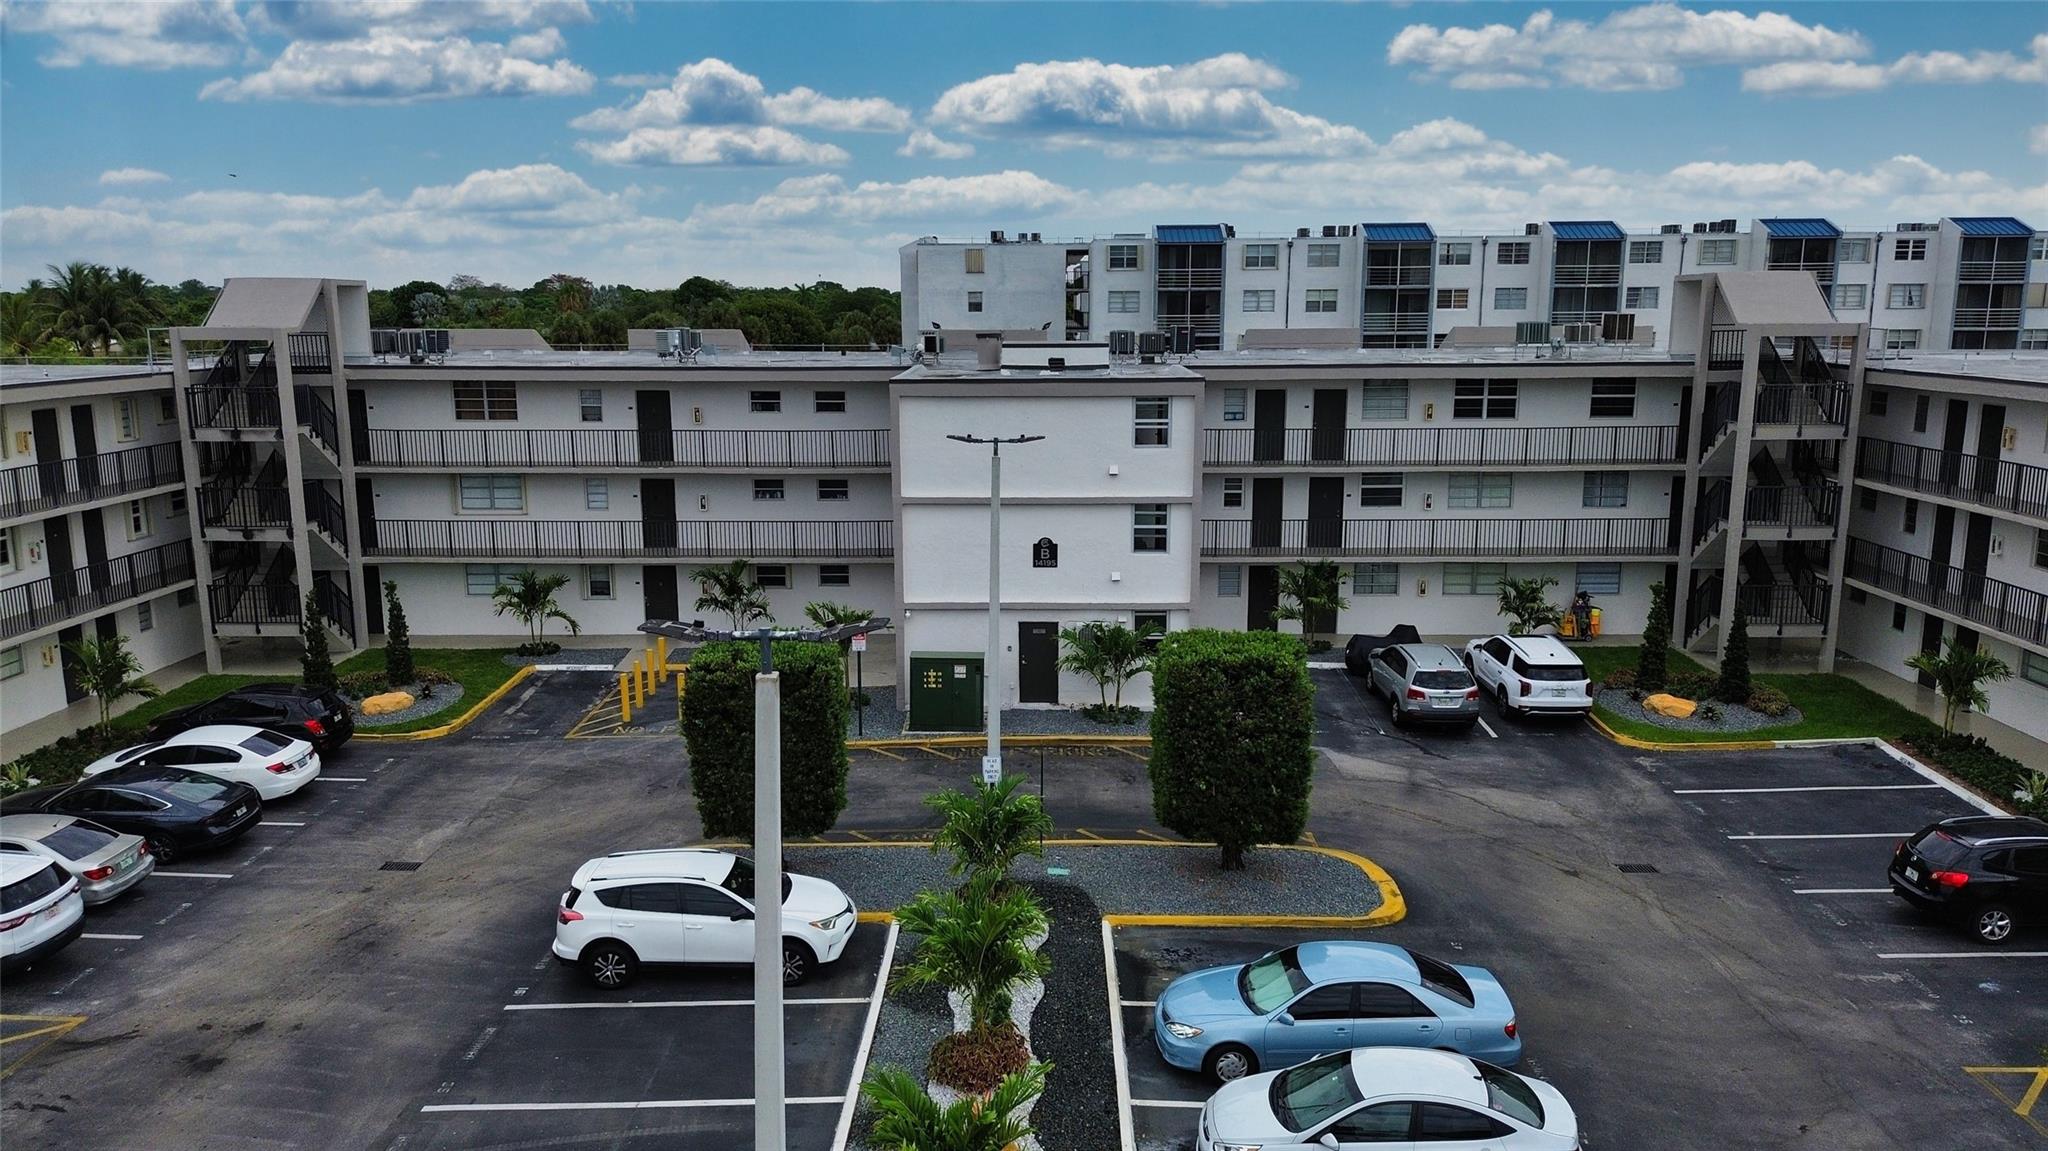
$225,000
1
bds
|
1
ba
|
725
sqft
|
built
1973
14195 SW 87th St, Miami, FL 33183
$-415
Cash flow
-9.6%
Cash-on-Cash Return
4.1%
Cap rate
0.8%
Rent to Value Ratio
6,178 out of 7,014 properties for sale in Miami, FL
Limited Results Shown
Create a free account, or log in to reveal all property listings and enjoy the complete experience.

Active
$2,395,000
4
bds
|
3
ba
|
3,090
sqft
|
built
1954
84 Shore Dr W, Miami, FL 33133
$-7,812
Cash flow
-17.0%
Cash-on-Cash Return
2.4%
Cap rate
0.4%
Rent to Value Ratio
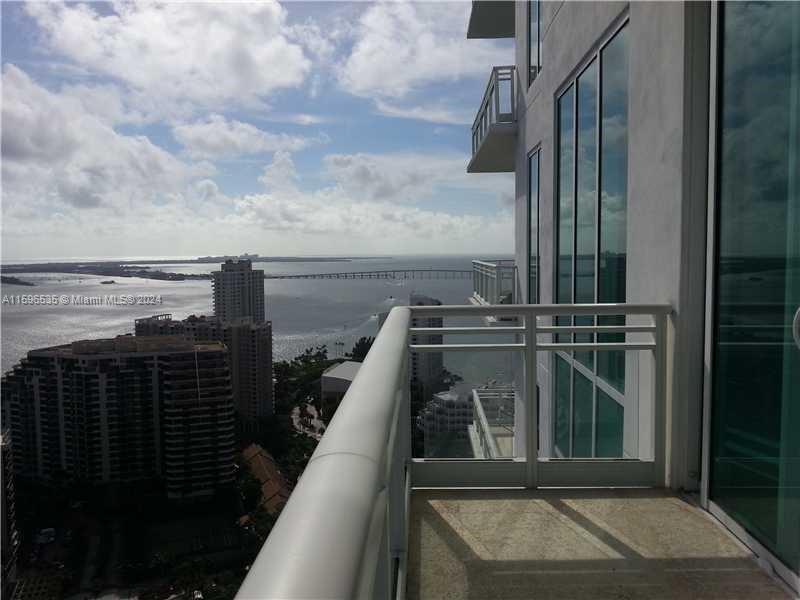
Active
$369,000
1
bds
|
1
ba
|
734
sqft
|
built
2005
275 NE 18th St, Miami, FL 33132
$-1,283
Cash flow
-18.1%
Cash-on-Cash Return
2.1%
Cap rate
0.7%
Rent to Value Ratio
Active
$497,000
1
bds
|
2
ba
|
610
sqft
|
built
2018
501 NE 31st St, Miami, FL 33137
$-2,034
Cash flow
-21.4%
Cash-on-Cash Return
1.4%
Cap rate
0.6%
Rent to Value Ratio
Active
$799,999
4
bds
|
0
ba
|
2,010
sqft
|
built
1959
2803 NW 91st St, Miami, FL 33147
$-2,882
Cash flow
-18.8%
Cash-on-Cash Return
2.0%
Cap rate
0.3%
Rent to Value Ratio
Active
$2,350,000
5
bds
|
0
ba
|
2,241
sqft
|
built
1981
3312 NW 5th Ave, Miami, FL 33127
$-7,898
Cash flow
-17.5%
Cash-on-Cash Return
2.3%
Cap rate
0.3%
Rent to Value Ratio
Active
$1,000,000
5
bds
|
2
ba
|
1,971
sqft
|
built
1946
3373 Thomas Ave, Miami, FL 33133
$-2,115
Cash flow
-11.0%
Cash-on-Cash Return
3.7%
Cap rate
0.6%
Rent to Value Ratio

Active
$7,100,000
4
bds
|
6
ba
|
4,600
sqft
|
built
2019
1000 Biscayne Blvd, Miami, FL 33132
$-49,561
Cash flow
-36.4%
Cash-on-Cash Return
-2.1%
Cap rate
0.1%
Rent to Value Ratio
Active
$819,900
5
bds
|
3
ba
|
1,704
sqft
|
built
1959
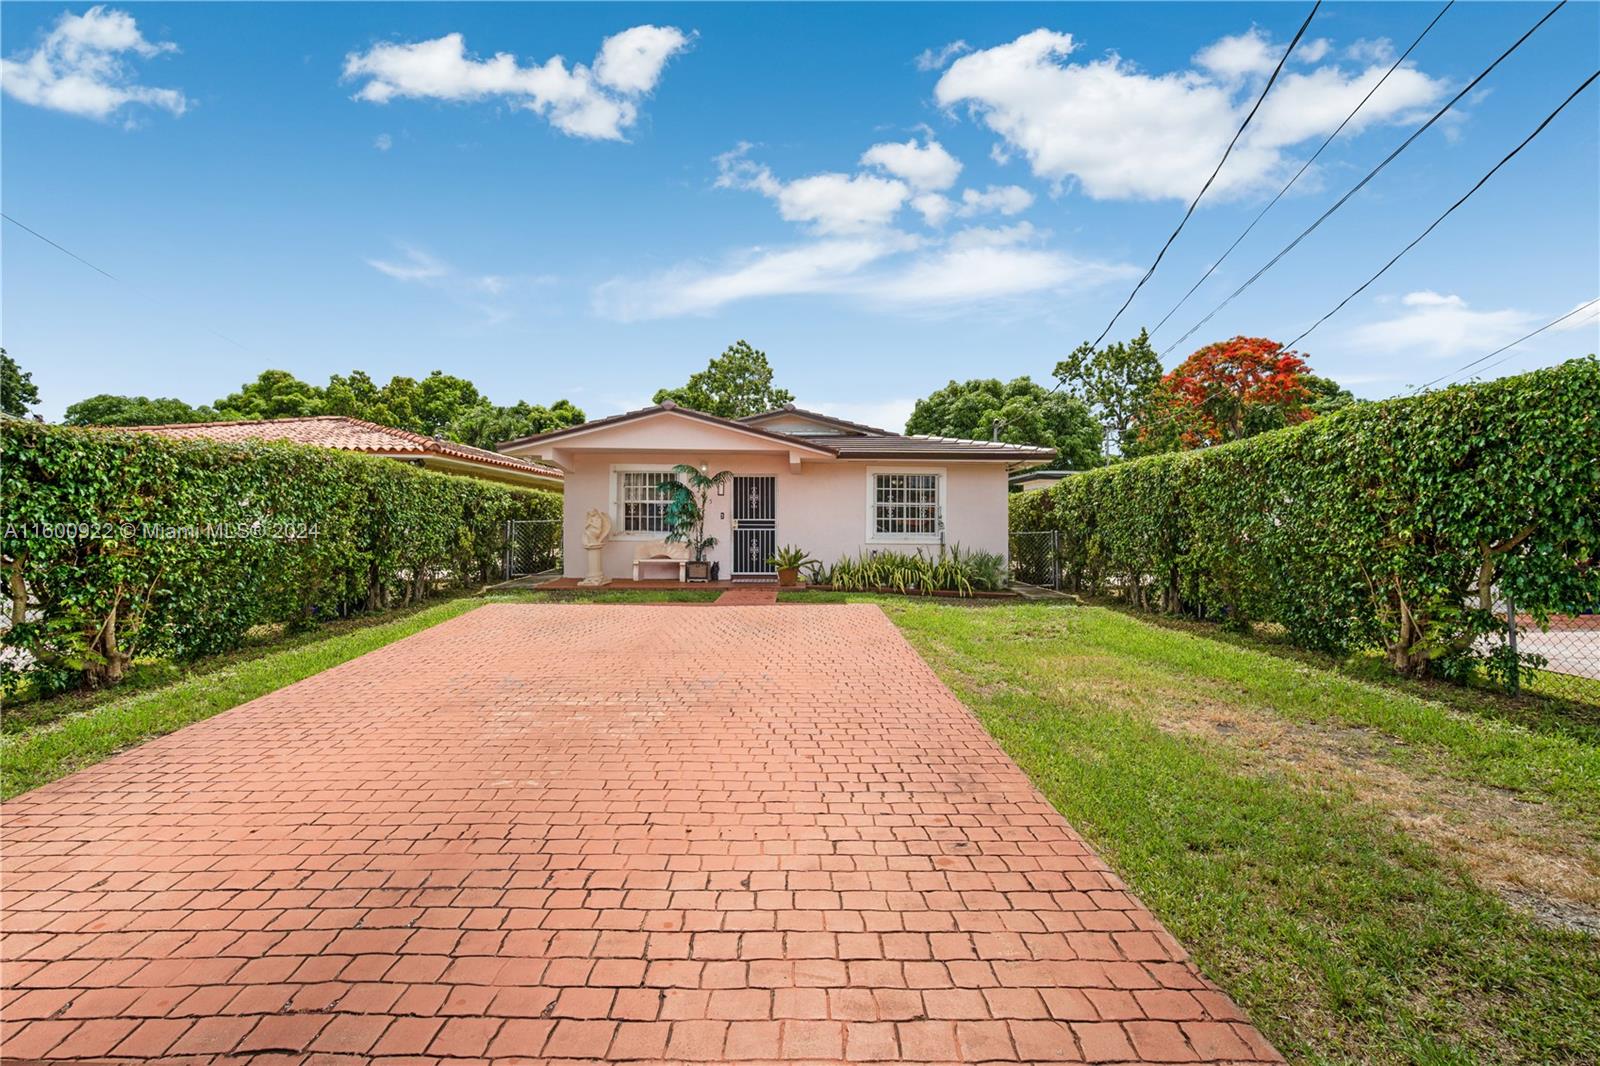
2901 SW 92nd Ave, Miami, FL 33165
$-1,440
Cash flow
-9.2%
Cash-on-Cash Return
4.2%
Cap rate
0.6%
Rent to Value Ratio
Active
$220,000
1
bds
|
1
ba
|
0
sqft
|
built
1968
4250 SW 67th Ave, Miami, FL 33155
$-476
Cash flow
-11.3%
Cash-on-Cash Return
3.7%
Cap rate
0.8%
Rent to Value Ratio
Active
$330,000
1
bds
|
1
ba
|
768
sqft
|
built
2007
1690 SW 27th Ave, Miami, FL 33145
$-1,169
Cash flow
-18.5%
Cash-on-Cash Return
2.0%
Cap rate
0.7%
Rent to Value Ratio
Active
$4,000,000
4
bds
|
6
ba
|
3,398
sqft
|
built
2008
900 Brickell Key Blvd, Miami, FL 33131
$-24,251
Cash flow
-31.6%
Cash-on-Cash Return
-1.0%
Cap rate
0.3%
Rent to Value Ratio
Active
$580,000
2
bds
|
2
ba
|
1,640
sqft
|
built
1981
1541 Brickell Ave, Miami, FL 33129
$-3,036
Cash flow
-27.3%
Cash-on-Cash Return
0.0%
Cap rate
0.9%
Rent to Value Ratio

Active
$1,250,000
3
bds
|
3
ba
|
1,795
sqft
|
built
2008
253 NE 2nd St, Miami, FL 33132
$-5,907
Cash flow
-24.7%
Cash-on-Cash Return
0.6%
Cap rate
0.5%
Rent to Value Ratio
Active
$7,200,000
4
bds
|
6
ba
|
4,600
sqft
|
built
2019
1000 Biscayne Blvd, Miami, FL 33132
$-50,000
Cash flow
-36.2%
Cash-on-Cash Return
-2.0%
Cap rate
0.1%
Rent to Value Ratio

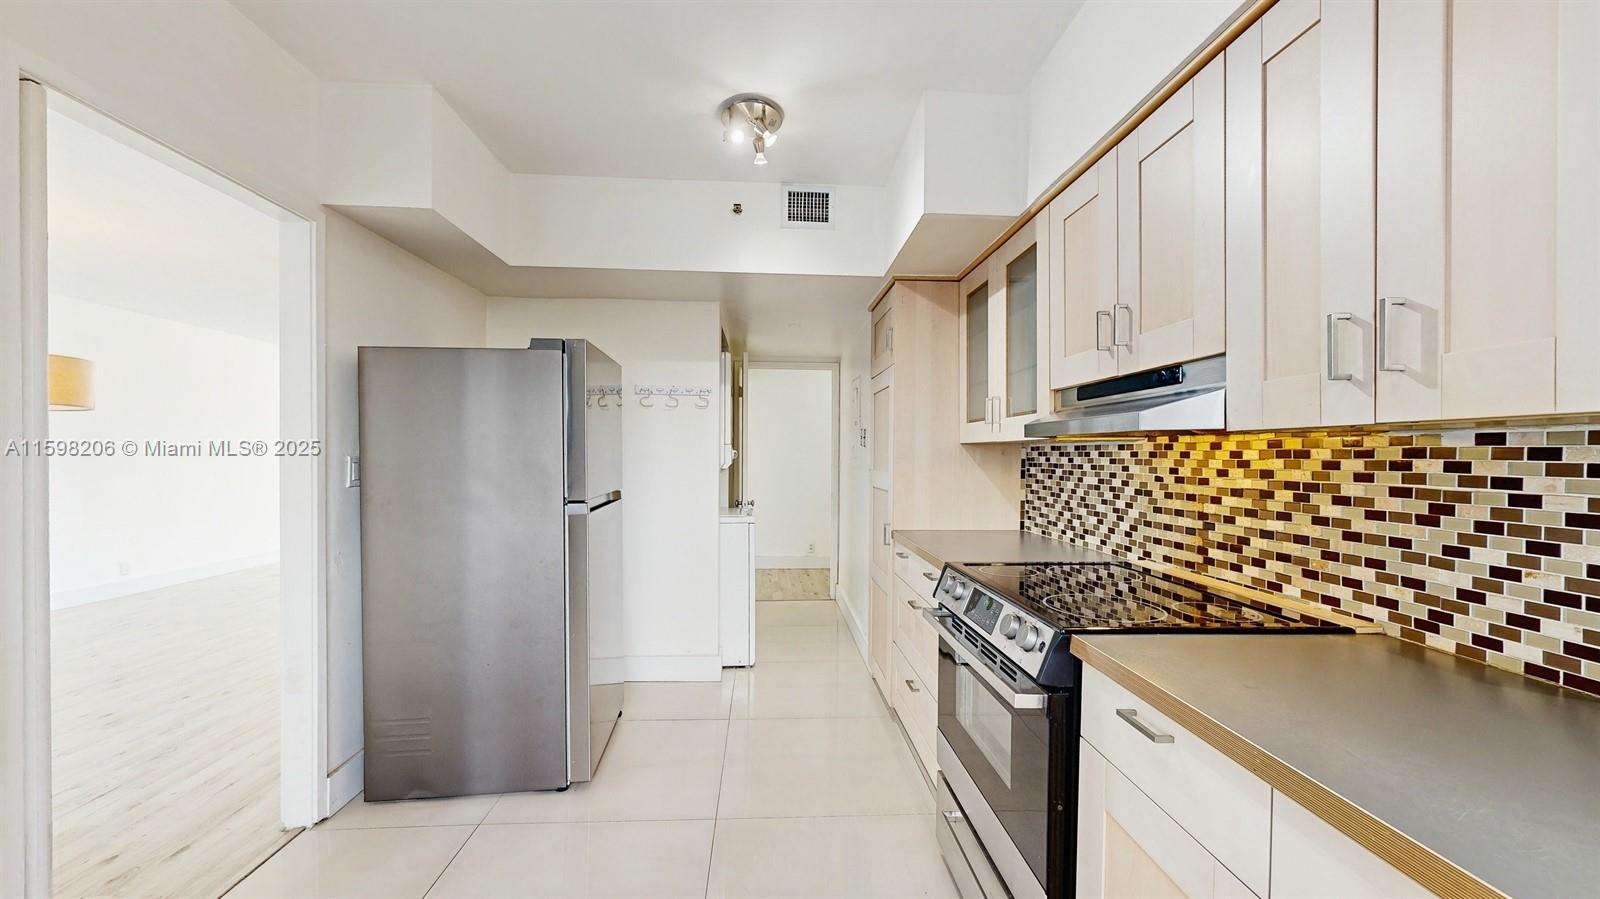
Active
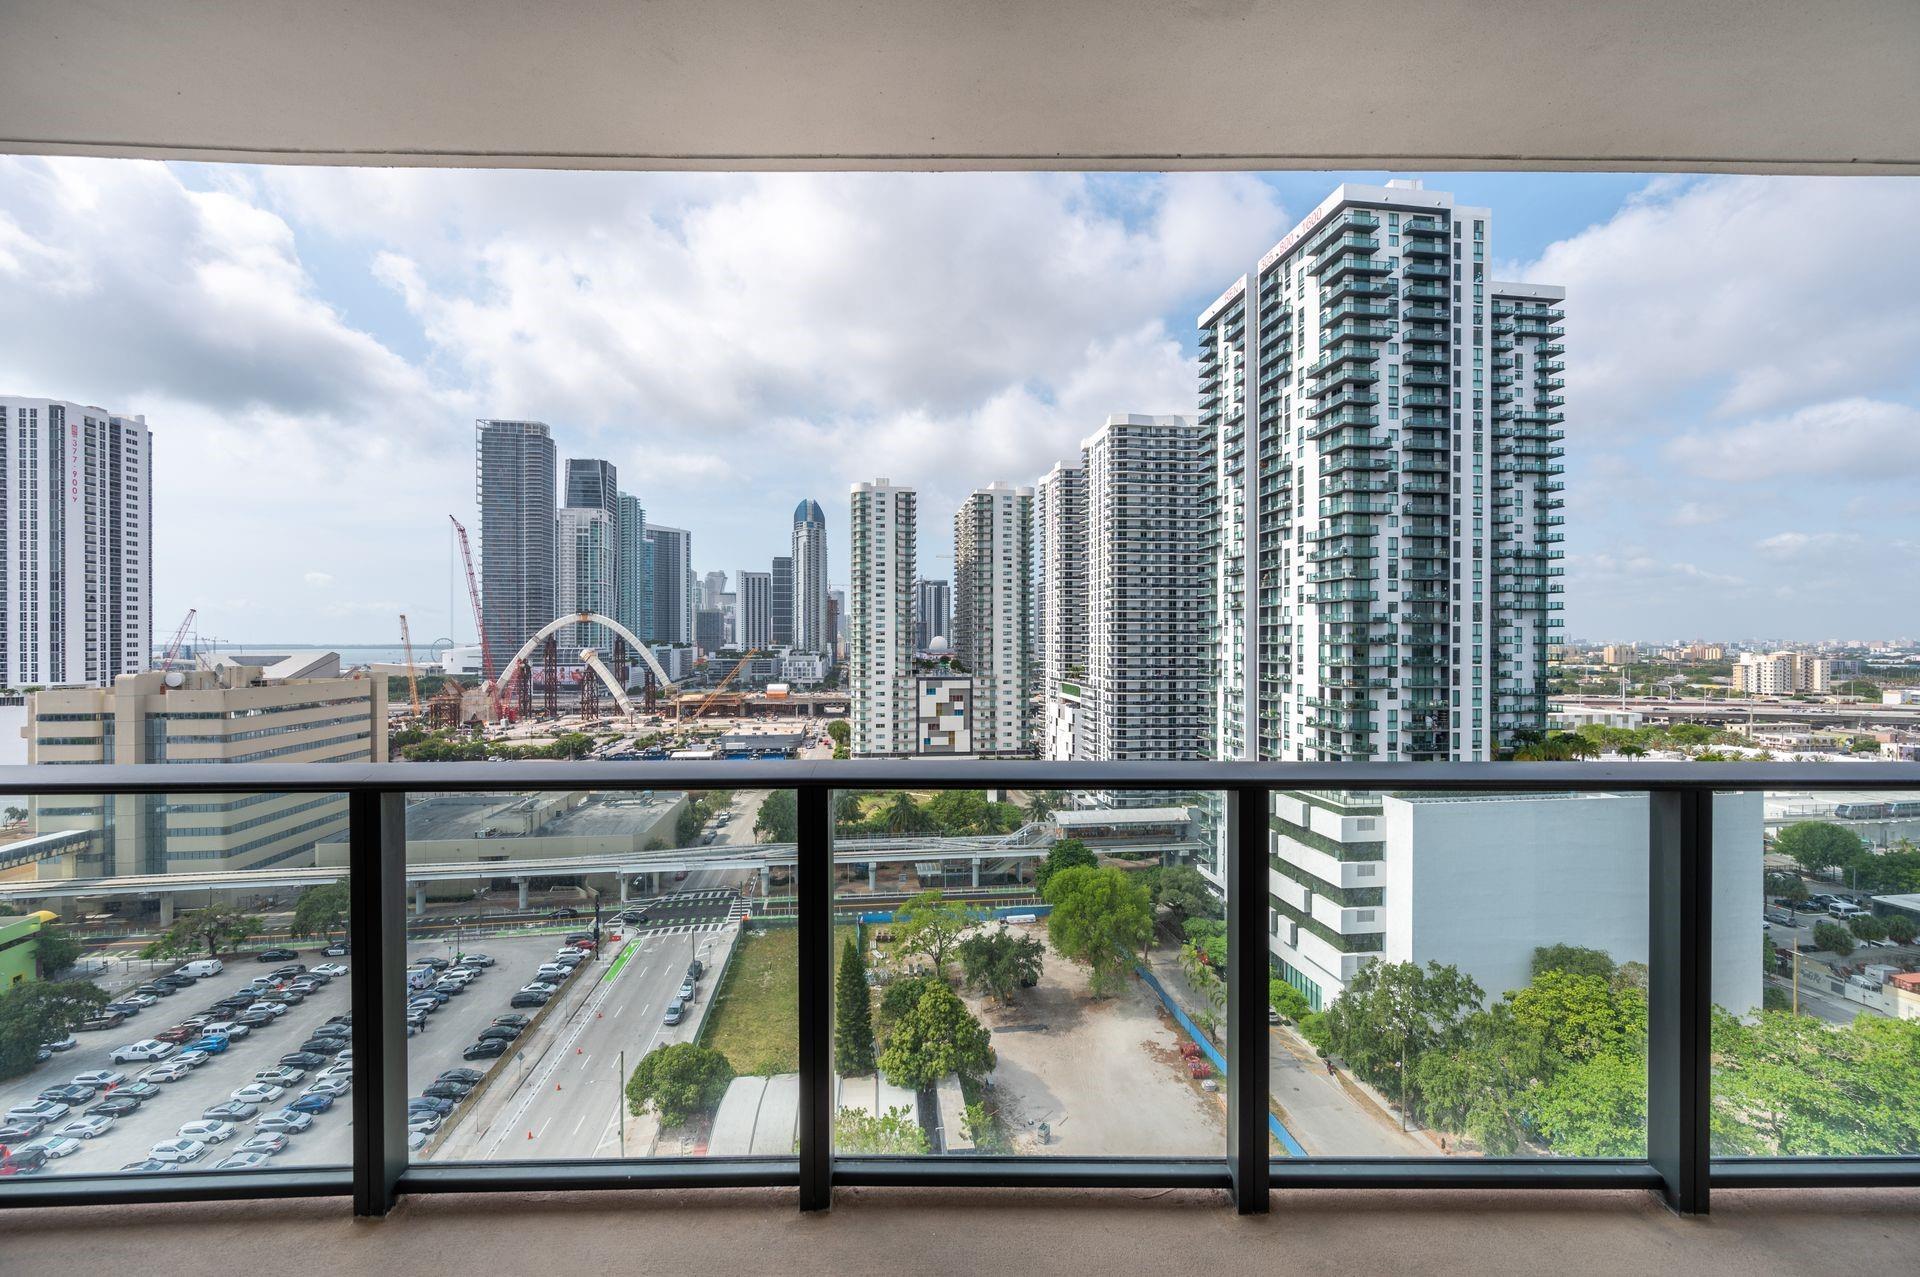
$639,000
bds
|
1
ba
|
1,176
sqft
|
built
2007
3250 NE 1st Ave, Miami, FL 33137
$-2,573
Cash flow
-21.0%
Cash-on-Cash Return
1.5%
Cap rate
0.6%
Rent to Value Ratio
Active
$694,500
2
bds
|
2
ba
|
1,262
sqft
|
built
2008
3301 NE 1st Ave, Miami, FL 33137
$-2,951
Cash flow
-22.2%
Cash-on-Cash Return
1.2%
Cap rate
0.6%
Rent to Value Ratio
Active
$870,000
3
bds
|
3
ba
|
1,505
sqft
|
built
2015
600 NE 27th St, Miami, FL 33137
$-1,652
Cash flow
-9.9%
Cash-on-Cash Return
4.0%
Cap rate
0.7%
Rent to Value Ratio
Active
$1,255,000
3
bds
|
4
ba
|
1,526
sqft
|
built
2018
3131 NE 7th Ave, Miami, FL 33137
$-5,077
Cash flow
-21.1%
Cash-on-Cash Return
1.4%
Cap rate
0.6%
Rent to Value Ratio

Active
$465,000
1
bds
|
2
ba
|
860
sqft
|
built
1980
555 NE 15th St, Miami, FL 33132
$-1,586
Cash flow
-17.8%
Cash-on-Cash Return
2.2%
Cap rate
0.8%
Rent to Value Ratio
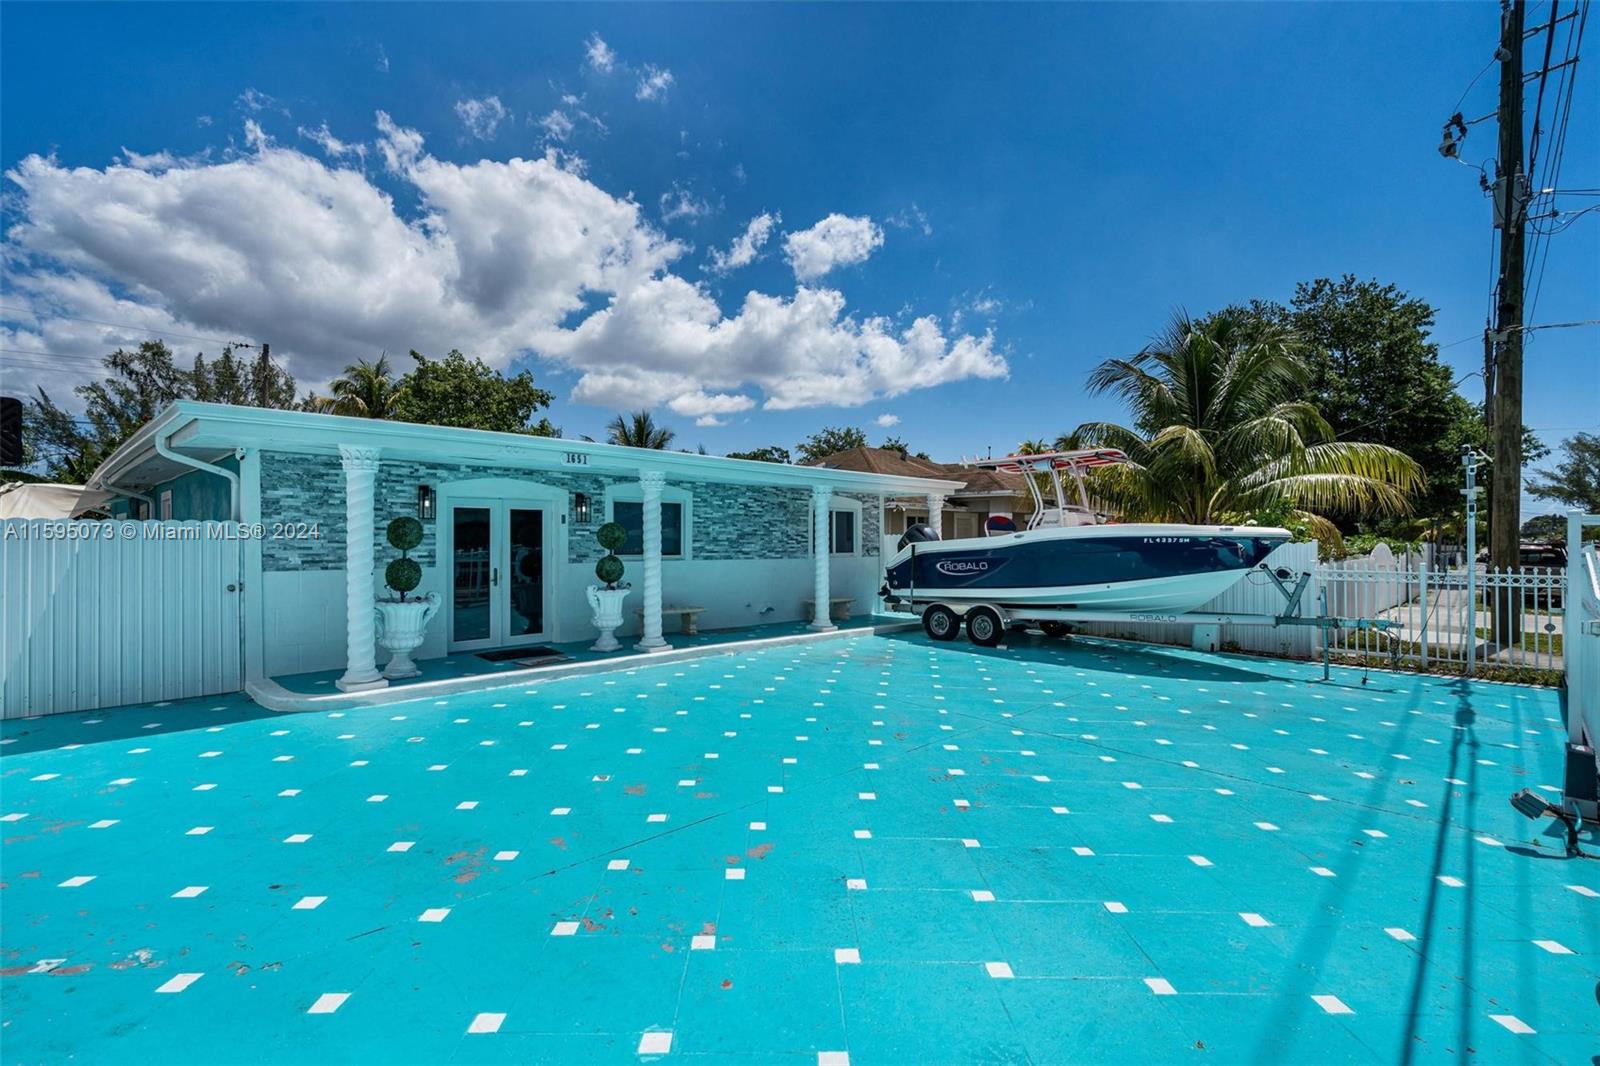
Active
$860,000
4
bds
|
3
ba
|
1,908
sqft
|
built
1957
1651 NW 111th St, Miami, FL 33167
$-1,300
Cash flow
-7.9%
Cash-on-Cash Return
4.5%
Cap rate
0.6%
Rent to Value Ratio
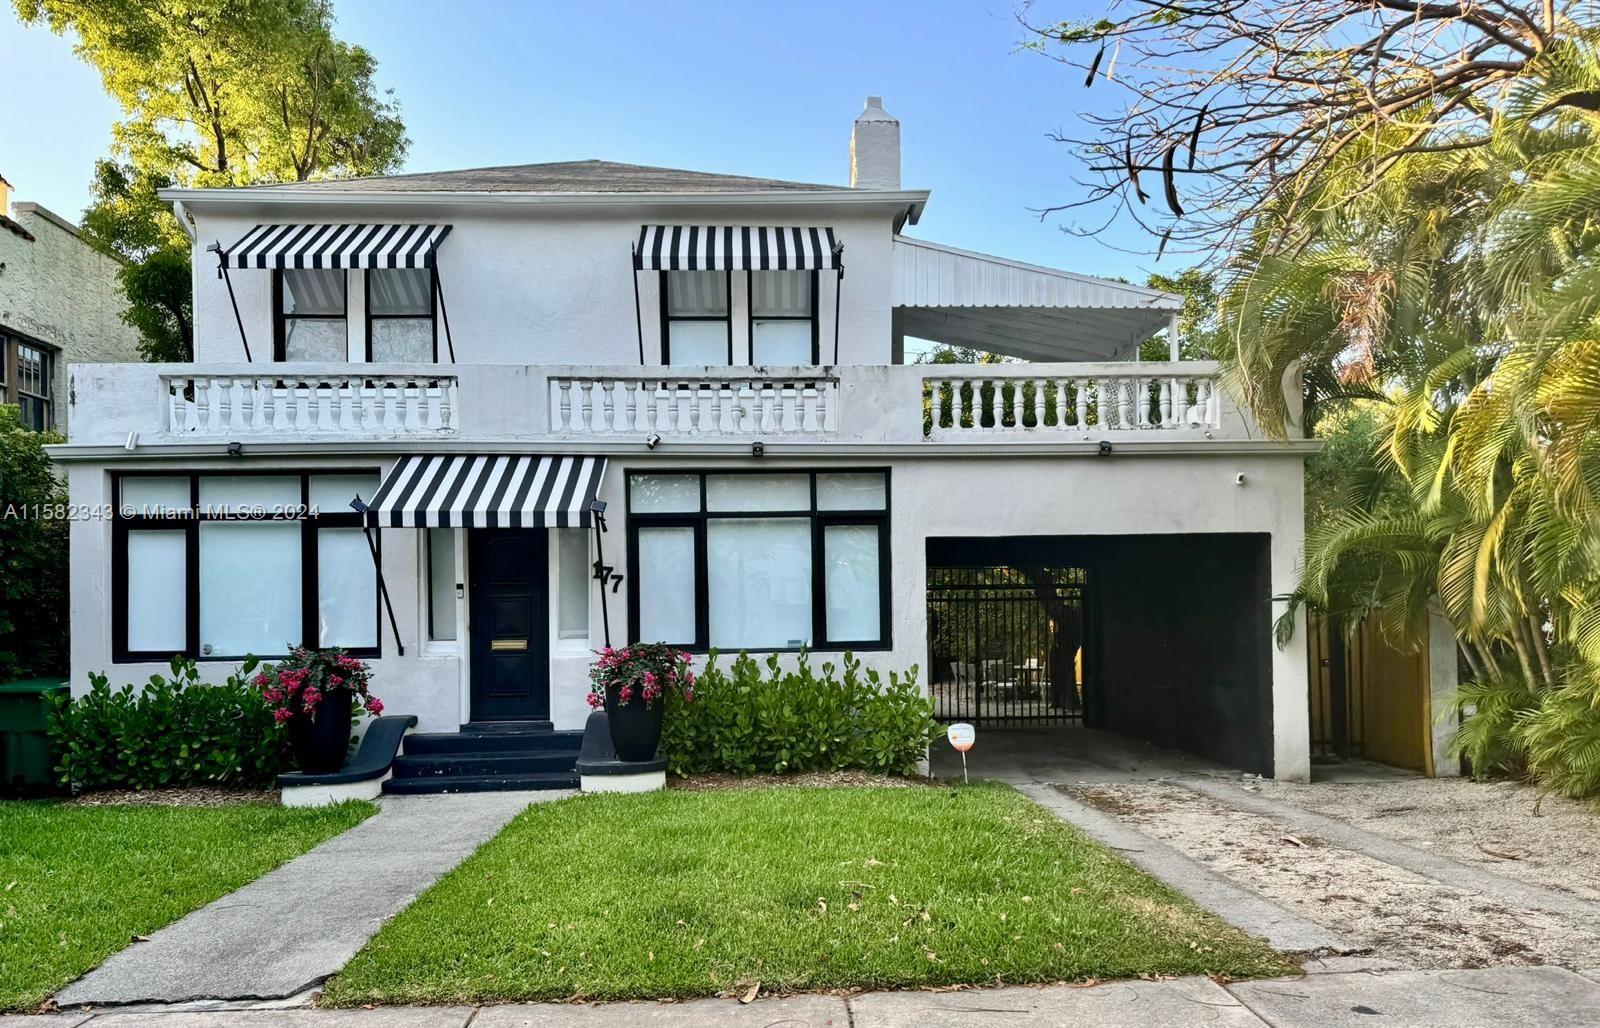
Active
$1,550,000
4
bds
|
2
ba
|
2,080
sqft
|
built
1924
177 NE 44th St, Miami, FL 33137
$-4,709
Cash flow
-15.9%
Cash-on-Cash Return
2.6%
Cap rate
0.4%
Rent to Value Ratio
Active
$445,000
3
bds
|
3
ba
|
1,518
sqft
|
built
1988
2050 SW 122nd Ave, Miami, FL 33175
$-1,371
Cash flow
-16.1%
Cash-on-Cash Return
2.6%
Cap rate
0.7%
Rent to Value Ratio
Active
$225,000
1
bds
|
1
ba
|
725
sqft
|
built
1973
14195 SW 87th St, Miami, FL 33183
$-415
Cash flow
-9.6%
Cash-on-Cash Return
4.1%
Cap rate
0.8%
Rent to Value Ratio
Active
$645,000
1
bds
|
2
ba
|
792
sqft
|
built
2017
45 SW 9th St, Miami, FL 33130
$-2,104
Cash flow
-17.0%
Cash-on-Cash Return
2.4%
Cap rate
0.7%
Rent to Value Ratio
Active
$1,399,000
6
bds
|
5
ba
|
3,222
sqft
|
built
1986
3024 SW 98th Ct, Miami, FL 33165
$-4,584
Cash flow
-17.1%
Cash-on-Cash Return
2.4%
Cap rate
0.4%
Rent to Value Ratio
Active
$849,900
3
bds
|
0
ba
|
2,056
sqft
|
built
1963
880 NW 26th Ave, Miami, FL 33125
$-3,639
Cash flow
-22.3%
Cash-on-Cash Return
1.1%
Cap rate
0.3%
Rent to Value Ratio
Active
$269,000
2
bds
|
2
ba
|
968
sqft
|
built
1971
8850 Fontainebleau Blvd, Miami, FL 33172
$-458
Cash flow
-8.9%
Cash-on-Cash Return
4.2%
Cap rate
0.8%
Rent to Value Ratio
Active
$850,000
3
bds
|
2
ba
|
2,112
sqft
|
built
1950
200 SW 61st Ave, Miami, FL 33144
$-1,372
Cash flow
-8.4%
Cash-on-Cash Return
4.3%
Cap rate
0.6%
Rent to Value Ratio
Active
$850,000
3
bds
|
2
ba
|
1,500
sqft
|
built
1990
2245 SW 62nd Ave, Miami, FL 33155
$-2,387
Cash flow
-14.7%
Cash-on-Cash Return
2.9%
Cap rate
0.5%
Rent to Value Ratio
Active
$568,000
2
bds
|
2
ba
|
880
sqft
|
built
2018
1600 SW 1st Ave, Miami, FL 33129
$-2,056
Cash flow
-18.9%
Cash-on-Cash Return
1.9%
Cap rate
0.6%
Rent to Value Ratio
Active
$750,000
2
bds
|
3
ba
|
1,540
sqft
|
built
2007
185 SW 7th St, Miami, FL 33130
$-3,179
Cash flow
-22.1%
Cash-on-Cash Return
1.2%
Cap rate
0.5%
Rent to Value Ratio

Active
$325,000
1
bds
|
1
ba
|
446
sqft
|
built
2016
151 SE 1st St, Miami, FL 33131
$-1,068
Cash flow
-17.1%
Cash-on-Cash Return
2.3%
Cap rate
0.7%
Rent to Value Ratio

Active
$250,000
2
bds
|
2
ba
|
985
sqft
|
built
1983
8415 SW 107th Ave, Miami, FL 33173
$-418
Cash flow
-8.7%
Cash-on-Cash Return
4.3%
Cap rate
1.0%
Rent to Value Ratio
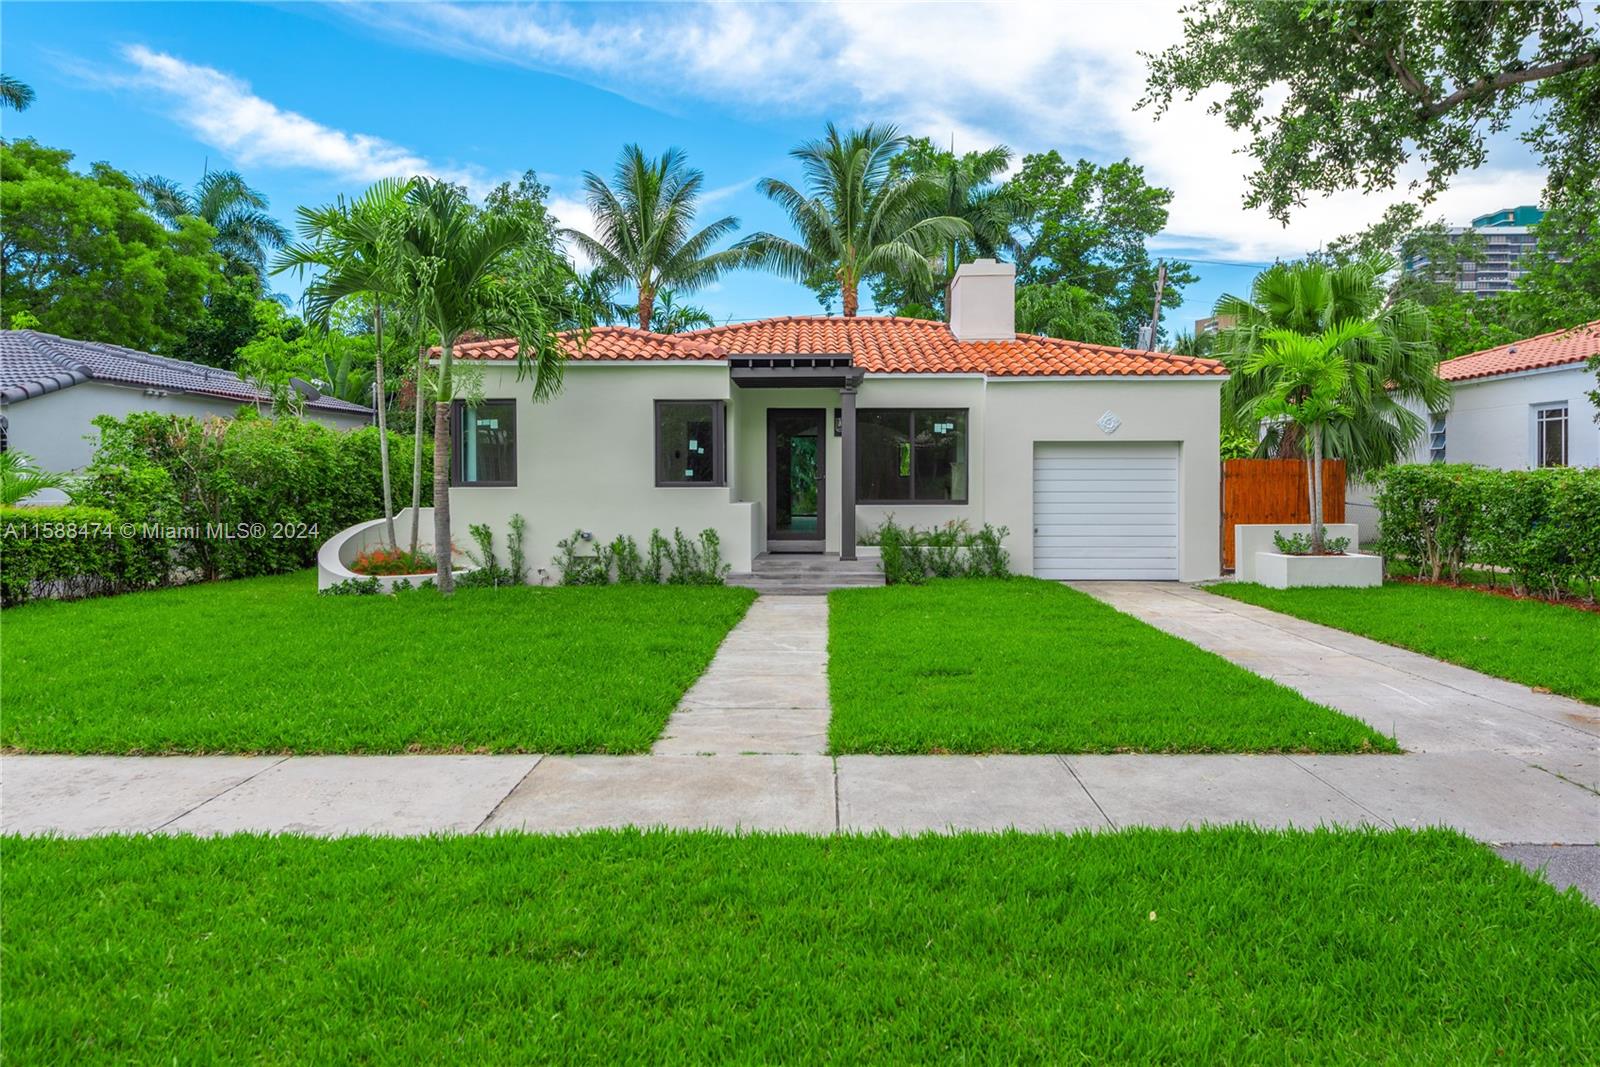
Active
$1,539,000
3
bds
|
2
ba
|
1,520
sqft
|
built
1941
890 NE 72nd Ter, Miami, FL 33138
$-5,082
Cash flow
-17.2%
Cash-on-Cash Return
2.3%
Cap rate
0.4%
Rent to Value Ratio
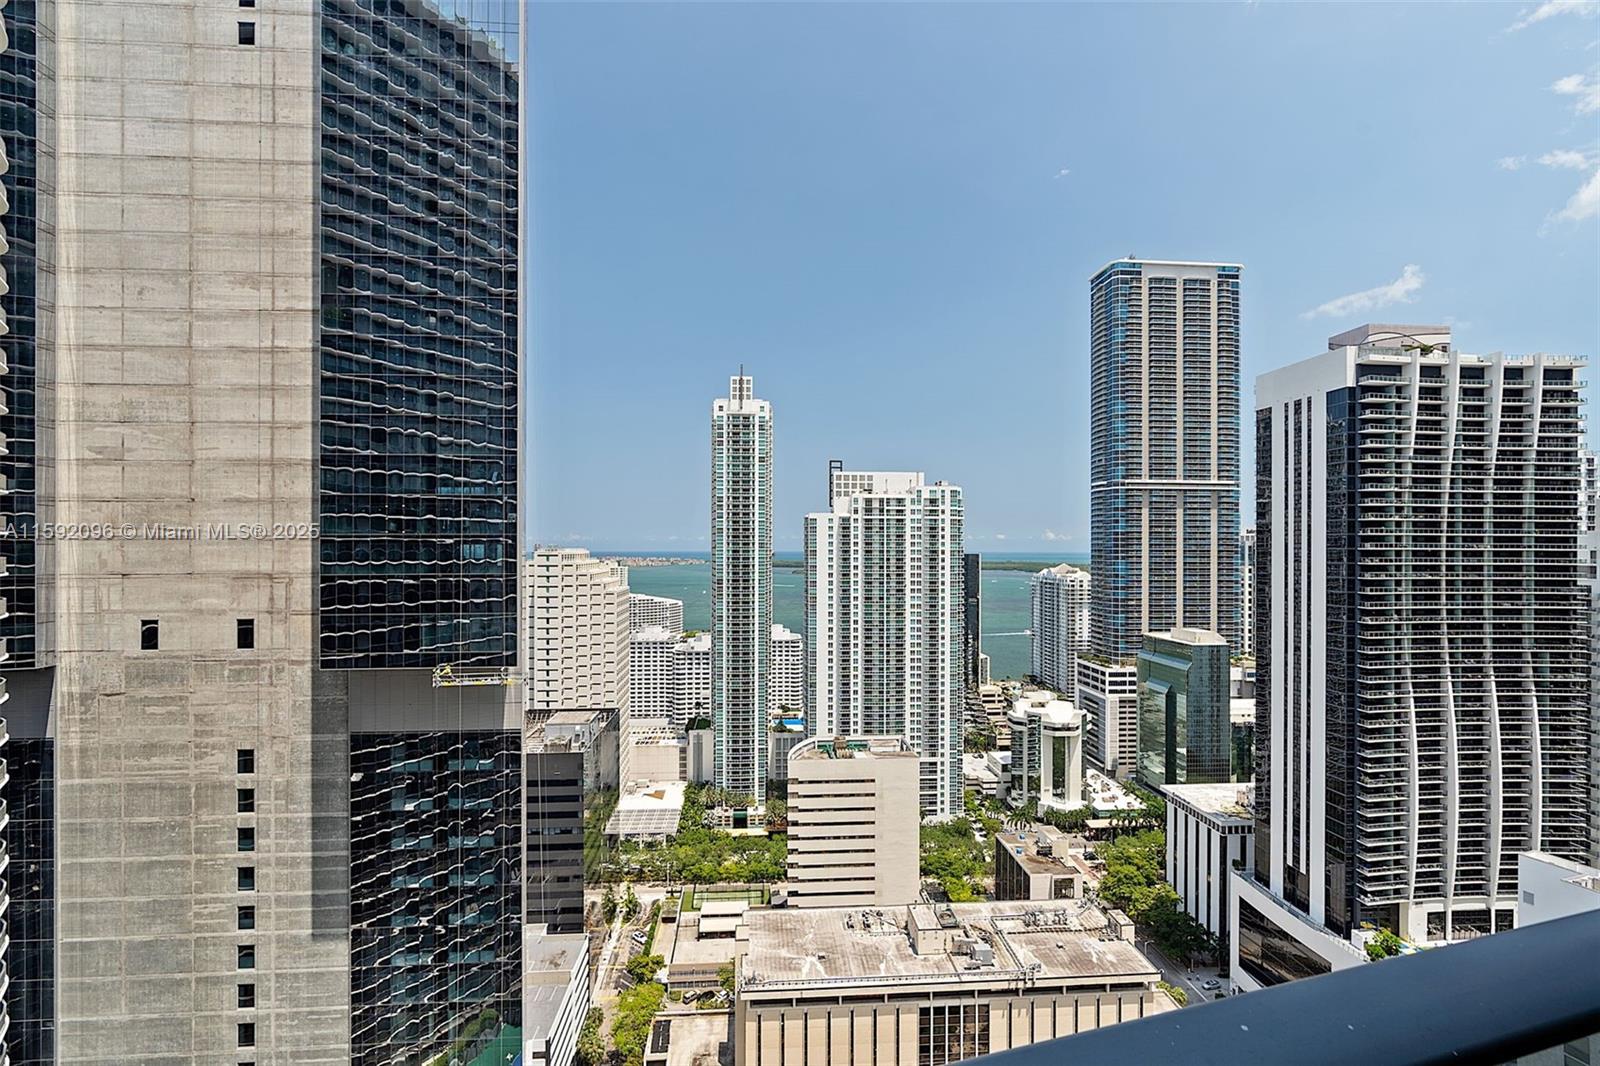
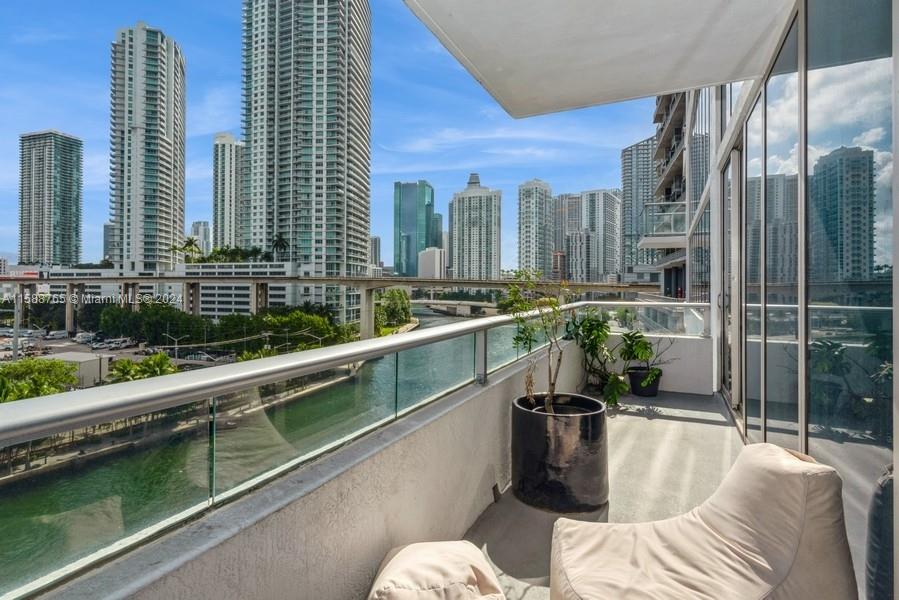
Active
$599,000
2
bds
|
2
ba
|
1,048
sqft
|
built
2007
1750 N Bayshore Dr, Miami, FL 33132
$-3,241
Cash flow
-28.2%
Cash-on-Cash Return
-0.2%
Cap rate
0.6%
Rent to Value Ratio
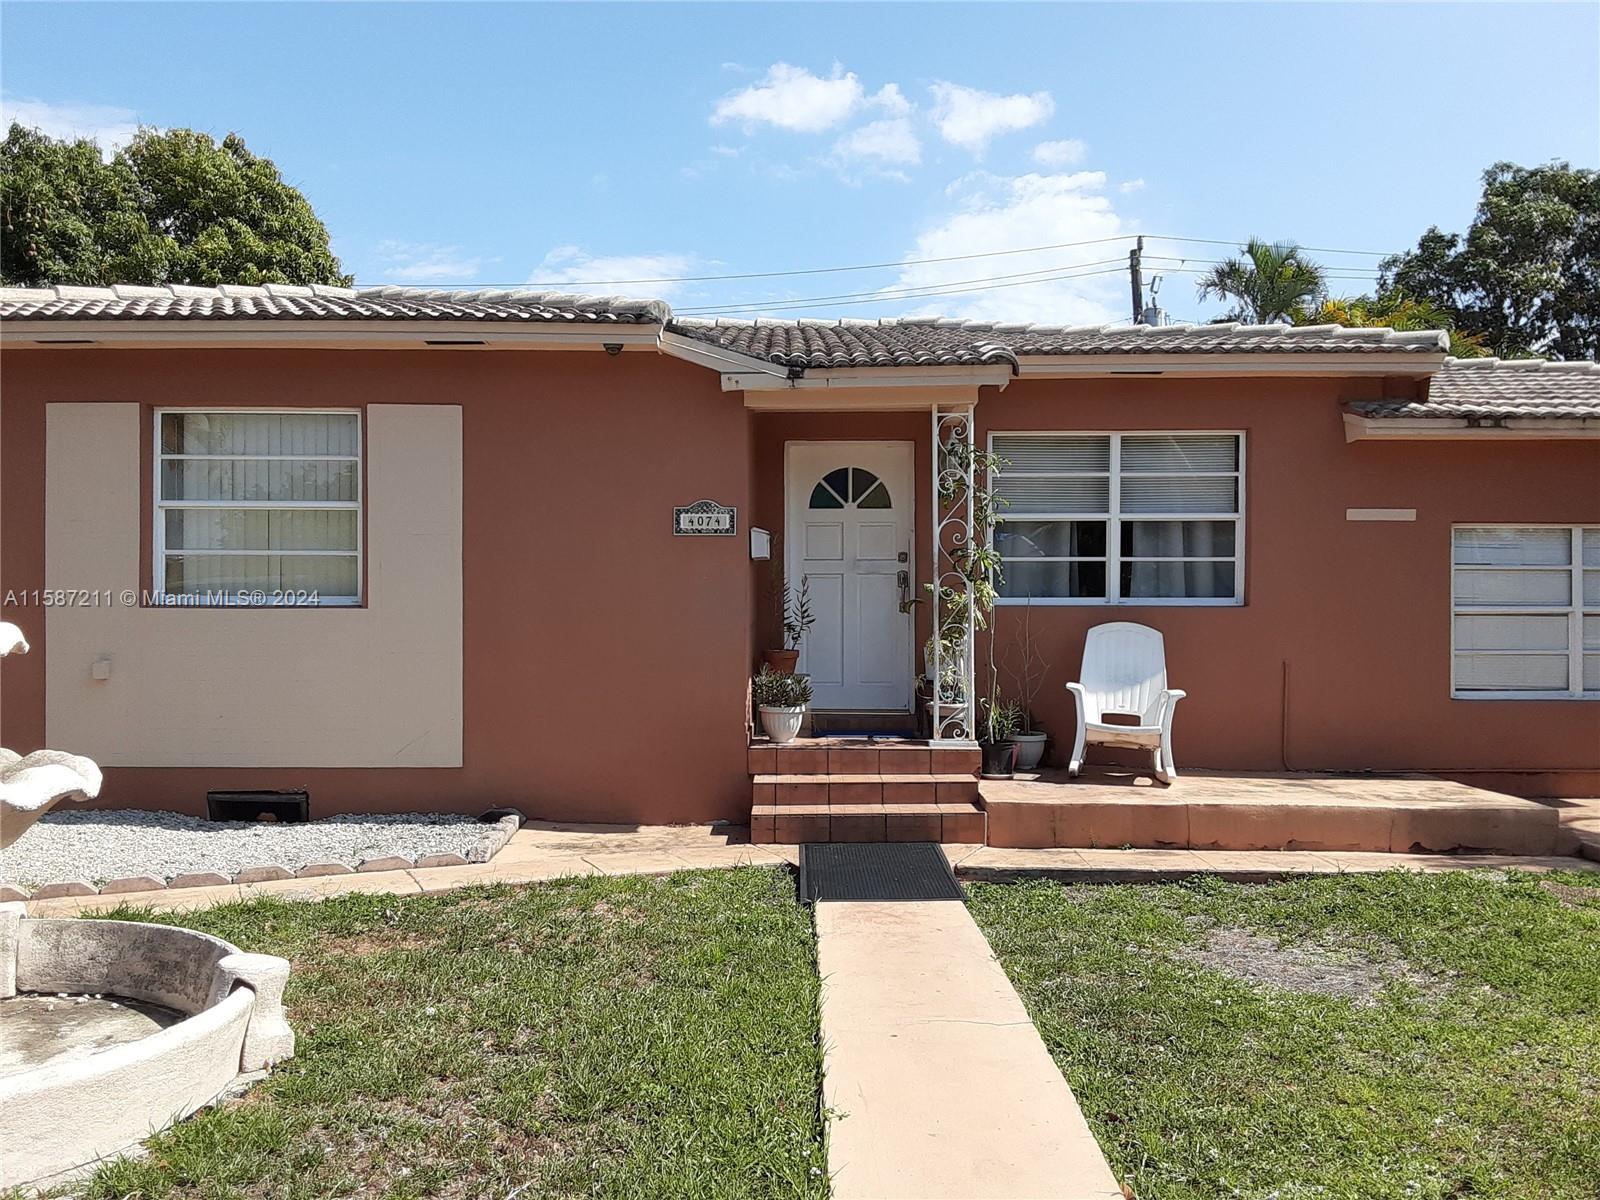
Active
$650,000
2
bds
|
2
ba
|
1,506
sqft
|
built
1947
4074 NW 4th St, Miami, FL 33126
$-1,599
Cash flow
-12.8%
Cash-on-Cash Return
3.3%
Cap rate
0.6%
Rent to Value Ratio
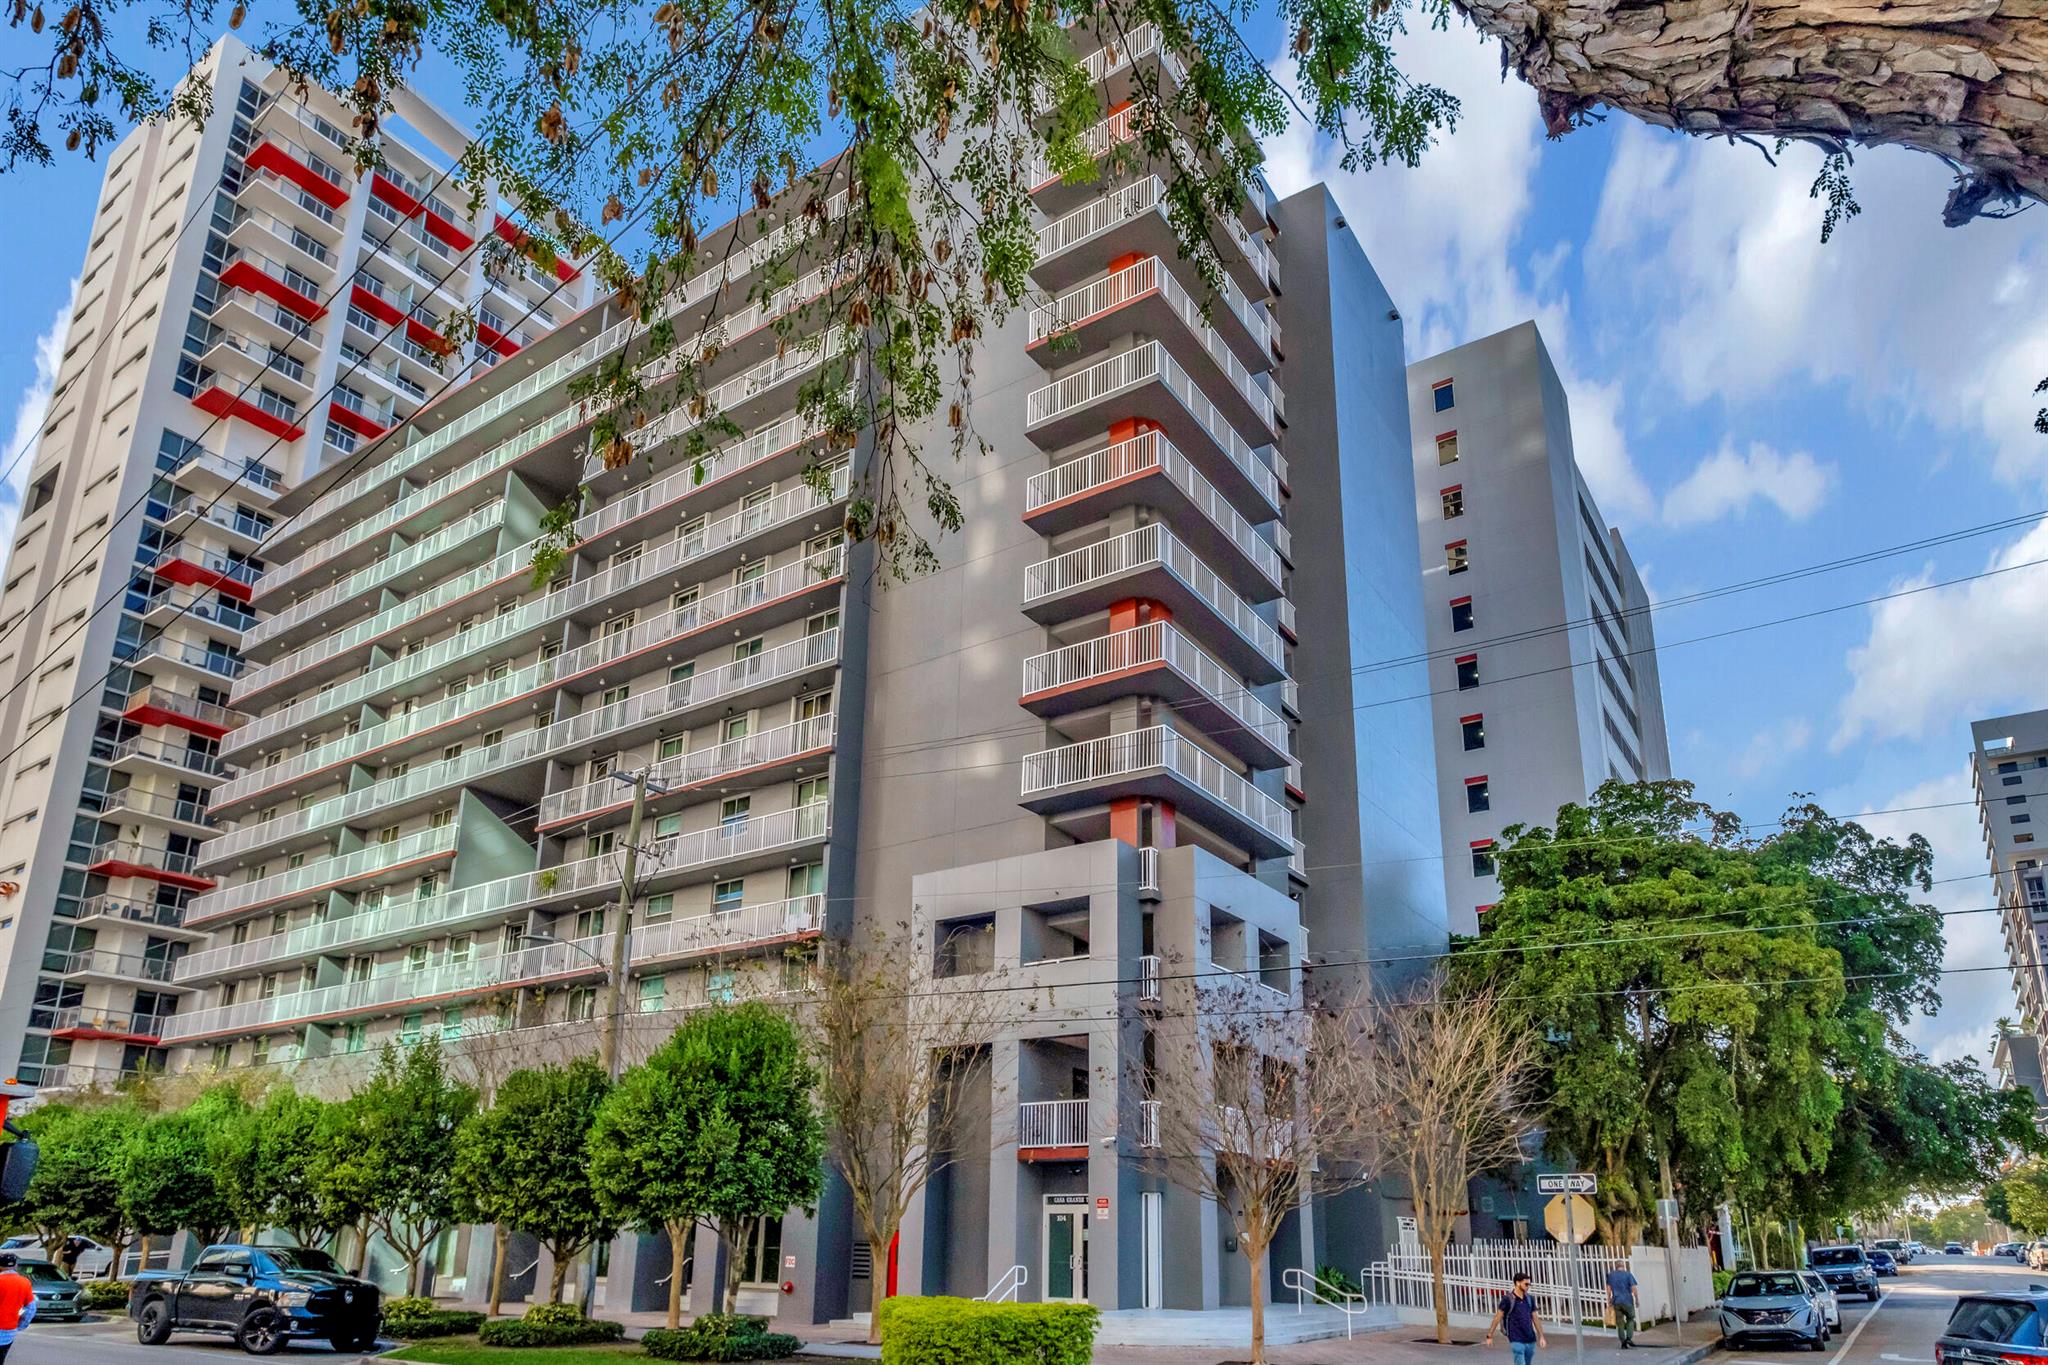
Active
$545,000
3
bds
|
2
ba
|
1,050
sqft
|
built
1999
104 SW 9th St, Miami, FL 33130
$-1,173
Cash flow
-11.2%
Cash-on-Cash Return
3.7%
Cap rate
0.6%
Rent to Value Ratio
Active
$1,199,000
5
bds
|
2
ba
|
2,014
sqft
|
built
1957
19321 NE 18th Pl, Miami, FL 33179
$-1,757
Cash flow
-7.6%
Cash-on-Cash Return
4.5%
Cap rate
0.6%
Rent to Value Ratio
Active
$775,000
2
bds
|
2
ba
|
1,073
sqft
|
built
2015
460 NE 28th St, Miami, FL 33137
$-2,176
Cash flow
-14.6%
Cash-on-Cash Return
2.9%
Cap rate
0.7%
Rent to Value Ratio
Active
$215,000
1
bds
|
1
ba
|
801
sqft
|
built
1969
1351 NE Miami Gardens Dr, Miami, FL 33179
$-392
Cash flow
-9.5%
Cash-on-Cash Return
4.1%
Cap rate
0.8%
Rent to Value Ratio