Miami, FL Investment Properties for Sale
Browse homes for sale and investment properties in Miami, FL. Refine your search by price, property type, or more.
Best cash flowing properties in Miami, FL
Active
$500,000
3
bds
|
3
ba
|
1,360
sqft
|
built
2021
2561 NE 193rd St, Miami, FL 33180
$-180
Cash flow
-1.9%
Cash-on-Cash Return
5.7%
Cap rate
0.7%
Rent to Value Ratio
Active
$260,000
2
bds
|
2
ba
|
1,170
sqft
|
built
1982
5900 SW 127th Ave, Miami, FL 33183
$-398
Cash flow
-8.0%
Cash-on-Cash Return
4.3%
Cap rate
1.0%
Rent to Value Ratio
6,178 out of 7,014 properties for sale in Miami, FL
Limited Results Shown
Create a free account, or log in to reveal all property listings and enjoy the complete experience.
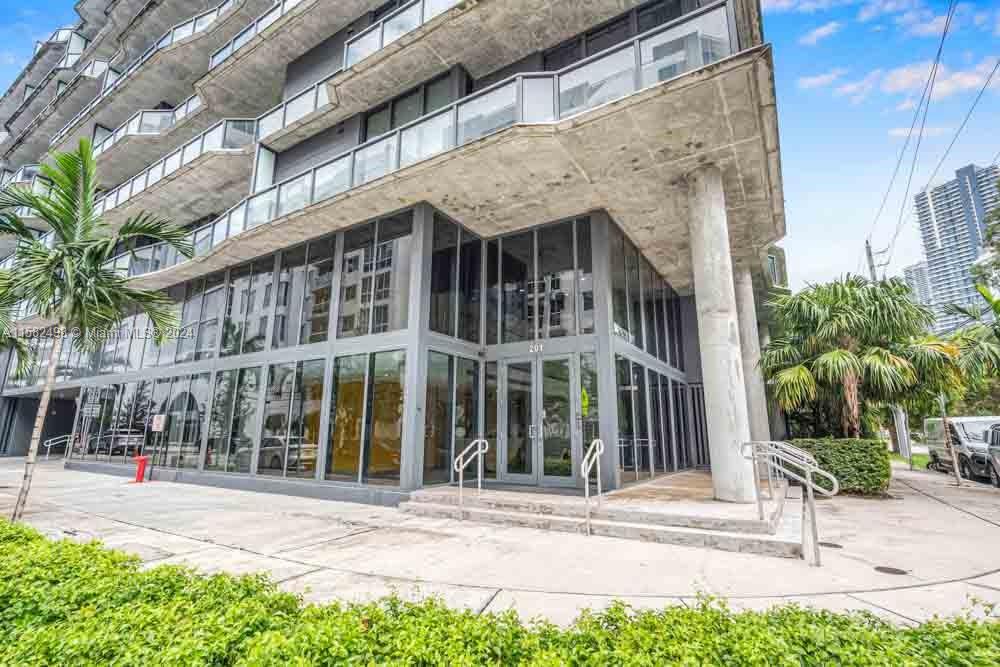
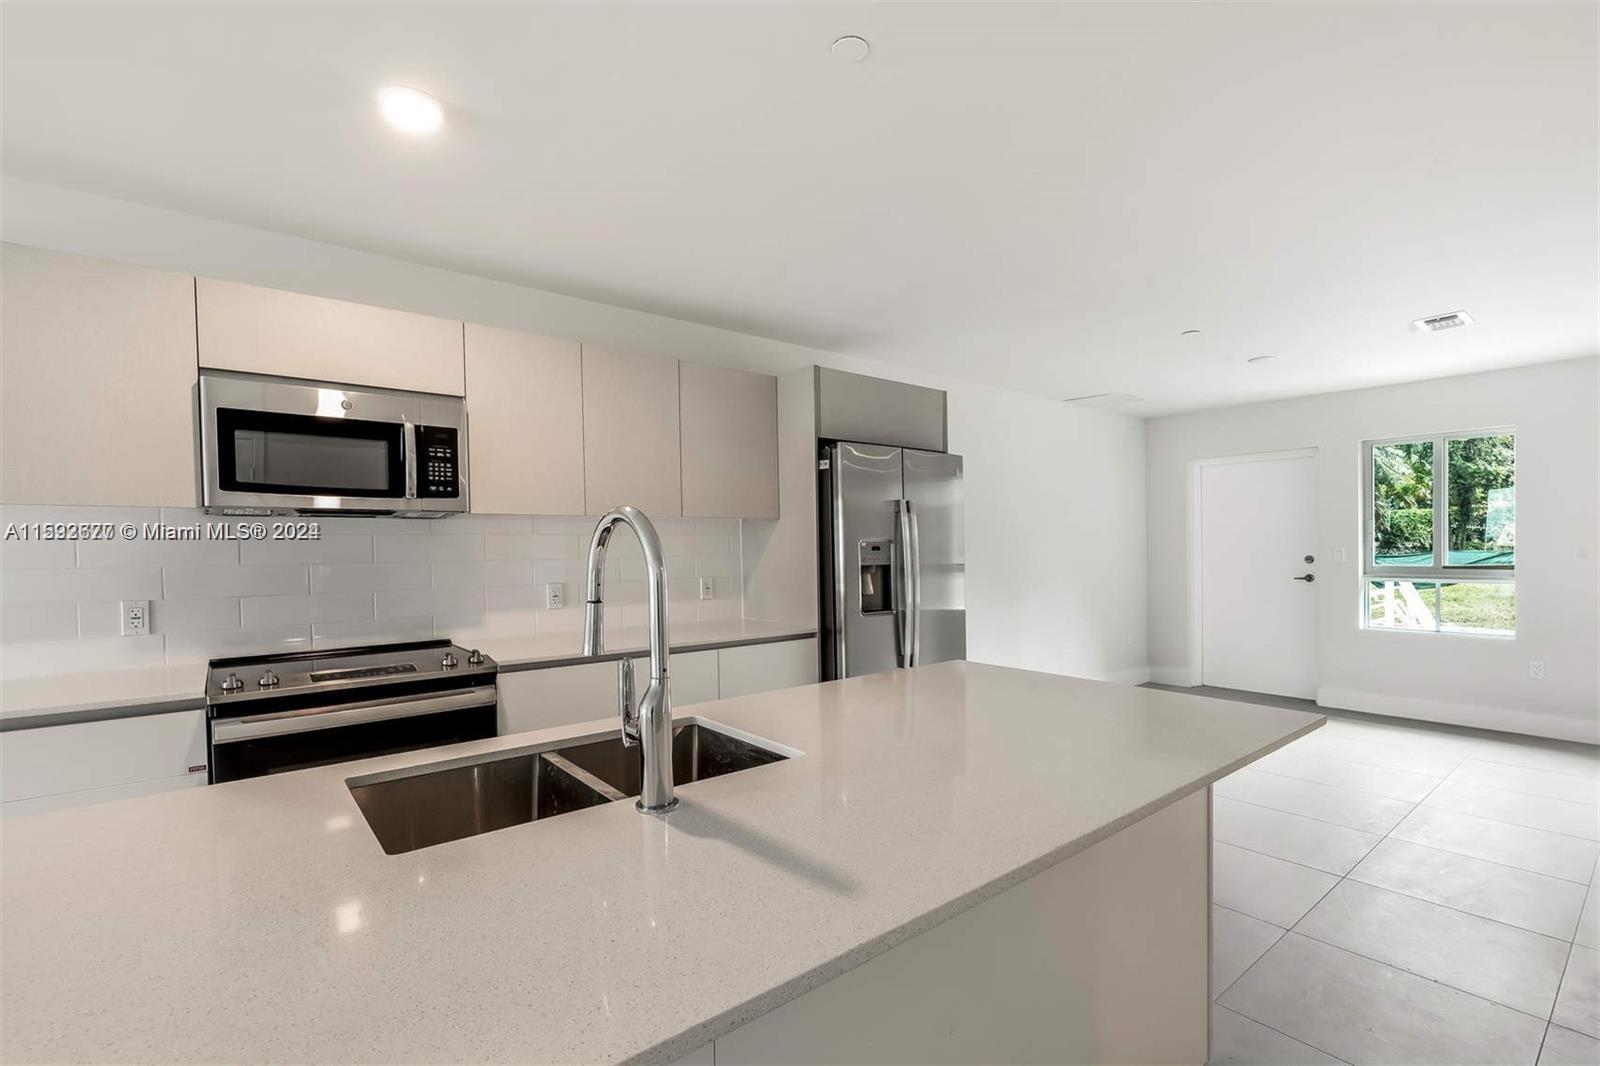
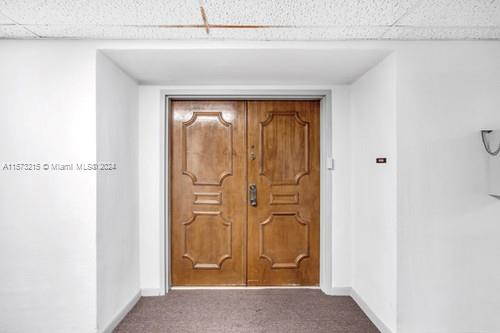
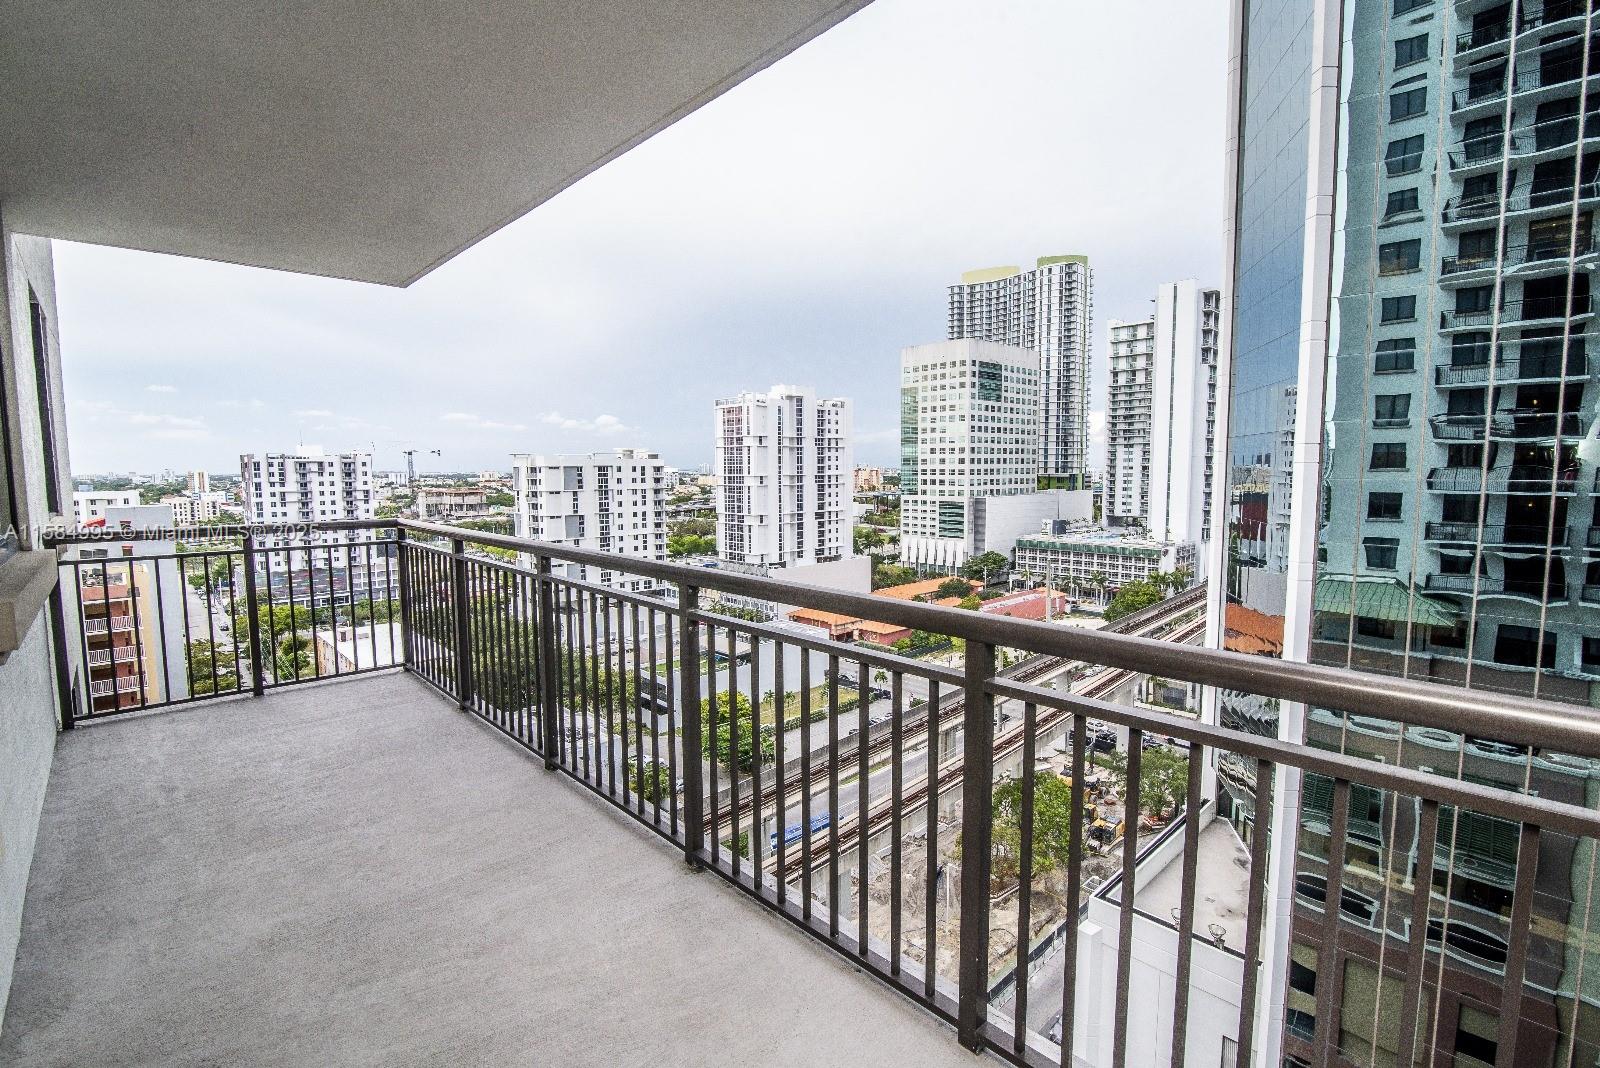
Active
$545,000
2
bds
|
2
ba
|
980
sqft
|
built
2016
201 SW 17th Rd, Miami, FL 33129
$-2,127
Cash flow
-20.4%
Cash-on-Cash Return
1.5%
Cap rate
0.6%
Rent to Value Ratio
Active
$500,000
3
bds
|
3
ba
|
1,360
sqft
|
built
2021
2561 NE 193rd St, Miami, FL 33180
$-180
Cash flow
-1.9%
Cash-on-Cash Return
5.7%
Cap rate
0.7%
Rent to Value Ratio
Active
$717,000
2
bds
|
2
ba
|
1,064
sqft
|
built
2015
999 SW 1st Ave, Miami, FL 33130
$-2,603
Cash flow
-18.9%
Cash-on-Cash Return
1.8%
Cap rate
0.6%
Rent to Value Ratio
Active
$799,000
3
bds
|
3
ba
|
1,505
sqft
|
built
2015
600 NE 27th St, Miami, FL 33137
$-1,027
Cash flow
-6.7%
Cash-on-Cash Return
4.6%
Cap rate
0.9%
Rent to Value Ratio
Active
$470,000
1
bds
|
2
ba
|
987
sqft
|
built
2006
41 SE 5th St, Miami, FL 33131
$-1,632
Cash flow
-18.1%
Cash-on-Cash Return
2.0%
Cap rate
0.6%
Rent to Value Ratio
Active
$1,948,000
5
bds
|
4
ba
|
3,178
sqft
|
built
1968
20405 NE 22nd Pl, Miami, FL 33180
$-5,107
Cash flow
-13.7%
Cash-on-Cash Return
3.0%
Cap rate
0.5%
Rent to Value Ratio
Active
$1,450,000
3
bds
|
3
ba
|
1,305
sqft
|
built
1997
701 Brickell Key Blvd, Miami, FL 33131
$-5,713
Cash flow
-20.6%
Cash-on-Cash Return
1.4%
Cap rate
0.4%
Rent to Value Ratio
Active
$1,200,000
3
bds
|
2
ba
|
1,792
sqft
|
built
2005
325 S Biscayne Blvd, Miami, FL 33131
$-5,636
Cash flow
-24.5%
Cash-on-Cash Return
0.5%
Cap rate
0.5%
Rent to Value Ratio
Active
$578,000
1
bds
|
2
ba
|
1,042
sqft
|
built
1982
1581 Brickell Ave, Miami, FL 33129
$-2,041
Cash flow
-18.4%
Cash-on-Cash Return
1.9%
Cap rate
0.7%
Rent to Value Ratio
Active
$750,000
1
bds
|
2
ba
|
965
sqft
|
built
2014
1300 Brickell Bay Dr, Miami, FL 33131
$-833
Cash flow
-5.8%
Cash-on-Cash Return
4.8%
Cap rate
0.7%
Rent to Value Ratio
Active
$564,500
2
bds
|
3
ba
|
1,113
sqft
|
built
2006
690 SW 1st Ct, Miami, FL 33130
$-2,376
Cash flow
-22.0%
Cash-on-Cash Return
1.1%
Cap rate
0.6%
Rent to Value Ratio

Active
$1,250,000
2
bds
|
3
ba
|
1,560
sqft
|
built
2019
851 NE 1st St, Miami, FL 33132
$-4,455
Cash flow
-18.6%
Cash-on-Cash Return
1.9%
Cap rate
0.7%
Rent to Value Ratio
Active
$1,485,000
3
bds
|
3
ba
|
1,450
sqft
|
built
2018
801 S Miami Ave, Miami, FL 33130
$-4,541
Cash flow
-16.0%
Cash-on-Cash Return
2.5%
Cap rate
0.5%
Rent to Value Ratio
Active
$540,000
2
bds
|
2
ba
|
1,018
sqft
|
built
2018
1600 NE 1st Ave, Miami, FL 33132
$-1,789
Cash flow
-17.3%
Cash-on-Cash Return
2.2%
Cap rate
0.7%
Rent to Value Ratio
Active
$1,550,000
2
bds
|
2
ba
|
1,313
sqft
|
built
2008
465 Brickell Ave, Miami, FL 33131
$-5,665
Cash flow
-19.1%
Cash-on-Cash Return
1.8%
Cap rate
0.5%
Rent to Value Ratio
Active
$2,500,000
3
bds
|
4
ba
|
2,018
sqft
|
built
2018
488 NE 18th St, Miami, FL 33132
$-10,237
Cash flow
-21.4%
Cash-on-Cash Return
1.2%
Cap rate
0.4%
Rent to Value Ratio

Active
$355,000
2
bds
|
2
ba
|
1,408
sqft
|
built
1968
11111 Biscayne Blvd, Miami, FL 33181
$-1,662
Cash flow
-24.4%
Cash-on-Cash Return
0.5%
Cap rate
0.9%
Rent to Value Ratio
Active
$810,000
2
bds
|
2
ba
|
1,118
sqft
|
built
2010
92 SW 3rd St, Miami, FL 33130
$-3,006
Cash flow
-19.4%
Cash-on-Cash Return
1.7%
Cap rate
0.6%
Rent to Value Ratio

Active
$700,000
2
bds
|
2
ba
|
1,205
sqft
|
built
2007
3250 NE 1st Ave, Miami, FL 33137
$-2,710
Cash flow
-20.2%
Cash-on-Cash Return
1.5%
Cap rate
0.6%
Rent to Value Ratio
Active
$530,000
2
bds
|
2
ba
|
1,048
sqft
|
built
2007
1750 N Bayshore Dr, Miami, FL 33132
$-2,636
Cash flow
-25.9%
Cash-on-Cash Return
0.2%
Cap rate
0.8%
Rent to Value Ratio

Active
$450,301
1
bds
|
1
ba
|
791
sqft
|
built
2008
1750 N Bayshore Dr, Miami, FL 33132
$-2,402
Cash flow
-27.8%
Cash-on-Cash Return
-0.3%
Cap rate
0.6%
Rent to Value Ratio

Active
$620,000
2
bds
|
2
ba
|
1,105
sqft
|
built
2005
335 S Biscayne Blvd, Miami, FL 33131
$-2,405
Cash flow
-20.2%
Cash-on-Cash Return
1.5%
Cap rate
0.6%
Rent to Value Ratio
Active
$275,000
1
bds
|
2
ba
|
740
sqft
|
built
1968
7403 SW 82nd St, Miami, FL 33143
$-728
Cash flow
-13.8%
Cash-on-Cash Return
3.0%
Cap rate
0.7%
Rent to Value Ratio

Active
$515,000
1
bds
|
1
ba
|
755
sqft
|
built
2007
3250 NE 1st Ave, Miami, FL 33137
$-1,901
Cash flow
-19.3%
Cash-on-Cash Return
1.7%
Cap rate
0.7%
Rent to Value Ratio
Active
$450,000
2
bds
|
2
ba
|
954
sqft
|
built
2003
10 SW South River Dr, Miami, FL 33130
$-1,300
Cash flow
-15.1%
Cash-on-Cash Return
2.7%
Cap rate
0.8%
Rent to Value Ratio
Active
$260,000
2
bds
|
2
ba
|
1,170
sqft
|
built
1982
5900 SW 127th Ave, Miami, FL 33183
$-398
Cash flow
-8.0%
Cash-on-Cash Return
4.3%
Cap rate
1.0%
Rent to Value Ratio
Active
$399,000
1
bds
|
1
ba
|
821
sqft
|
built
2007
1750 N Bayshore Dr, Miami, FL 33132
$-1,288
Cash flow
-16.8%
Cash-on-Cash Return
2.3%
Cap rate
1.0%
Rent to Value Ratio

Active
$585,000
2
bds
|
2
ba
|
999
sqft
|
built
2015
4250 Biscayne Blvd, Miami, FL 33137
$-2,754
Cash flow
-24.6%
Cash-on-Cash Return
0.5%
Cap rate
0.6%
Rent to Value Ratio
Active
$700,000
2
bds
|
2
ba
|
1,228
sqft
|
built
2015
999 SW 1st Ave, Miami, FL 33130
$-2,359
Cash flow
-17.6%
Cash-on-Cash Return
2.1%
Cap rate
0.7%
Rent to Value Ratio
Active
$689,000
3
bds
|
2
ba
|
844
sqft
|
built
1935
737 NW 30th St, Miami, FL 33127
$-1,583
Cash flow
-12.0%
Cash-on-Cash Return
3.4%
Cap rate
0.6%
Rent to Value Ratio
Active
$199,000
2
bds
|
2
ba
|
1,036
sqft
|
built
1972
496 NW 165th Street Rd, Miami, FL 33169
$-596
Cash flow
-15.6%
Cash-on-Cash Return
2.6%
Cap rate
1.1%
Rent to Value Ratio
Active
$699,000
3
bds
|
3
ba
|
1,204
sqft
|
built
1958
7945 SW 9th Ter, Miami, FL 33144
$-1,567
Cash flow
-11.7%
Cash-on-Cash Return
3.5%
Cap rate
0.5%
Rent to Value Ratio
Active
$780,000
2
bds
|
2
ba
|
1,183
sqft
|
built
2004
1200 Brickell Bay Dr, Miami, FL 33131
$-2,237
Cash flow
-15.0%
Cash-on-Cash Return
2.7%
Cap rate
0.6%
Rent to Value Ratio
Active
$795,000
3
bds
|
2
ba
|
1,486
sqft
|
built
1949
265 NW 44th St, Miami, FL 33127
$-1,636
Cash flow
-10.7%
Cash-on-Cash Return
3.7%
Cap rate
0.6%
Rent to Value Ratio
Active
$720,000
3
bds
|
2
ba
|
1,493
sqft
|
built
1916
627 SW 11th Ave, Miami, FL 33130
$-1,607
Cash flow
-11.6%
Cash-on-Cash Return
3.5%
Cap rate
0.5%
Rent to Value Ratio
Active
$620,000
4
bds
|
2
ba
|
1,594
sqft
|
built
1940
1877 SW 6th St, Miami, FL 33135
$-1,368
Cash flow
-11.5%
Cash-on-Cash Return
3.5%
Cap rate
0.6%
Rent to Value Ratio
Active
$380,000
3
bds
|
2
ba
|
752
sqft
|
built
1940
2255 NW 63rd St, Miami, FL 33147
$-456
Cash flow
-6.3%
Cash-on-Cash Return
4.7%
Cap rate
0.7%
Rent to Value Ratio
Active
$574,698
2
bds
|
2
ba
|
1,048
sqft
|
built
2008
1750 N Bayshore Dr, Miami, FL 33132
$-2,826
Cash flow
-25.7%
Cash-on-Cash Return
0.2%
Cap rate
0.7%
Rent to Value Ratio

Active
$339,000
3
bds
|
2
ba
|
1,200
sqft
|
built
1999
870 NE 212th Ter, Miami, FL 33179
$-497
Cash flow
-7.6%
Cash-on-Cash Return
4.4%
Cap rate
0.7%
Rent to Value Ratio
Active
$310,045
bds
|
1
ba
|
508
sqft
|
built
2008
1750 N Bayshore Dr, Miami, FL 33132
$-1,436
Cash flow
-24.2%
Cash-on-Cash Return
0.6%
Cap rate
0.7%
Rent to Value Ratio