Miami, FL Investment Properties for Sale
Browse homes for sale and investment properties in Miami, FL. Refine your search by price, property type, or more.
Best cash flowing properties in Miami, FL
Active
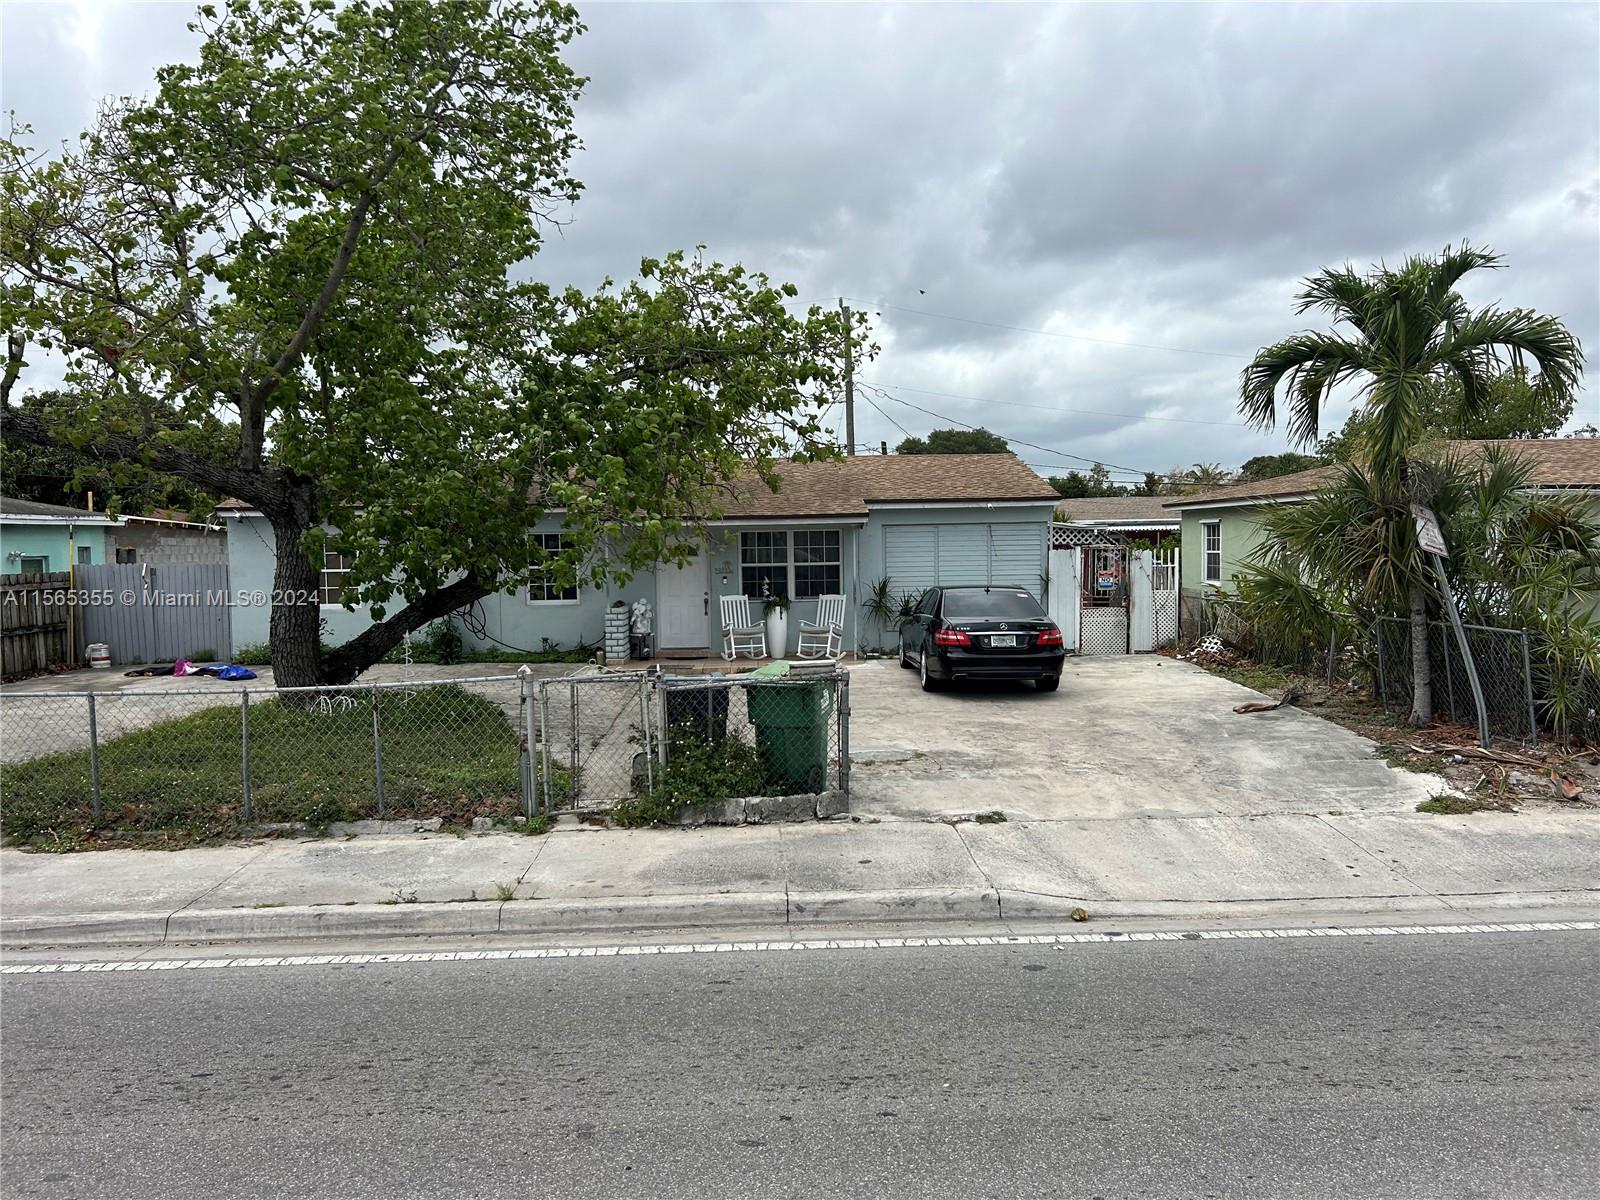
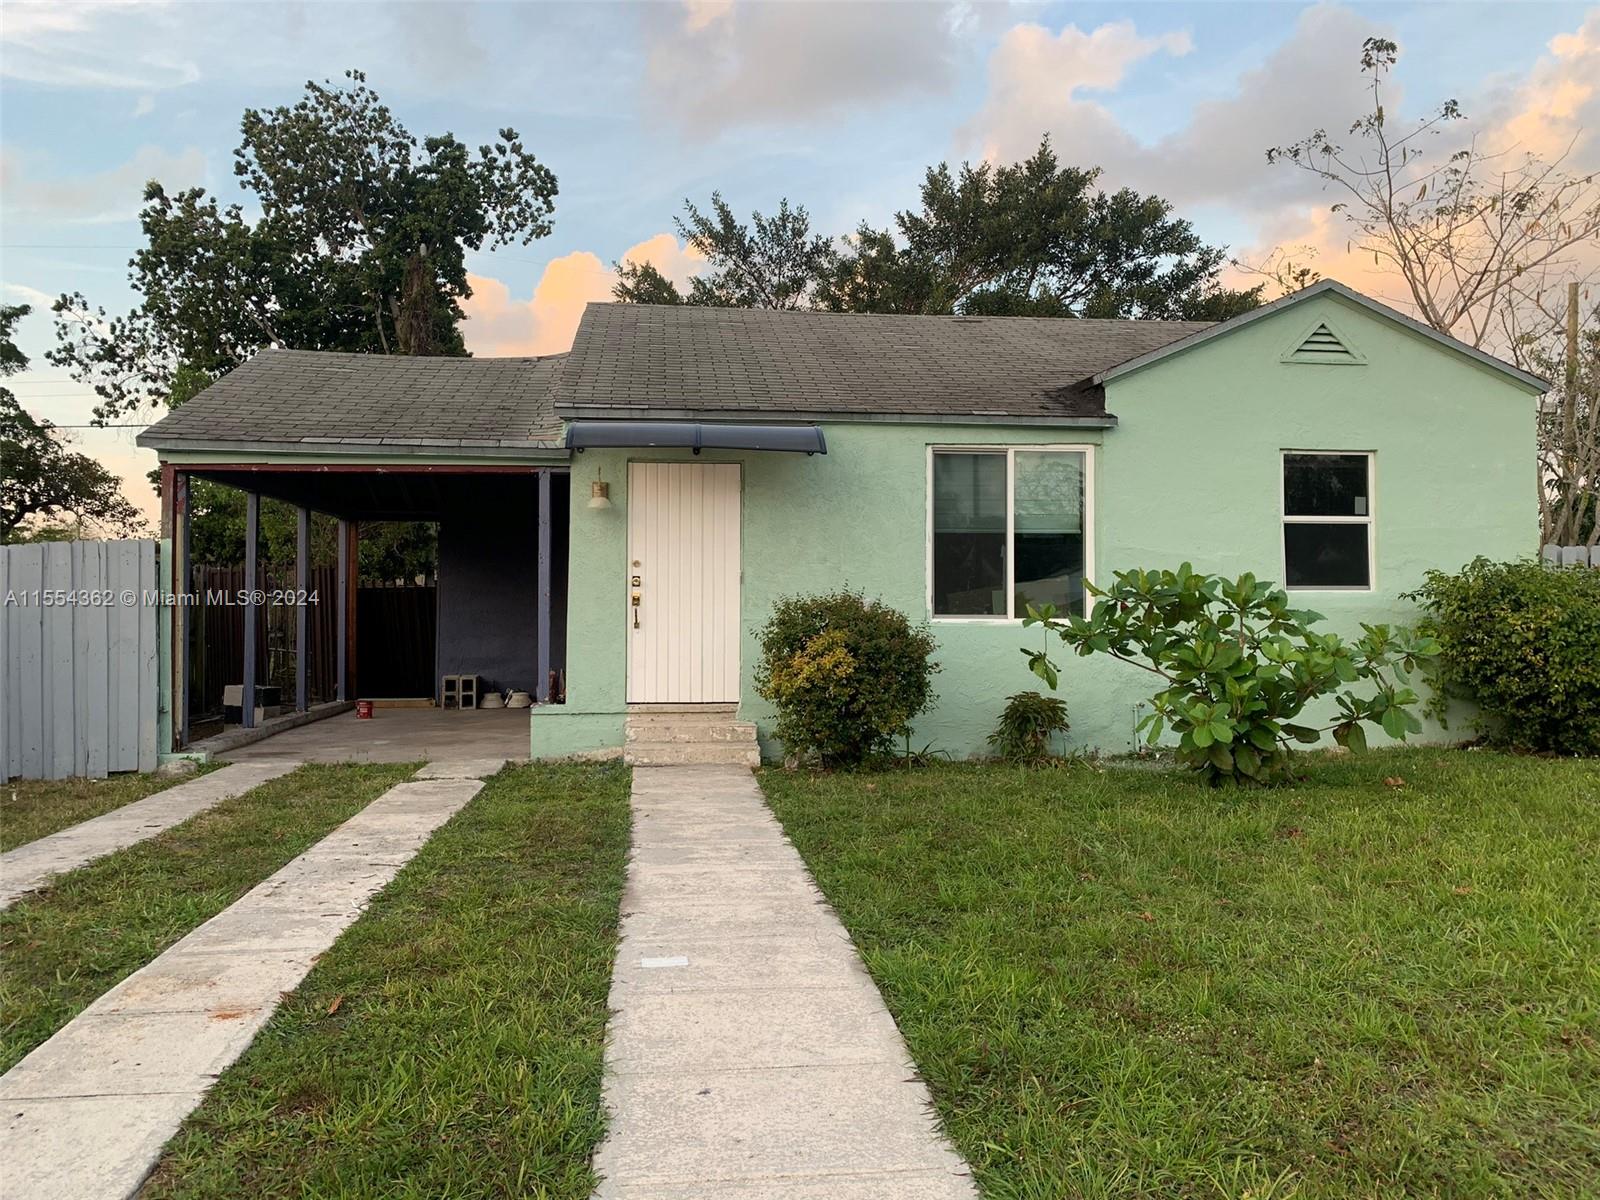
$229,000
2
bds
|
1
ba
|
685
sqft
|
built
1974
750 NW 43rd Ave, Miami, FL 33126
$-297
Cash flow
-6.8%
Cash-on-Cash Return
4.7%
Cap rate
0.9%
Rent to Value Ratio
Active
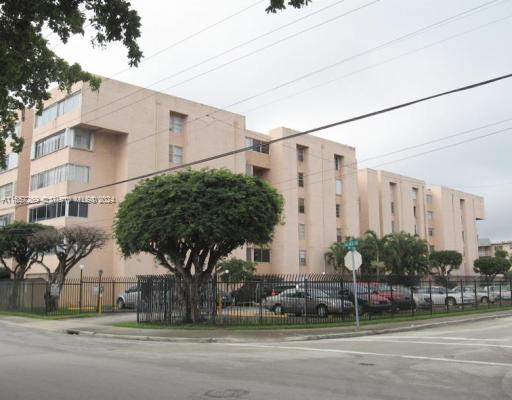
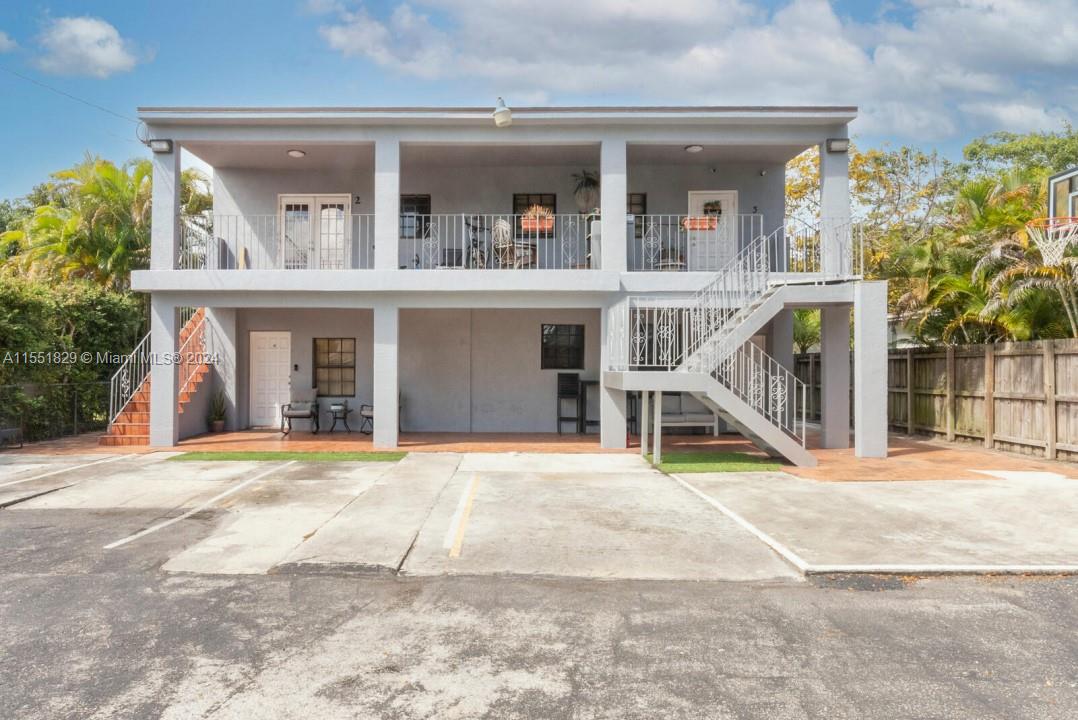
$149,900
1
bds
|
1
ba
|
840
sqft
|
built
1972
15600 NW 7th Ave, Miami, FL 33169
$-321
Cash flow
-11.2%
Cash-on-Cash Return
3.7%
Cap rate
1.1%
Rent to Value Ratio
6,177 out of 7,012 properties for sale in Miami, FL
Limited Results Shown
Create a free account, or log in to reveal all property listings and enjoy the complete experience.
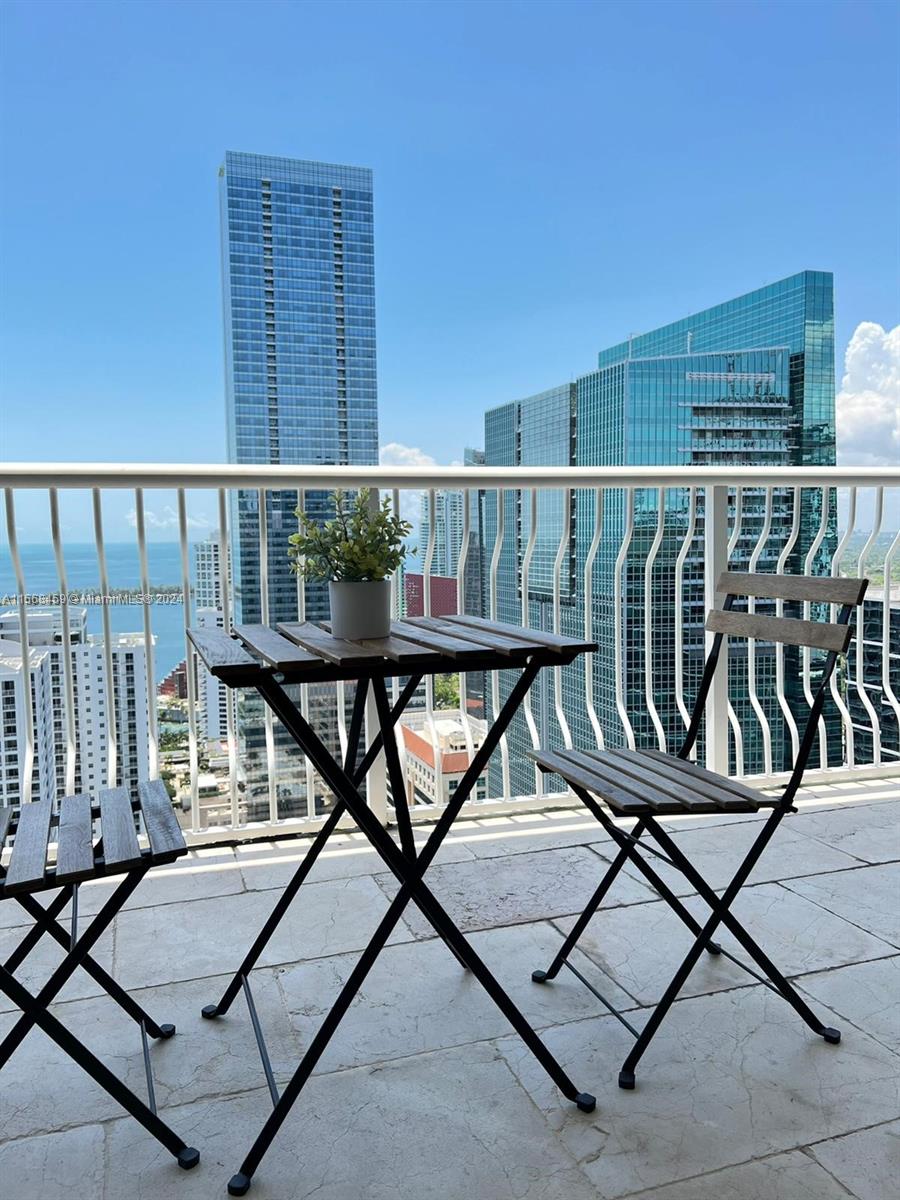
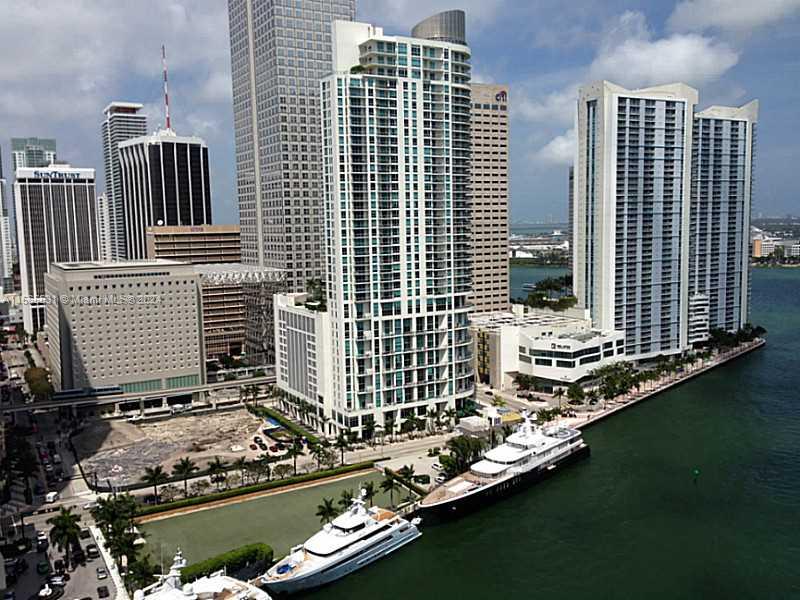
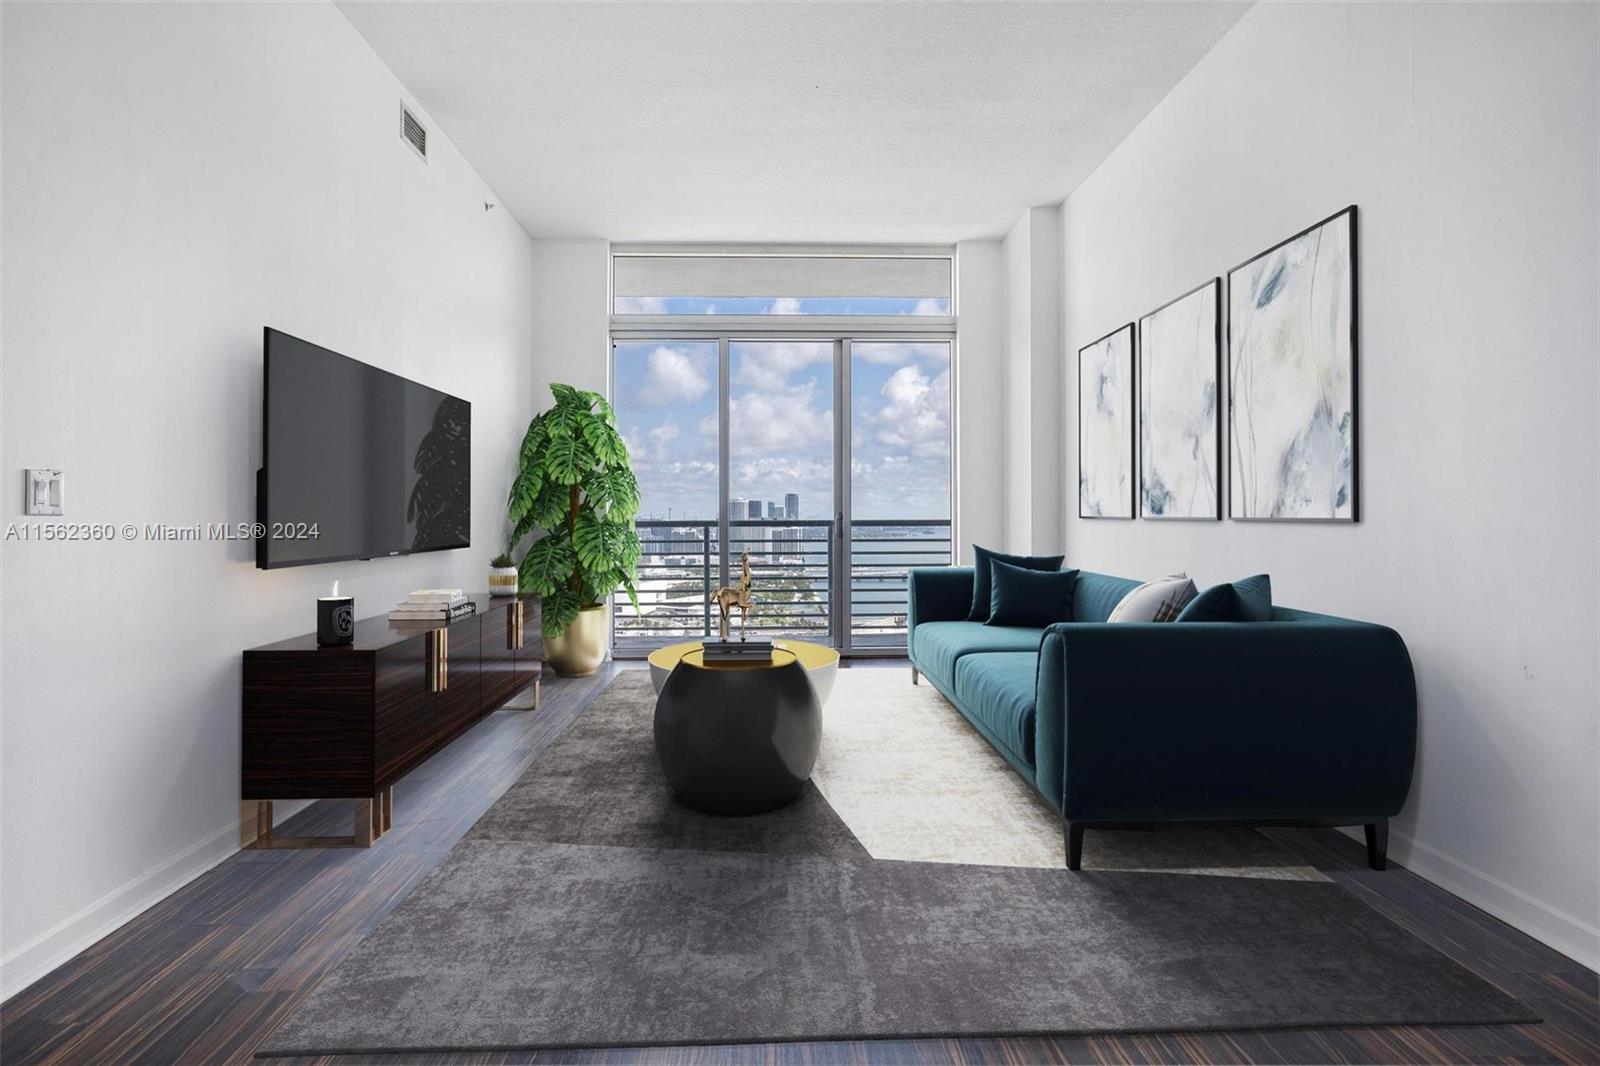
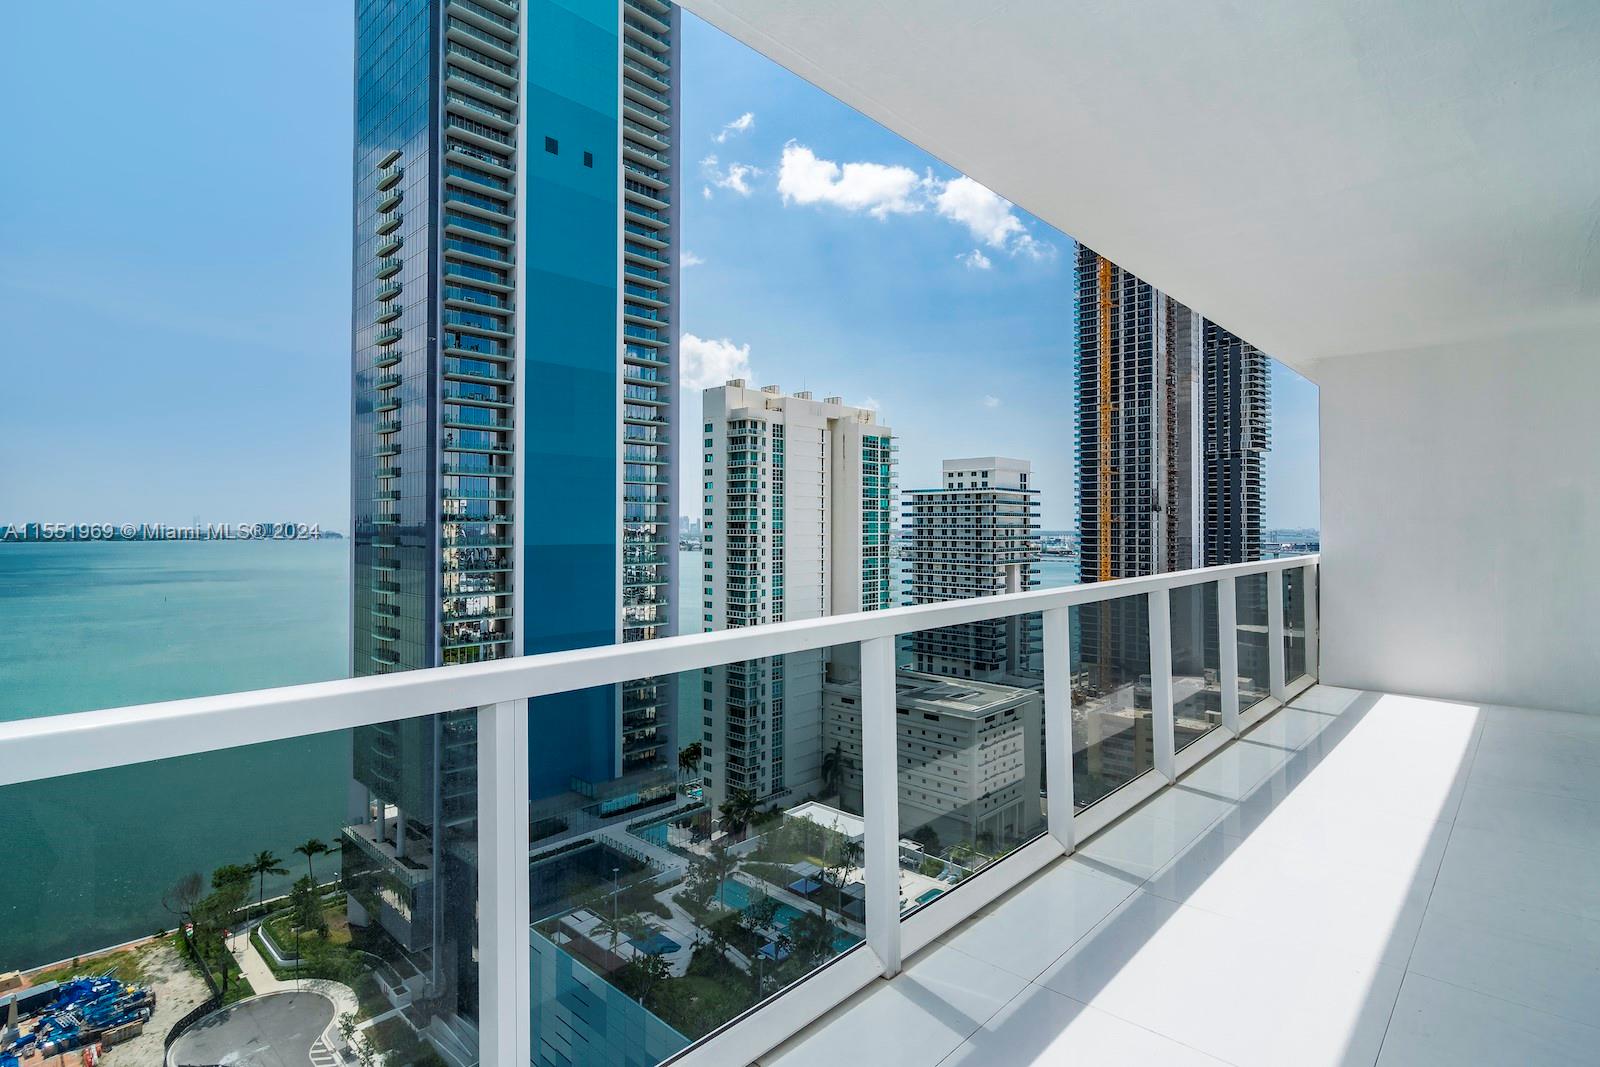
Active
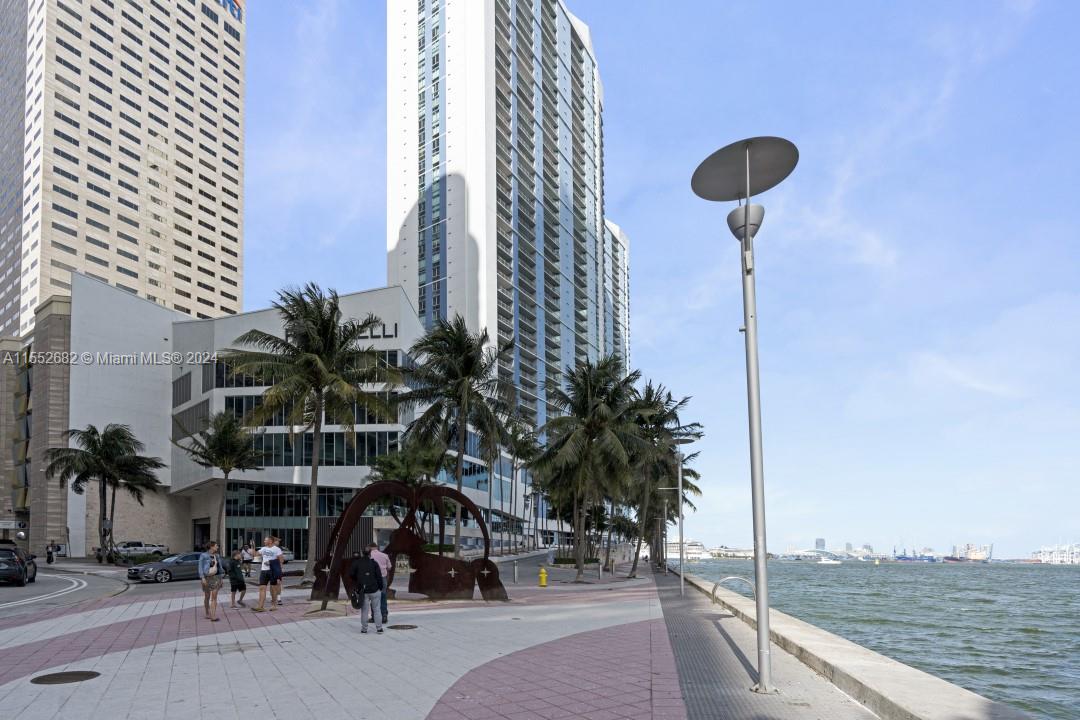
$599,000
1
bds
|
1
ba
|
836
sqft
|
built
2005
1200 Brickell Bay Dr, Miami, FL 33131
$-1,823
Cash flow
-15.9%
Cash-on-Cash Return
2.6%
Cap rate
0.6%
Rent to Value Ratio
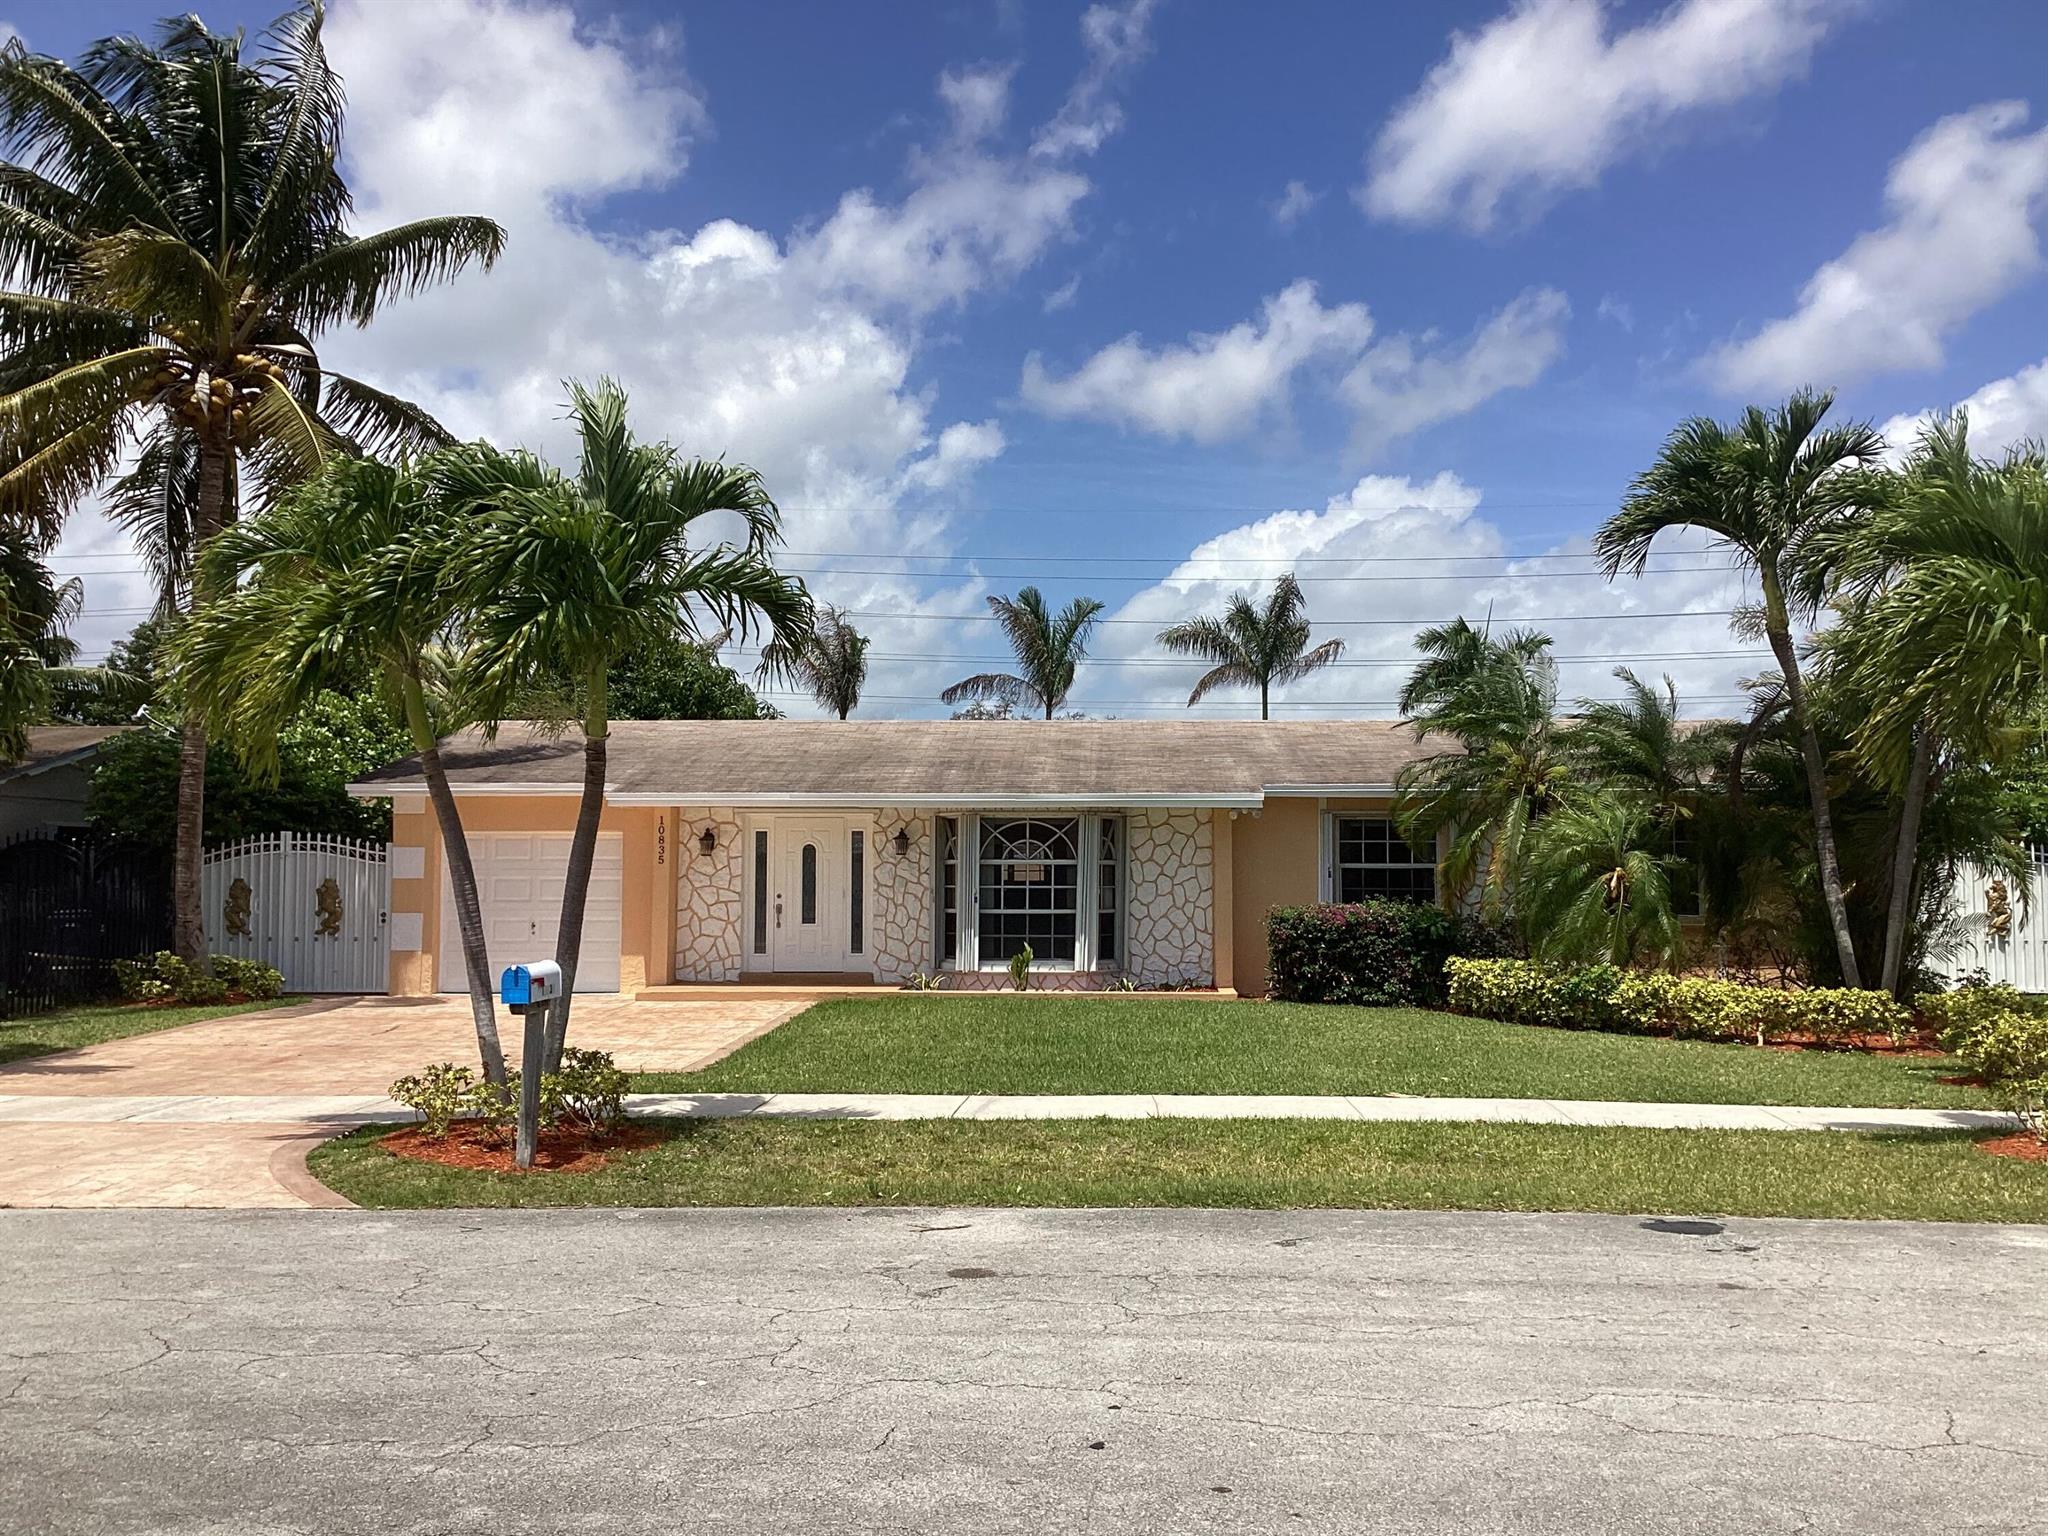
Active
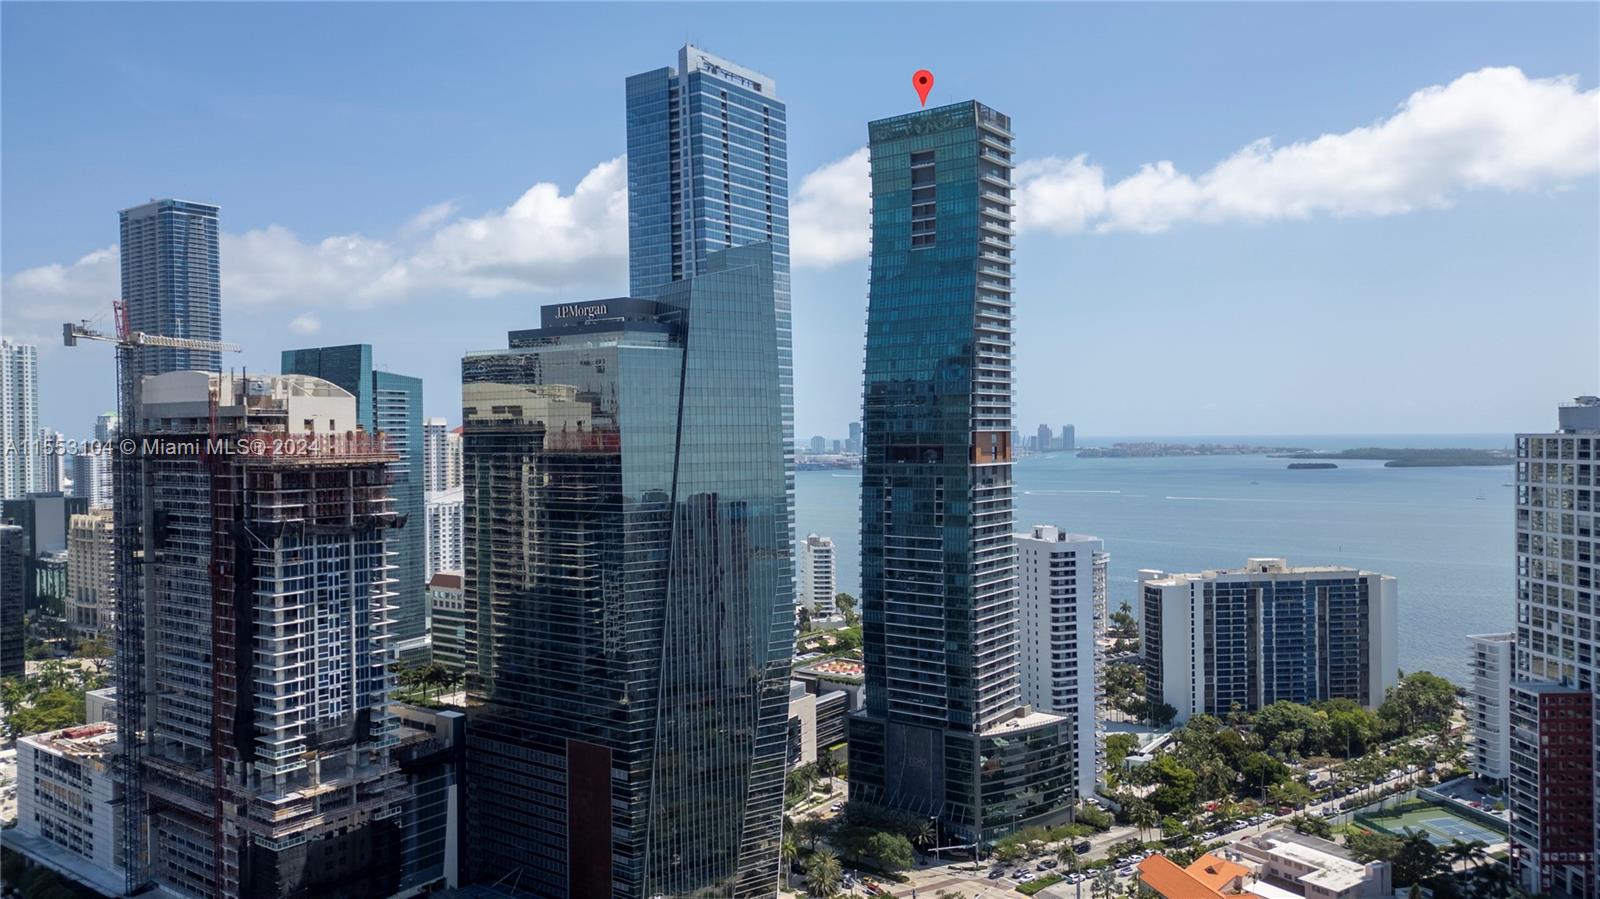
$735,000
4
bds
|
2
ba
|
2,285
sqft
|
built
1974
10835 SW 152nd Ter, Miami, FL 33157
$-1,693
Cash flow
-12.0%
Cash-on-Cash Return
3.5%
Cap rate
0.5%
Rent to Value Ratio
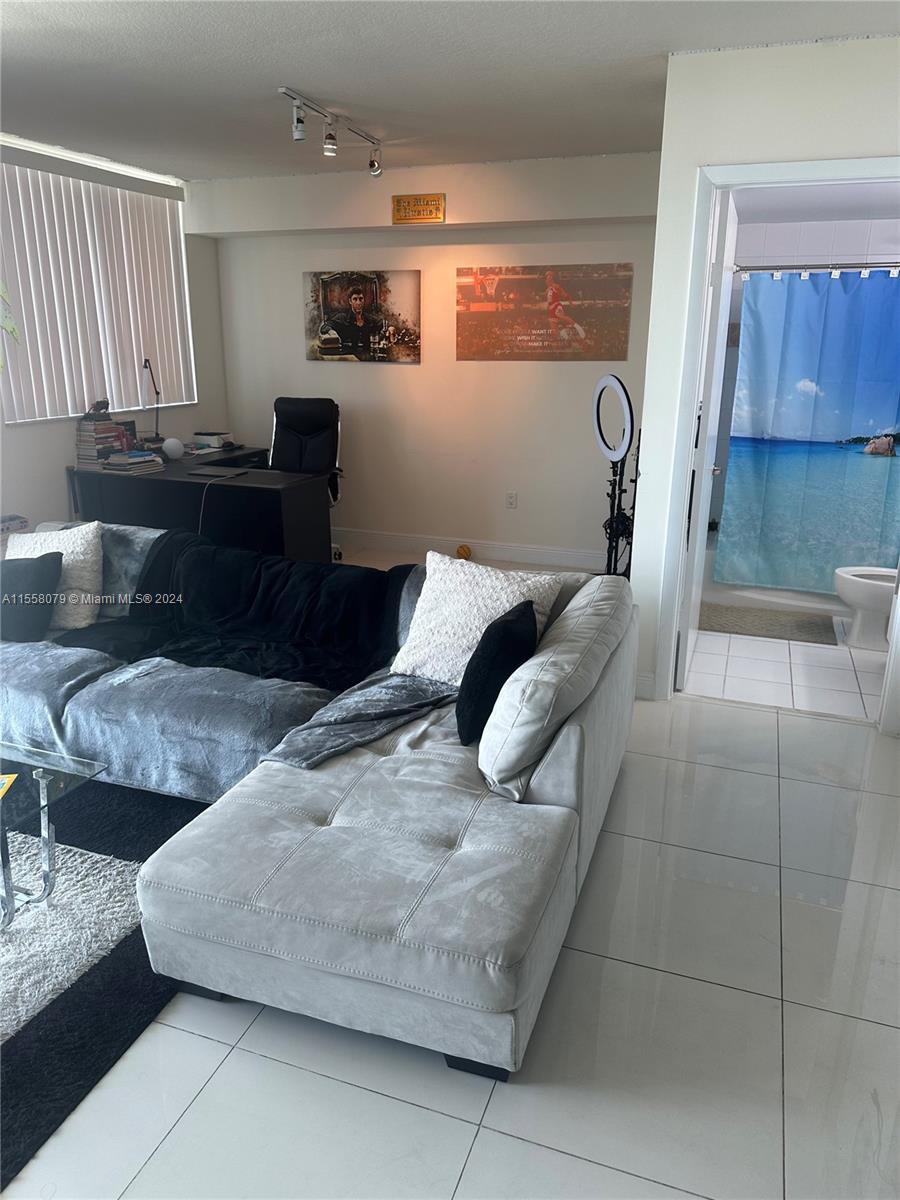
Active
$590,462
2
bds
|
2
ba
|
1,048
sqft
|
built
2008
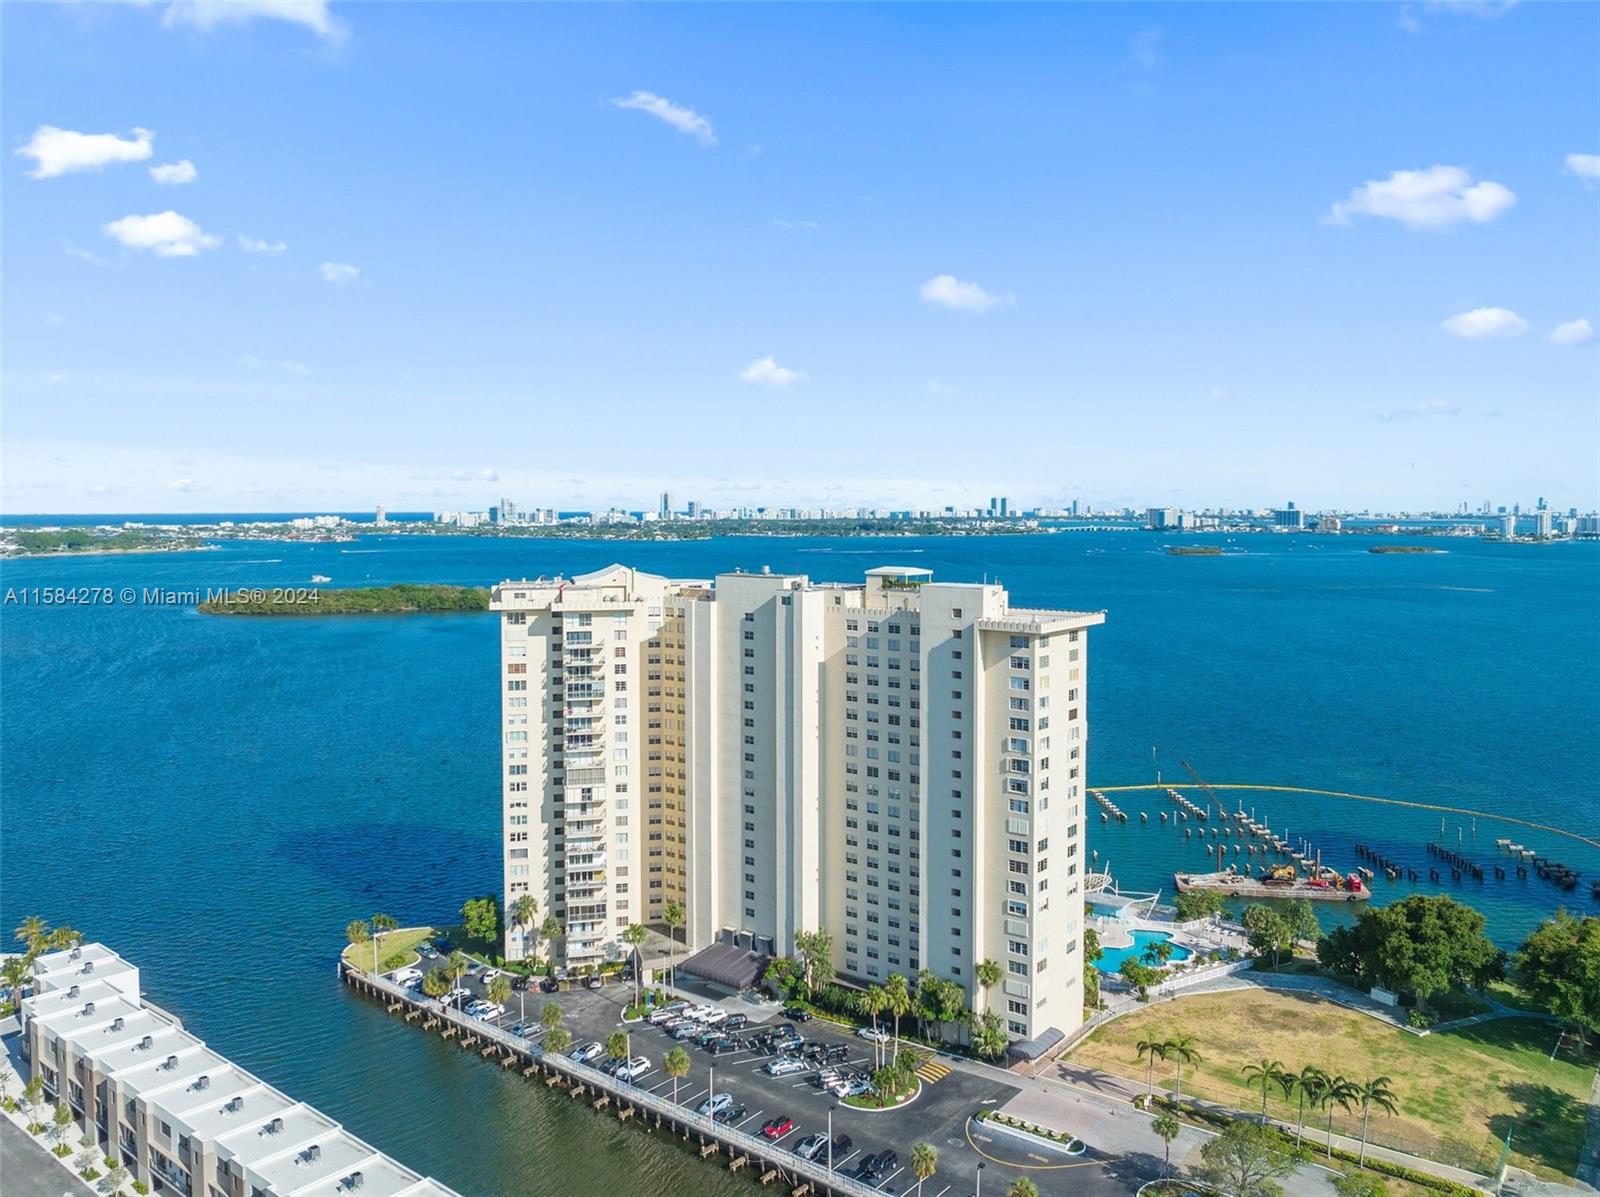
1750 N Bayshore Dr, Miami, FL 33132
$-2,979
Cash flow
-26.3%
Cash-on-Cash Return
0.2%
Cap rate
0.7%
Rent to Value Ratio
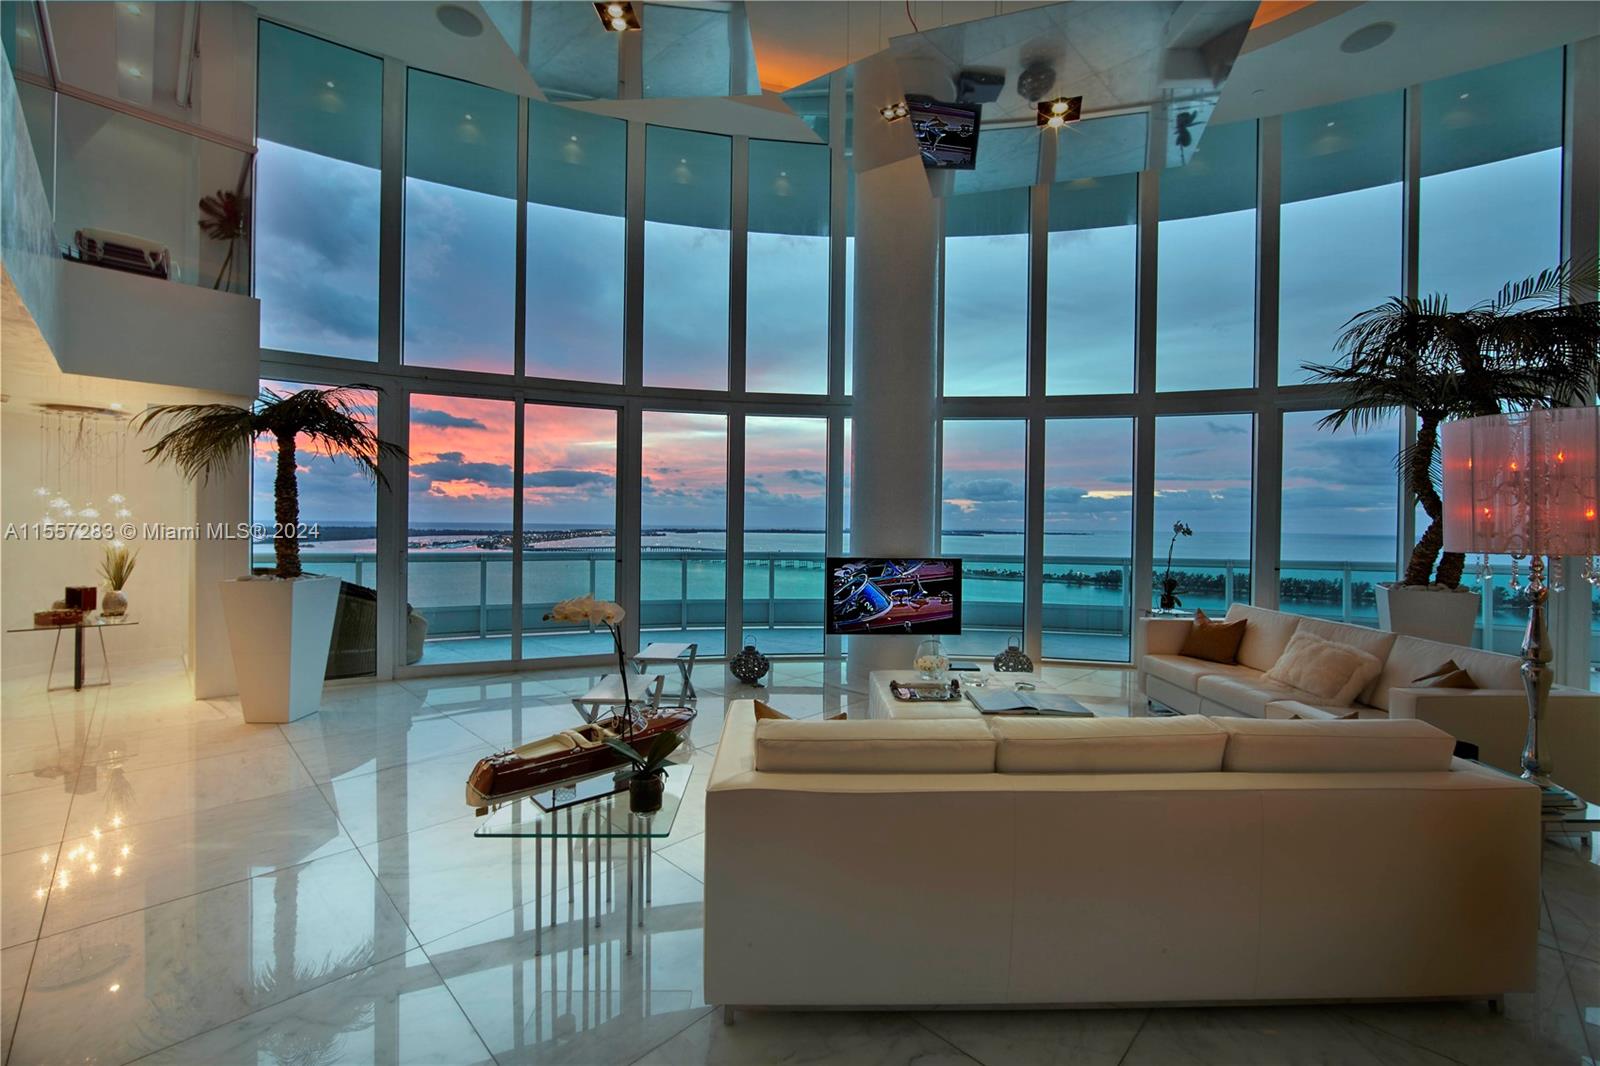
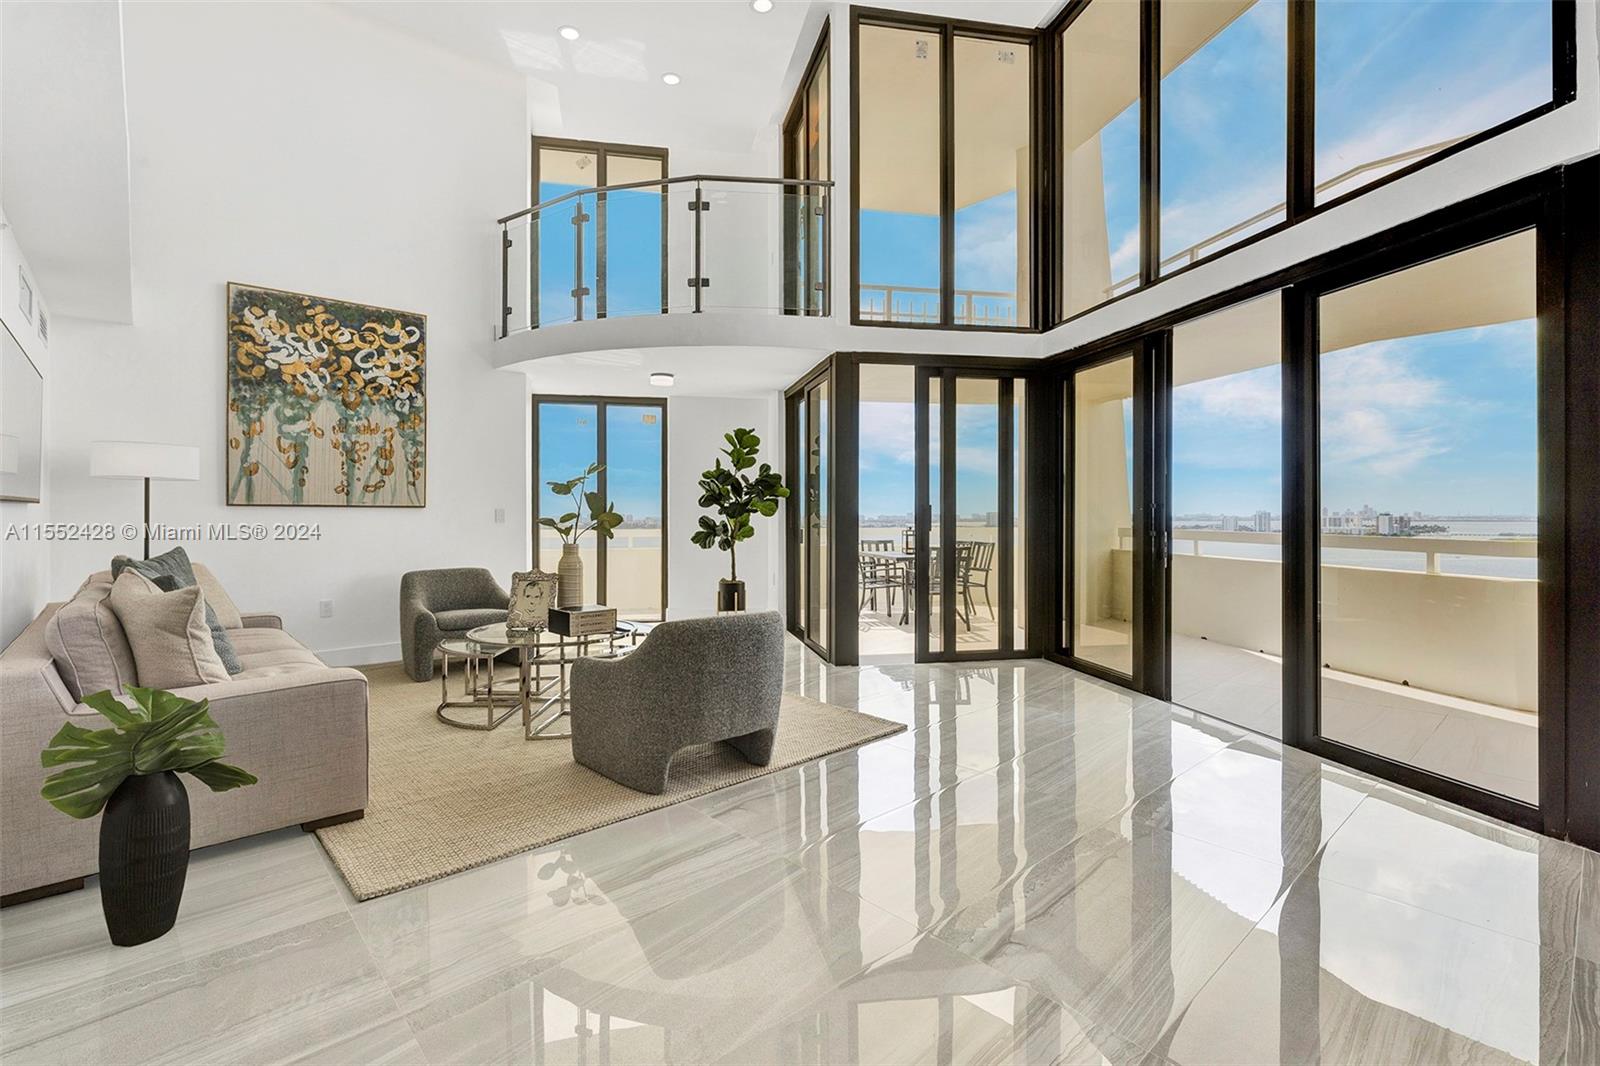
Active
$437,000
1
bds
|
2
ba
|
868
sqft
|
built
1975
1901 Brickell Ave, Miami, FL 33129
$-1,307
Cash flow
-15.6%
Cash-on-Cash Return
2.7%
Cap rate
0.7%
Rent to Value Ratio
Active
$585,000
2
bds
|
2
ba
|
1,075
sqft
|
built
2008
350 S Miami Ave, Miami, FL 33130
$-2,190
Cash flow
-19.5%
Cash-on-Cash Return
1.8%
Cap rate
0.7%
Rent to Value Ratio

Active
$625,000
2
bds
|
2
ba
|
1,018
sqft
|
built
2018
1600 NE 1st Ave, Miami, FL 33132
$-1,743
Cash flow
-14.6%
Cash-on-Cash Return
2.9%
Cap rate
0.7%
Rent to Value Ratio
Active
$349,000
2
bds
|
2
ba
|
500
sqft
|
built
1948
8016 NW 9th Ave, Miami, FL 33150
$-1,083
Cash flow
-16.2%
Cash-on-Cash Return
2.6%
Cap rate
0.5%
Rent to Value Ratio
Active
$3,850,000
5
bds
|
4
ba
|
3,518
sqft
|
built
1994
3950 Hardie Ave, Miami, FL 33133
$-14,993
Cash flow
-20.3%
Cash-on-Cash Return
1.6%
Cap rate
0.3%
Rent to Value Ratio
Active
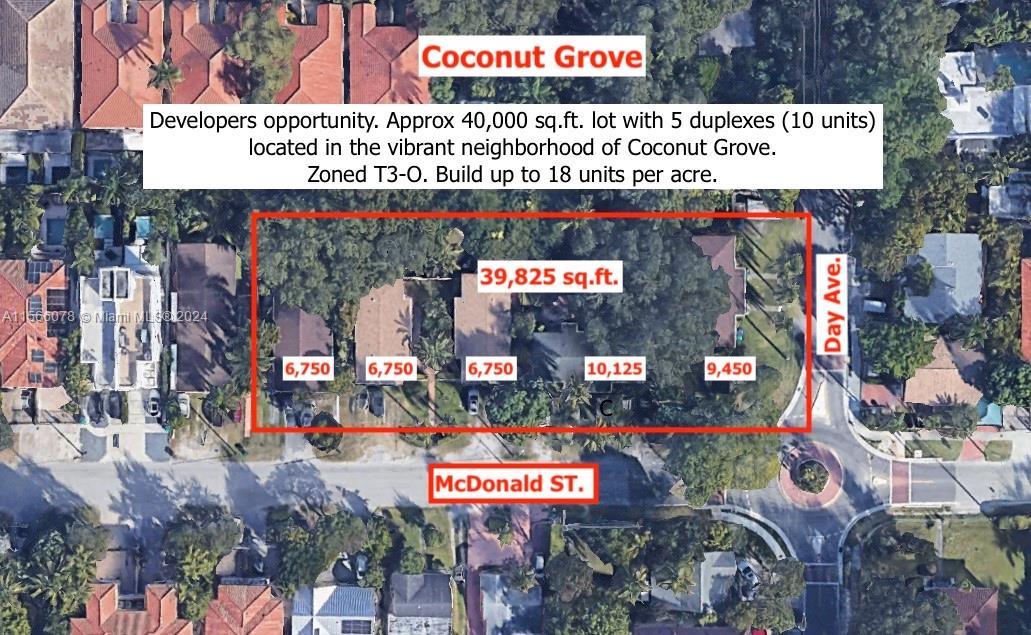
$10,000,000
4
bds
|
0
ba
|
1,400
sqft
|
built
1959
3151 Mc Donald St, Miami, FL 33133
$-51,711
Cash flow
-27.0%
Cash-on-Cash Return
0.1%
Cap rate
0.0%
Rent to Value Ratio
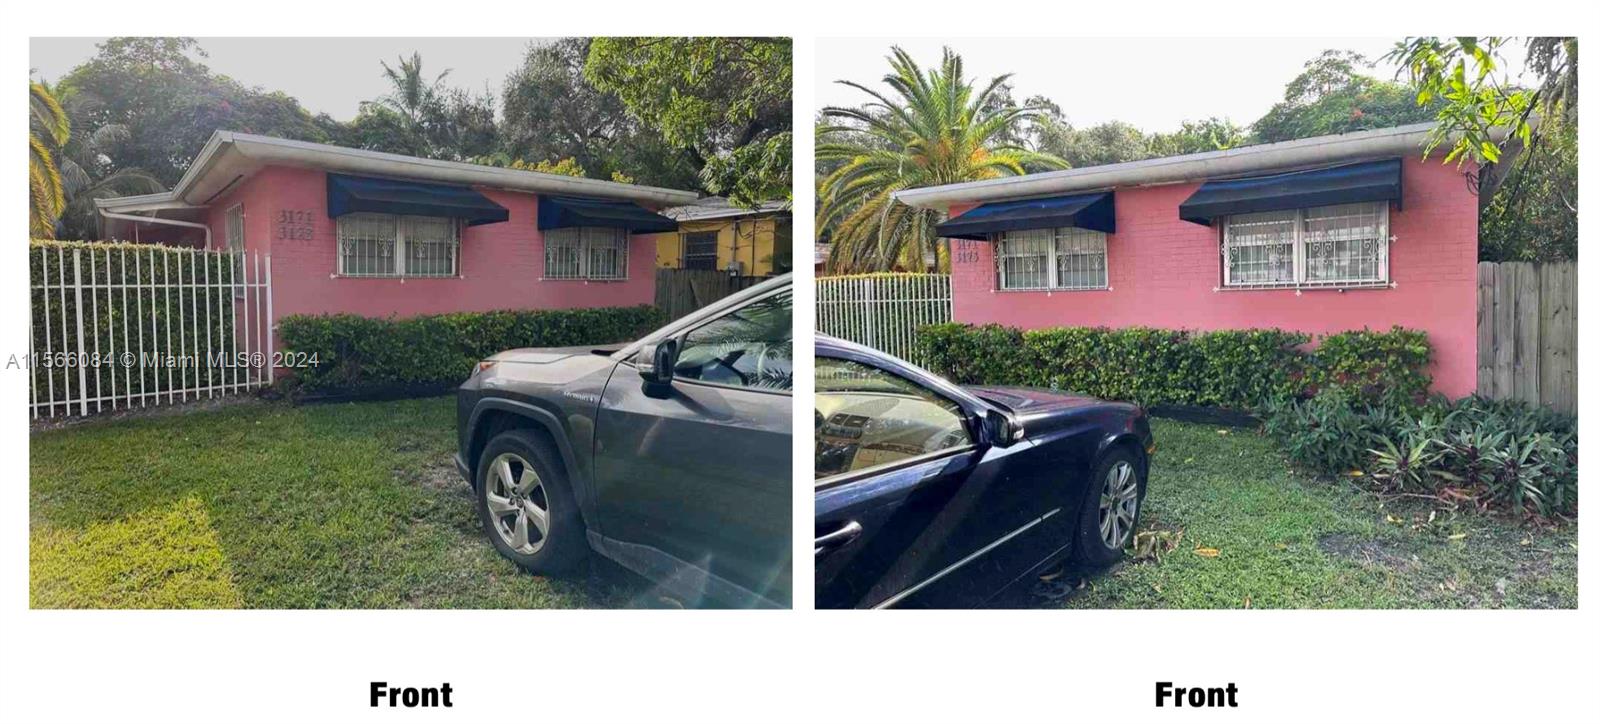
Active
$10,000,000
4
bds
|
0
ba
|
1,416
sqft
|
built
1955
3171 Mc Donald St, Miami, FL 33133
$-51,669
Cash flow
-27.0%
Cash-on-Cash Return
0.1%
Cap rate
0.0%
Rent to Value Ratio

Active
$10,000,000
4
bds
|
0
ba
|
1,500
sqft
|
built
1948
3181 Mc Donald St, Miami, FL 33133
$-51,501
Cash flow
-26.9%
Cash-on-Cash Return
0.1%
Cap rate
0.0%
Rent to Value Ratio

Active
$10,000,000
4
bds
|
0
ba
|
1,580
sqft
|
built
1948
3191 Day Ave, Miami, FL 33133
$-51,963
Cash flow
-27.1%
Cash-on-Cash Return
0.0%
Cap rate
0.0%
Rent to Value Ratio
Active
$1,500,000
4
bds
|
3
ba
|
2,448
sqft
|
built
2009
1884 SW 17th St, Miami, FL 33145
$-2,518
Cash flow
-8.8%
Cash-on-Cash Return
4.3%
Cap rate
0.6%
Rent to Value Ratio
Active
$229,000
2
bds
|
1
ba
|
685
sqft
|
built
1974
750 NW 43rd Ave, Miami, FL 33126
$-297
Cash flow
-6.8%
Cash-on-Cash Return
4.7%
Cap rate
0.9%
Rent to Value Ratio
Active
$950,000
2
bds
|
2
ba
|
0
sqft
|
built
2008
475 Brickell Ave, Miami, FL 33131
$-3,380
Cash flow
-18.6%
Cash-on-Cash Return
2.0%
Cap rate
0.6%
Rent to Value Ratio
Active
$1,050,000
2
bds
|
3
ba
|
1,244
sqft
|
built
2016
68 SE 6th St, Miami, FL 33131
$-4,579
Cash flow
-22.8%
Cash-on-Cash Return
1.1%
Cap rate
0.5%
Rent to Value Ratio
Active
$5,899,000
7
bds
|
7
ba
|
6,288
sqft
|
built
1939
1051 NE 89th St, Miami, FL 33138
$-28,651
Cash flow
-25.3%
Cash-on-Cash Return
0.5%
Cap rate
0.1%
Rent to Value Ratio

Active
$6,200,000
4
bds
|
6
ba
|
4,600
sqft
|
built
2019
1000 Biscayne Blvd, Miami, FL 33132
$-44,671
Cash flow
-37.6%
Cash-on-Cash Return
-2.4%
Cap rate
0.1%
Rent to Value Ratio
Active
$700,000
2
bds
|
3
ba
|
1,298
sqft
|
built
2008
60 SW 13th St, Miami, FL 33130
$-2,704
Cash flow
-20.2%
Cash-on-Cash Return
1.6%
Cap rate
0.7%
Rent to Value Ratio
Active
$1,300,000
2
bds
|
2
ba
|
1,269
sqft
|
built
2008
465 Brickell Ave, Miami, FL 33131
$-6,086
Cash flow
-24.4%
Cash-on-Cash Return
0.7%
Cap rate
0.4%
Rent to Value Ratio
Active
$3,500,000
3
bds
|
0
ba
|
4,956
sqft
|
built
1946
6255 NE Miami Pl, Miami, FL 33138
$-18,958
Cash flow
-28.3%
Cash-on-Cash Return
-0.2%
Cap rate
0.1%
Rent to Value Ratio
Active
$365,000
1
bds
|
1
ba
|
763
sqft
|
built
2005
275 NE 18th St, Miami, FL 33132
$-1,403
Cash flow
-20.1%
Cash-on-Cash Return
1.7%
Cap rate
0.7%
Rent to Value Ratio
Active
$455,000
1
bds
|
1
ba
|
671
sqft
|
built
1990
770 Claughton Island Dr, Miami, FL 33131
$-2,165
Cash flow
-24.8%
Cash-on-Cash Return
0.6%
Cap rate
0.5%
Rent to Value Ratio
Active
$400,000
3
bds
|
1
ba
|
950
sqft
|
built
1953
9030 NW 32nd Ave, Miami, FL 33147
$-468
Cash flow
-6.1%
Cash-on-Cash Return
4.9%
Cap rate
0.6%
Rent to Value Ratio
Active
$615,000
2
bds
|
2
ba
|
1,105
sqft
|
built
2005
335 S Biscayne Blvd, Miami, FL 33131
$-2,810
Cash flow
-23.8%
Cash-on-Cash Return
0.8%
Cap rate
0.6%
Rent to Value Ratio
Active
$350,000
2
bds
|
2
ba
|
803
sqft
|
built
2010
1871 NW South River Dr, Miami, FL 33125
$-1,510
Cash flow
-22.5%
Cash-on-Cash Return
1.1%
Cap rate
0.7%
Rent to Value Ratio
Active
$6,950,000
4
bds
|
6
ba
|
5,730
sqft
|
built
1997
1643 Brickell Ave, Miami, FL 33129
$-43,397
Cash flow
-32.6%
Cash-on-Cash Return
-1.2%
Cap rate
0.1%
Rent to Value Ratio
Active
$489,000
1
bds
|
1
ba
|
760
sqft
|
built
2001
1155 Brickell Bay Dr, Miami, FL 33131
$-2,181
Cash flow
-23.3%
Cash-on-Cash Return
0.9%
Cap rate
0.6%
Rent to Value Ratio
Active
$7,995,000
5
bds
|
7
ba
|
4,676
sqft
|
built
2020
3470 Poinciana Ave, Miami, FL 33133
$-40,923
Cash flow
-26.7%
Cash-on-Cash Return
0.1%
Cap rate
0.1%
Rent to Value Ratio
Active
$450,000
2
bds
|
2
ba
|
1,138
sqft
|
built
1981
20505 E Country Club Dr, Miami, FL 33180
$-1,382
Cash flow
-16.0%
Cash-on-Cash Return
2.6%
Cap rate
0.9%
Rent to Value Ratio
Active
$519,900
1
bds
|
1
ba
|
681
sqft
|
built
2018
121 NE 34th St, Miami, FL 33137
$-2,175
Cash flow
-21.8%
Cash-on-Cash Return
1.3%
Cap rate
0.6%
Rent to Value Ratio
Active
$390,000
2
bds
|
1
ba
|
692
sqft
|
built
1948
935 NW 64th St, Miami, FL 33150
$-431
Cash flow
-5.8%
Cash-on-Cash Return
5.0%
Cap rate
0.7%
Rent to Value Ratio
Active
$1,100,000
5
bds
|
0
ba
|
2,960
sqft
|
built
1926
312 SW 32nd Ave, Miami, FL 33135
$-4,621
Cash flow
-21.9%
Cash-on-Cash Return
1.2%
Cap rate
0.3%
Rent to Value Ratio
Active
$484,000
1
bds
|
1
ba
|
846
sqft
|
built
2006
325 S Biscayne Blvd, Miami, FL 33131
$-1,748
Cash flow
-18.8%
Cash-on-Cash Return
2.0%
Cap rate
0.7%
Rent to Value Ratio
Active
$835,000
1
bds
|
2
ba
|
805
sqft
|
built
2017
1451 Brickell Ave, Miami, FL 33131
$-3,528
Cash flow
-22.0%
Cash-on-Cash Return
1.2%
Cap rate
0.7%
Rent to Value Ratio
Active
$365,000
2
bds
|
2
ba
|
0
sqft
|
built
1968
11111 Biscayne Blvd, Miami, FL 33181
$-1,886
Cash flow
-27.0%
Cash-on-Cash Return
0.1%
Cap rate
0.8%
Rent to Value Ratio
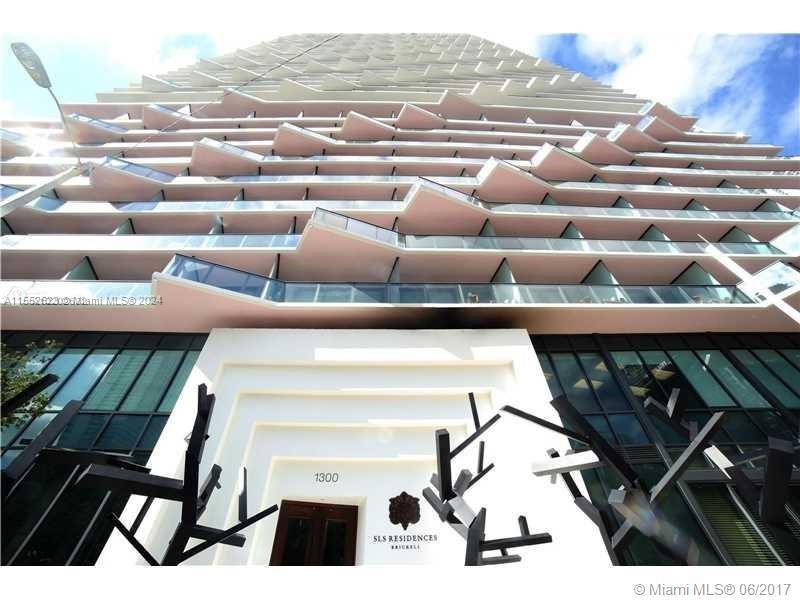
Active
$680,000
2
bds
|
2
ba
|
868
sqft
|
built
2016
1300 S Miami Ave, Miami, FL 33130
$-1,586
Cash flow
-12.2%
Cash-on-Cash Return
3.5%
Cap rate
0.7%
Rent to Value Ratio
Active
$3,999,000
4
bds
|
4
ba
|
3,632
sqft
|
built
1982
4000 Towerside Ter, Miami, FL 33138
$-21,376
Cash flow
-27.9%
Cash-on-Cash Return
-0.1%
Cap rate
0.3%
Rent to Value Ratio
Active
$845,000
3
bds
|
3
ba
|
1,584
sqft
|
built
2015
600 NE 27th St, Miami, FL 33137
$-2,544
Cash flow
-15.7%
Cash-on-Cash Return
2.7%
Cap rate
0.7%
Rent to Value Ratio
Active
$149,900
1
bds
|
1
ba
|
840
sqft
|
built
1972
15600 NW 7th Ave, Miami, FL 33169
$-321
Cash flow
-11.2%
Cash-on-Cash Return
3.7%
Cap rate
1.1%
Rent to Value Ratio