Miami, FL Investment Properties for Sale
Browse homes for sale and investment properties in Miami, FL. Refine your search by price, property type, or more.
Best cash flowing properties in Miami, FL
Active
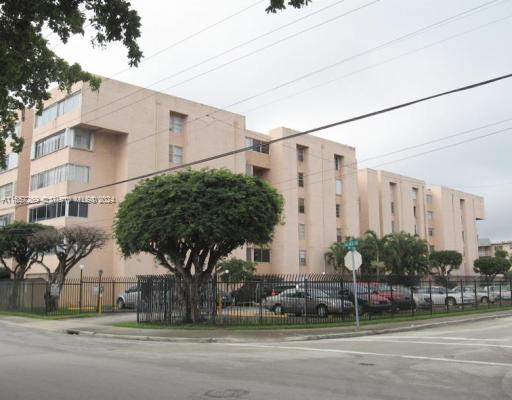
$229,000
2
bds
|
1
ba
|
685
sqft
|
built
1974
750 NW 43rd Ave, Miami, FL 33126
$-297
Cash flow
-6.8%
Cash-on-Cash Return
4.7%
Cap rate
0.9%
Rent to Value Ratio
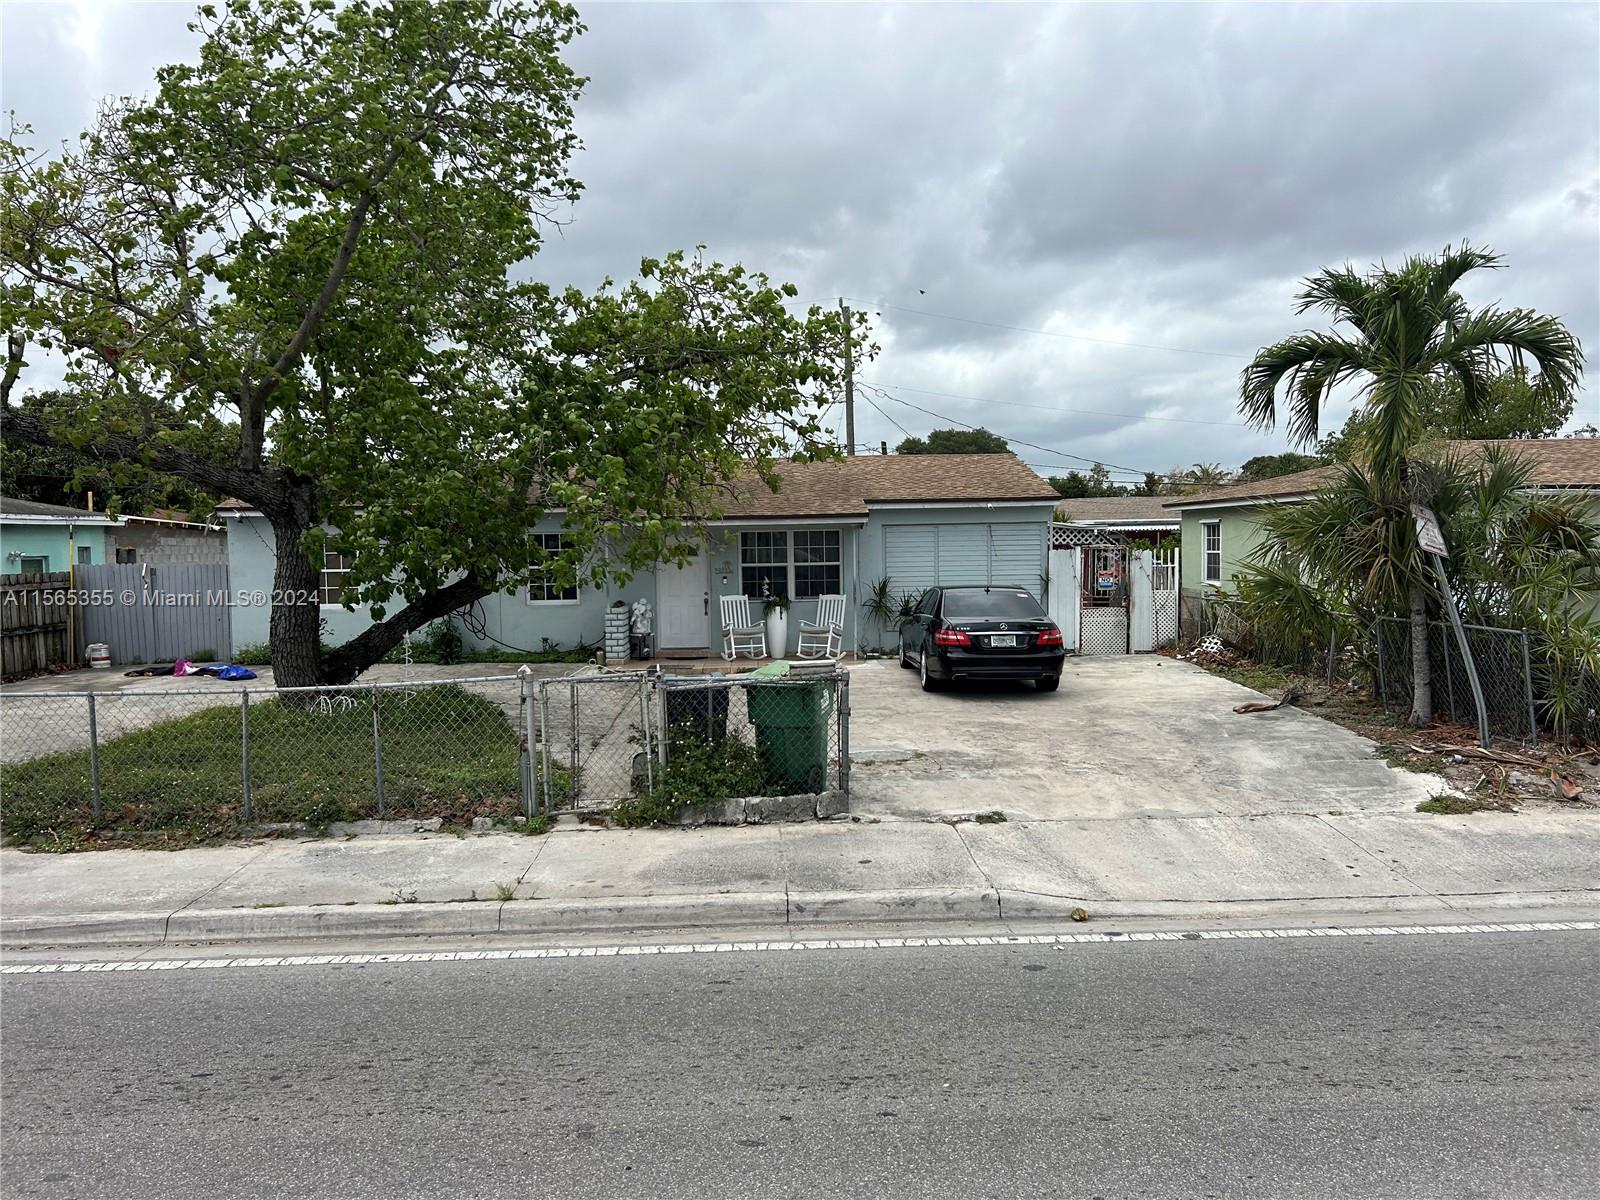
Active
$400,000
3
bds
|
1
ba
|
950
sqft
|
built
1953
9030 NW 32nd Ave, Miami, FL 33147
$-468
Cash flow
-6.1%
Cash-on-Cash Return
4.9%
Cap rate
0.6%
Rent to Value Ratio
6,275 out of 7,122 properties for sale in Miami, FL
Limited Results Shown
Create a free account, or log in to reveal all property listings and enjoy the complete experience.
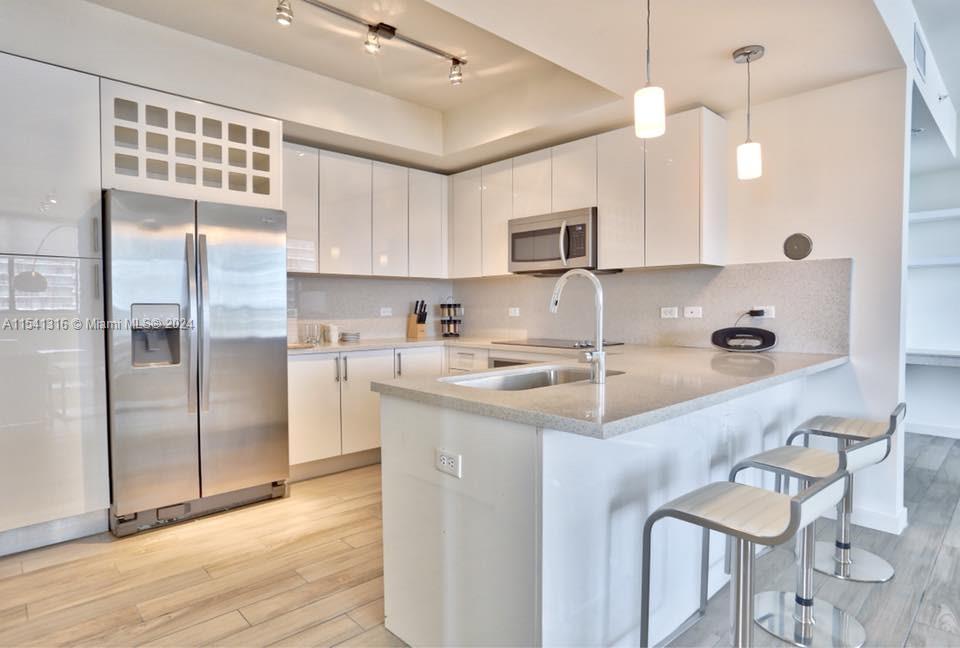
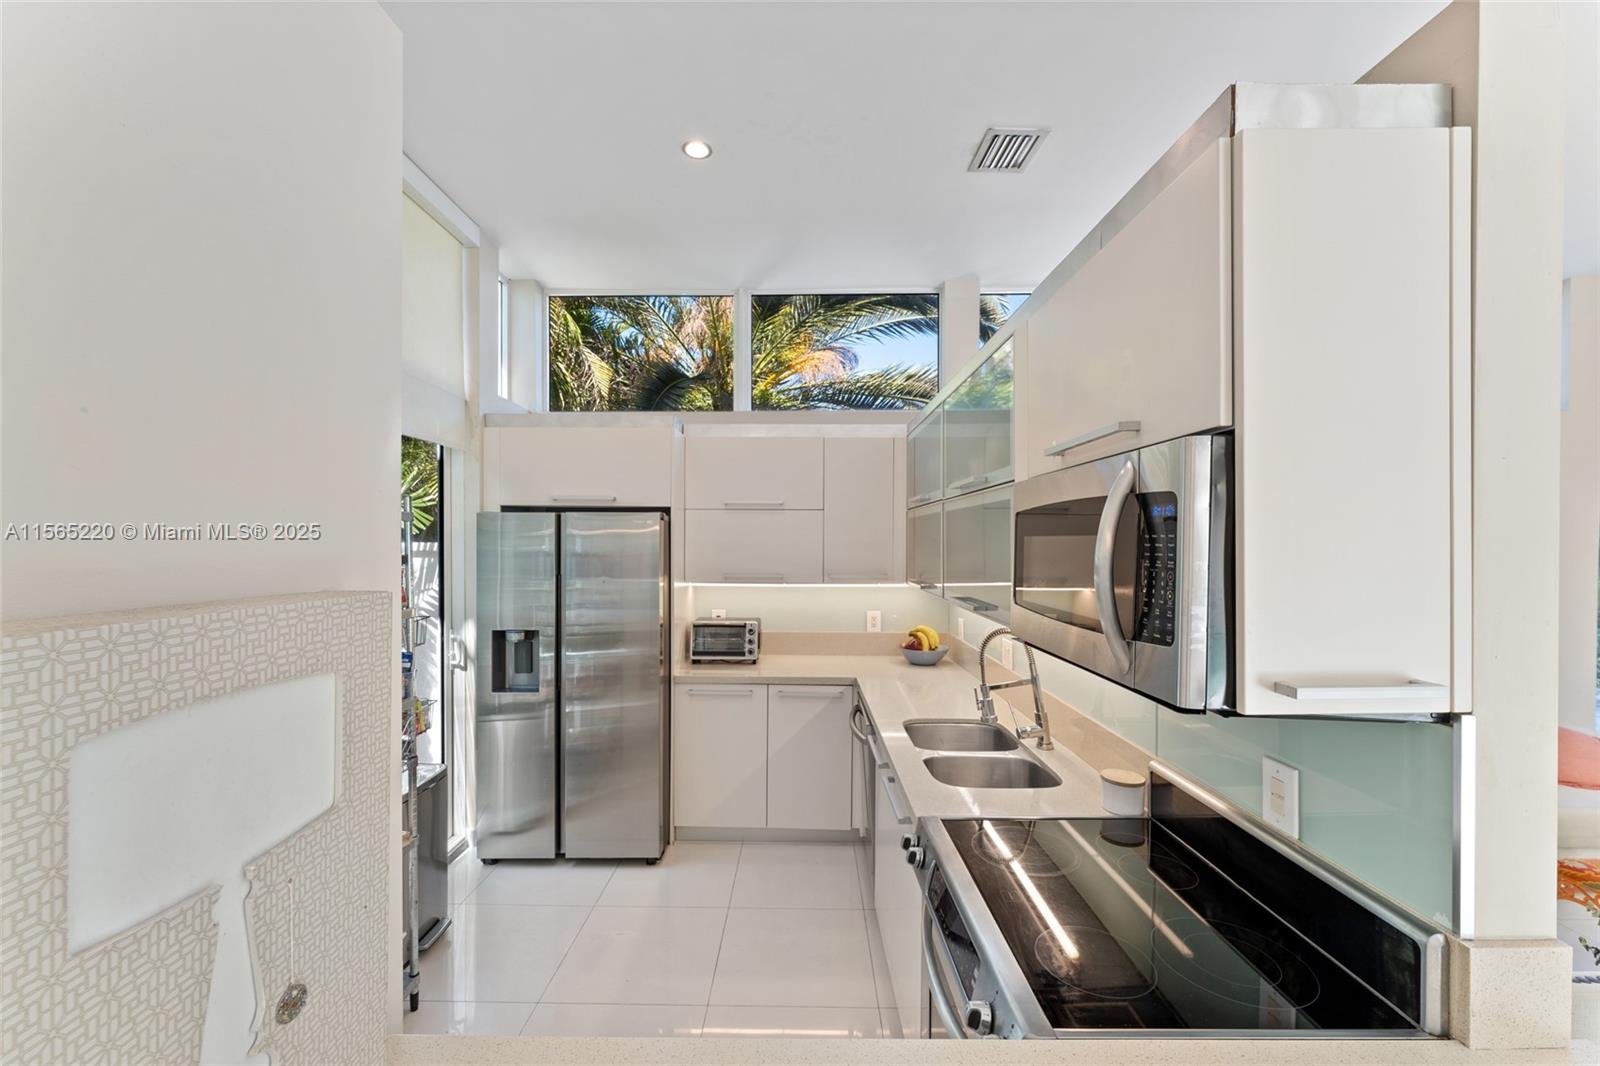
Active
$700,000
2
bds
|
2
ba
|
1,228
sqft
|
built
2015
999 SW 1st Ave, Miami, FL 33130
$-2,439
Cash flow
-18.2%
Cash-on-Cash Return
2.1%
Cap rate
0.7%
Rent to Value Ratio
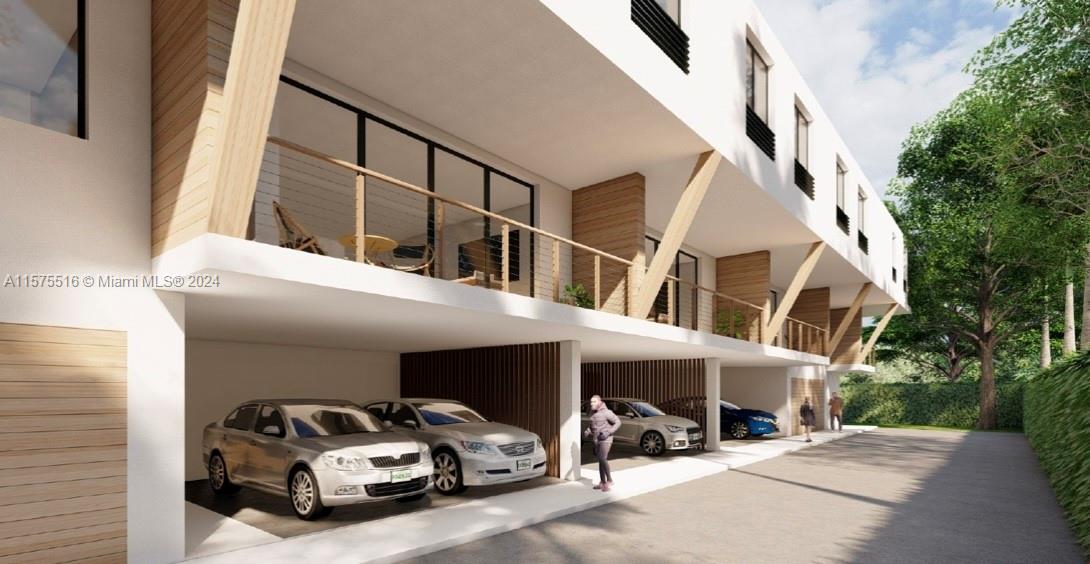
Active
$689,000
3
bds
|
2
ba
|
844
sqft
|
built
1935
737 NW 30th St, Miami, FL 33127
$-1,662
Cash flow
-12.6%
Cash-on-Cash Return
3.4%
Cap rate
0.6%
Rent to Value Ratio
Active
$199,000
2
bds
|
2
ba
|
1,036
sqft
|
built
1972
496 NW 165th Street Rd, Miami, FL 33169
$-619
Cash flow
-16.2%
Cash-on-Cash Return
2.6%
Cap rate
1.1%
Rent to Value Ratio
Active
$699,000
3
bds
|
3
ba
|
1,204
sqft
|
built
1958
7945 SW 9th Ter, Miami, FL 33144
$-1,646
Cash flow
-12.3%
Cash-on-Cash Return
3.5%
Cap rate
0.5%
Rent to Value Ratio
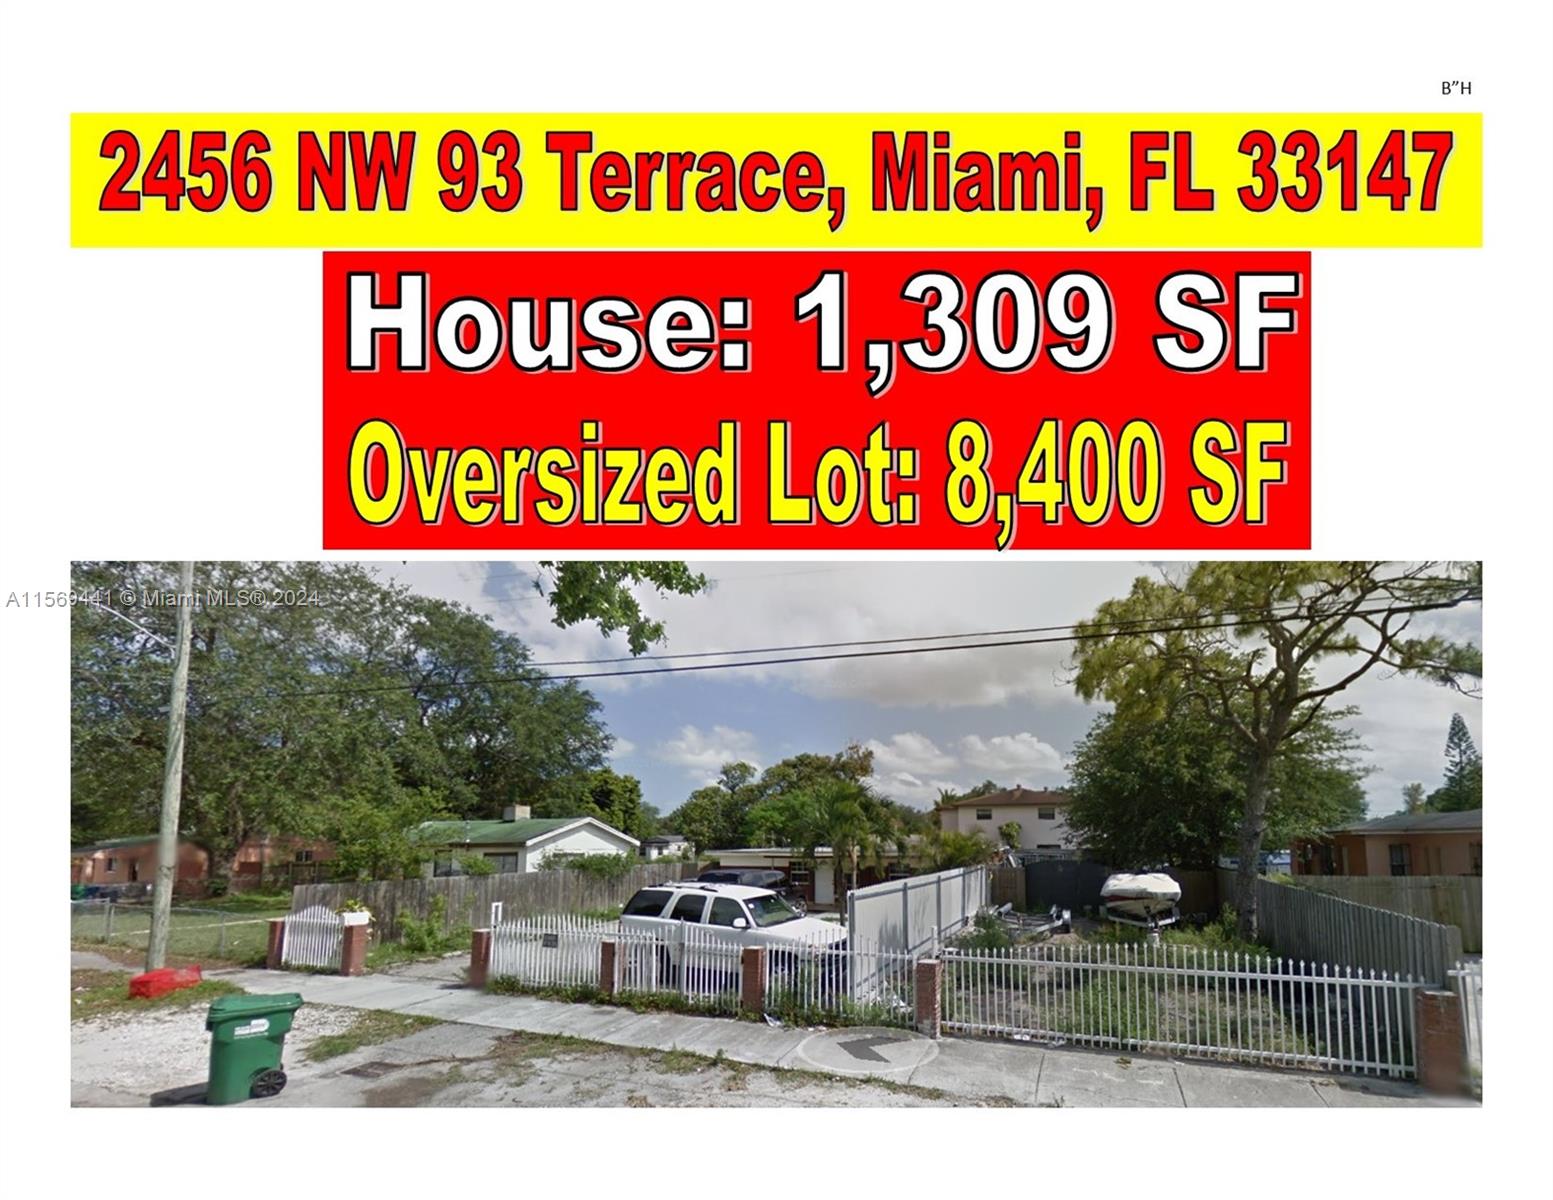
Active
$550,000
4
bds
|
3
ba
|
1,309
sqft
|
built
1947
2456 NW 93rd Ter, Miami, FL 33147
$-1,098
Cash flow
-10.4%
Cash-on-Cash Return
3.9%
Cap rate
0.6%
Rent to Value Ratio
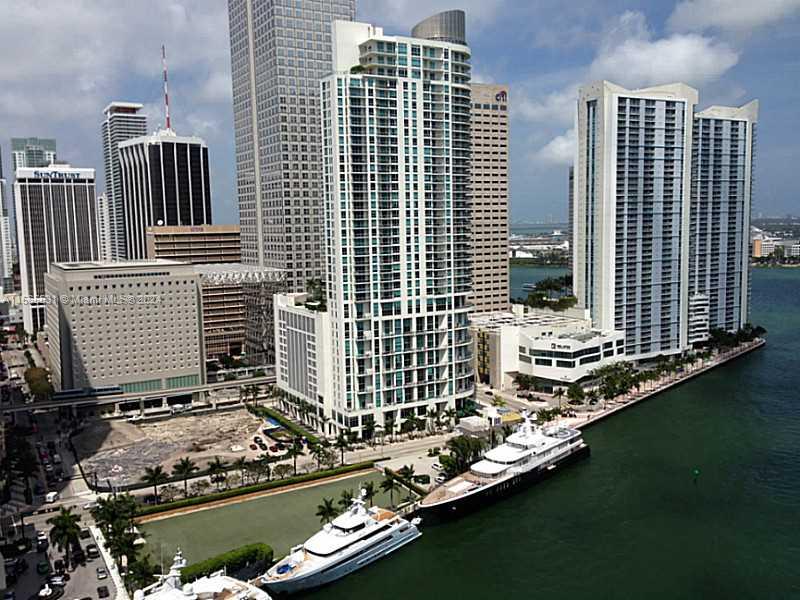
Active
$780,000
2
bds
|
2
ba
|
1,183
sqft
|
built
2004
1200 Brickell Bay Dr, Miami, FL 33131
$-2,326
Cash flow
-15.6%
Cash-on-Cash Return
2.7%
Cap rate
0.6%
Rent to Value Ratio
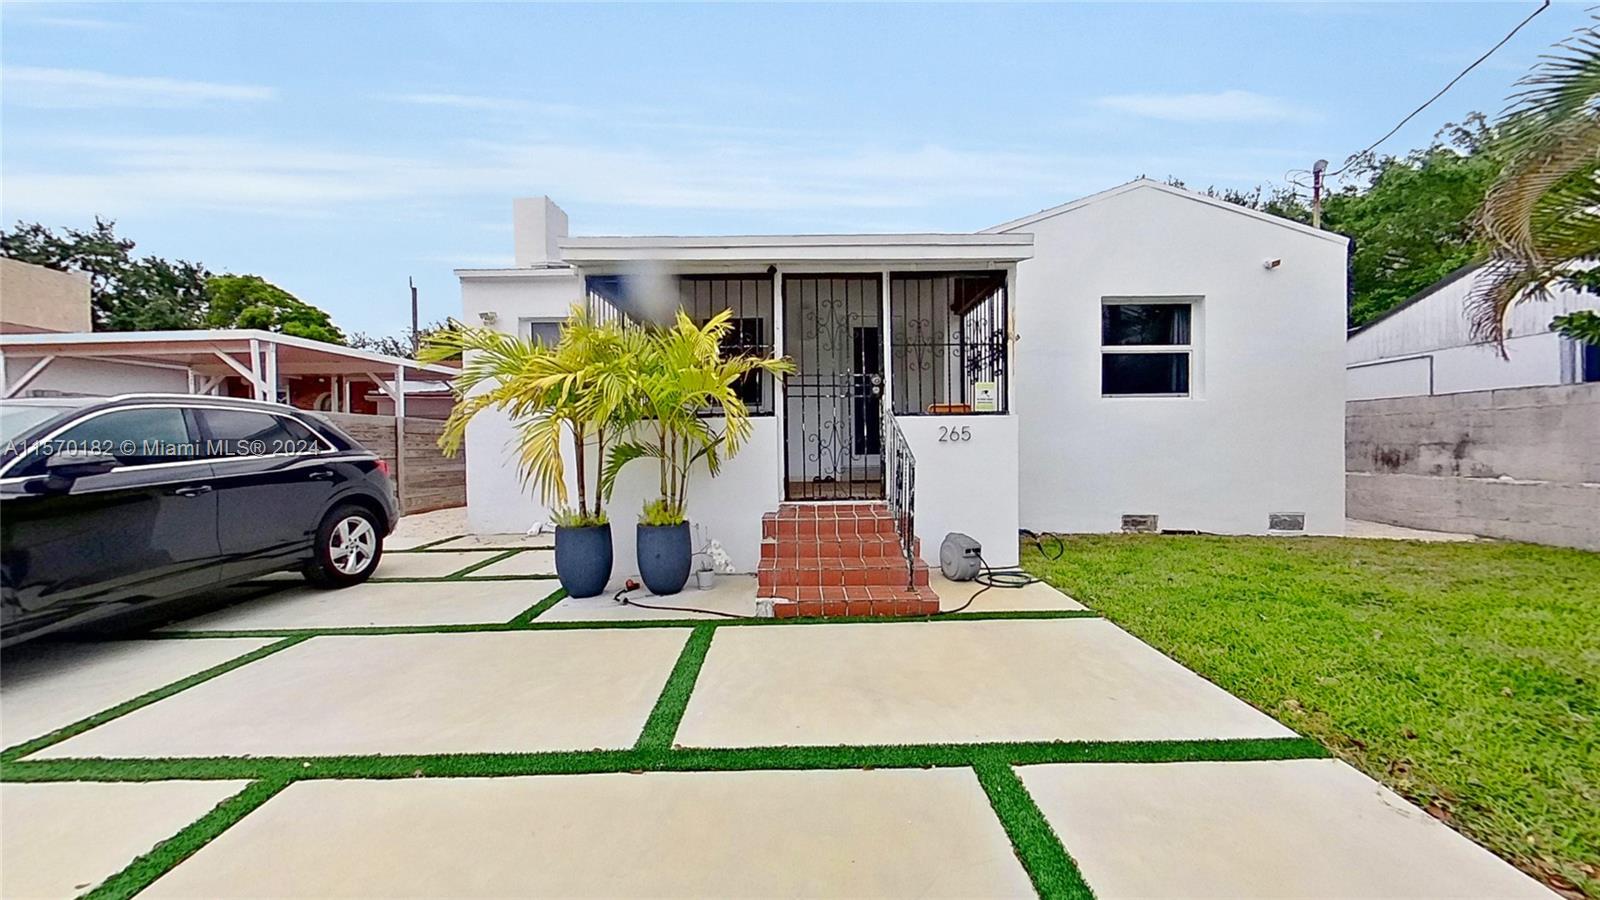
Active
$795,000
3
bds
|
2
ba
|
1,486
sqft
|
built
1949
265 NW 44th St, Miami, FL 33127
$-1,727
Cash flow
-11.3%
Cash-on-Cash Return
3.7%
Cap rate
0.6%
Rent to Value Ratio
Active
$720,000
3
bds
|
2
ba
|
1,493
sqft
|
built
1916
627 SW 11th Ave, Miami, FL 33130
$-1,689
Cash flow
-12.2%
Cash-on-Cash Return
3.5%
Cap rate
0.5%
Rent to Value Ratio
Active
$620,000
4
bds
|
2
ba
|
1,594
sqft
|
built
1940
1877 SW 6th St, Miami, FL 33135
$-1,439
Cash flow
-12.1%
Cash-on-Cash Return
3.5%
Cap rate
0.6%
Rent to Value Ratio
Active
$380,000
3
bds
|
2
ba
|
752
sqft
|
built
1940
2255 NW 63rd St, Miami, FL 33147
$-499
Cash flow
-6.9%
Cash-on-Cash Return
4.7%
Cap rate
0.7%
Rent to Value Ratio
Active
$574,698
2
bds
|
2
ba
|
1,048
sqft
|
built
2008
1750 N Bayshore Dr, Miami, FL 33132
$-2,892
Cash flow
-26.3%
Cash-on-Cash Return
0.2%
Cap rate
0.7%
Rent to Value Ratio

Active
$350,000
3
bds
|
2
ba
|
1,200
sqft
|
built
1999
870 NE 212th Ter, Miami, FL 33179
$-593
Cash flow
-8.8%
Cash-on-Cash Return
4.3%
Cap rate
0.7%
Rent to Value Ratio
Active
$310,045
bds
|
1
ba
|
508
sqft
|
built
2008
1750 N Bayshore Dr, Miami, FL 33132
$-1,472
Cash flow
-24.8%
Cash-on-Cash Return
0.6%
Cap rate
0.7%
Rent to Value Ratio
Active
$359,000
1
bds
|
1
ba
|
526
sqft
|
built
2016
151 SE 1st St, Miami, FL 33131
$-1,068
Cash flow
-15.5%
Cash-on-Cash Return
2.7%
Cap rate
0.7%
Rent to Value Ratio
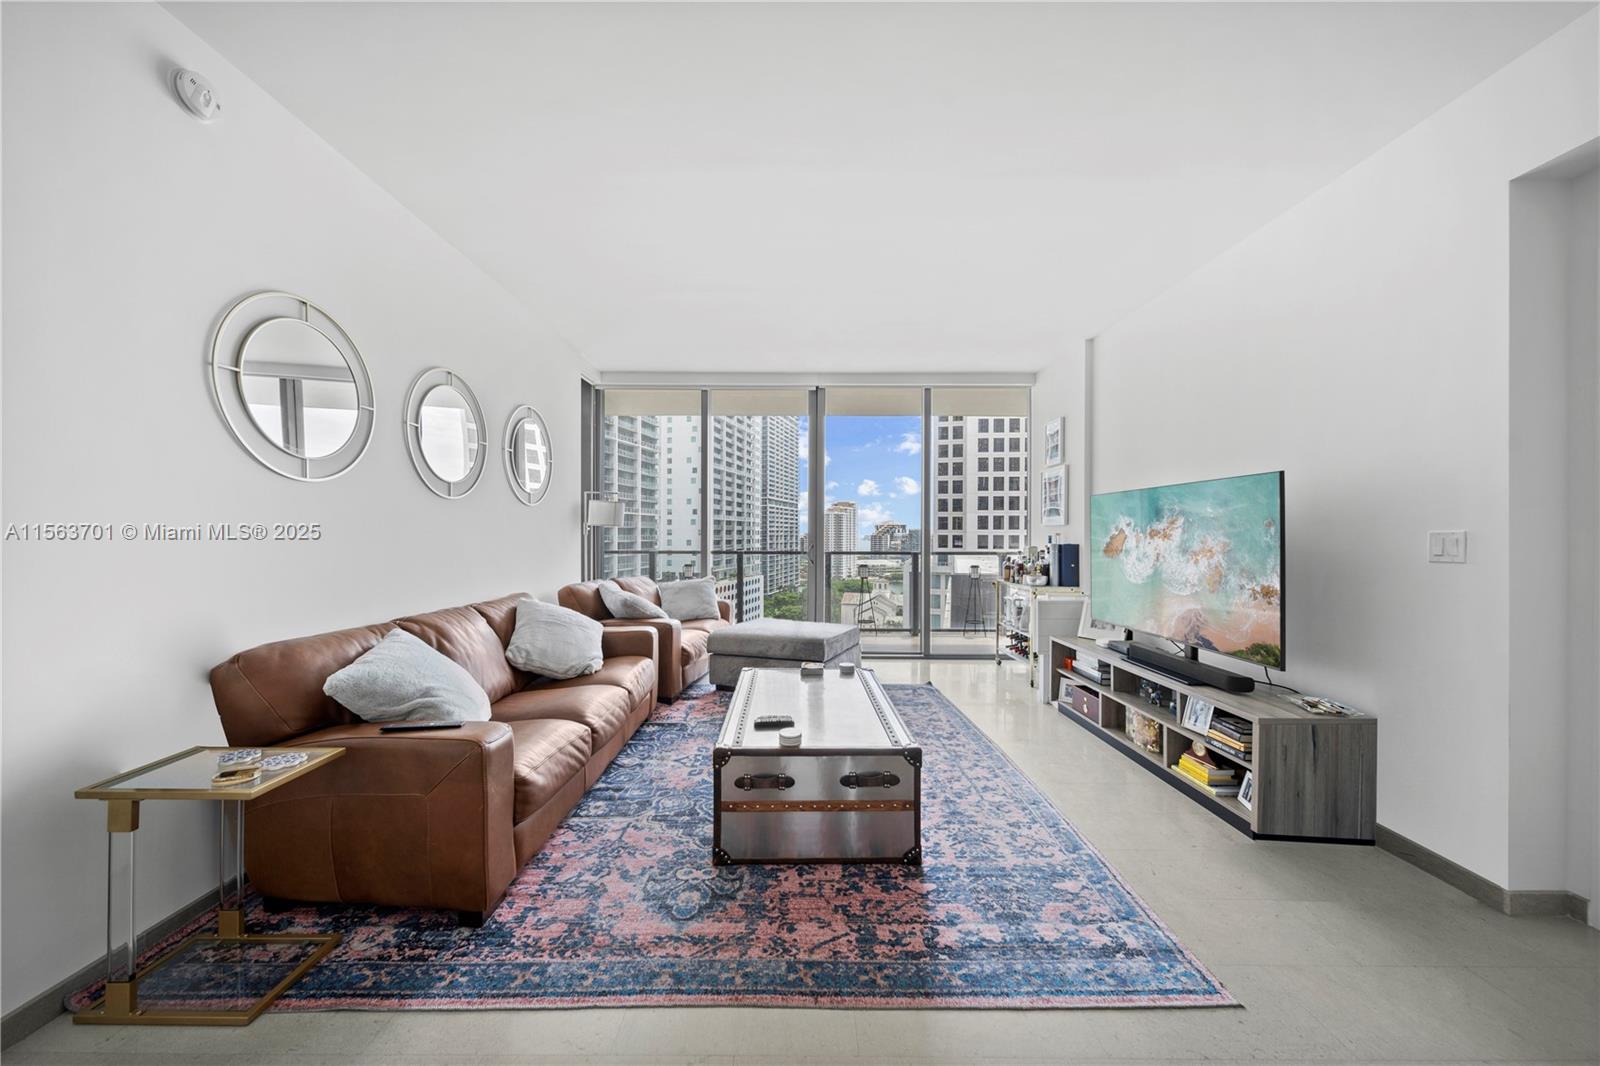
Active
$599,000
1
bds
|
1
ba
|
836
sqft
|
built
2005
1200 Brickell Bay Dr, Miami, FL 33131
$-1,823
Cash flow
-15.9%
Cash-on-Cash Return
2.6%
Cap rate
0.6%
Rent to Value Ratio
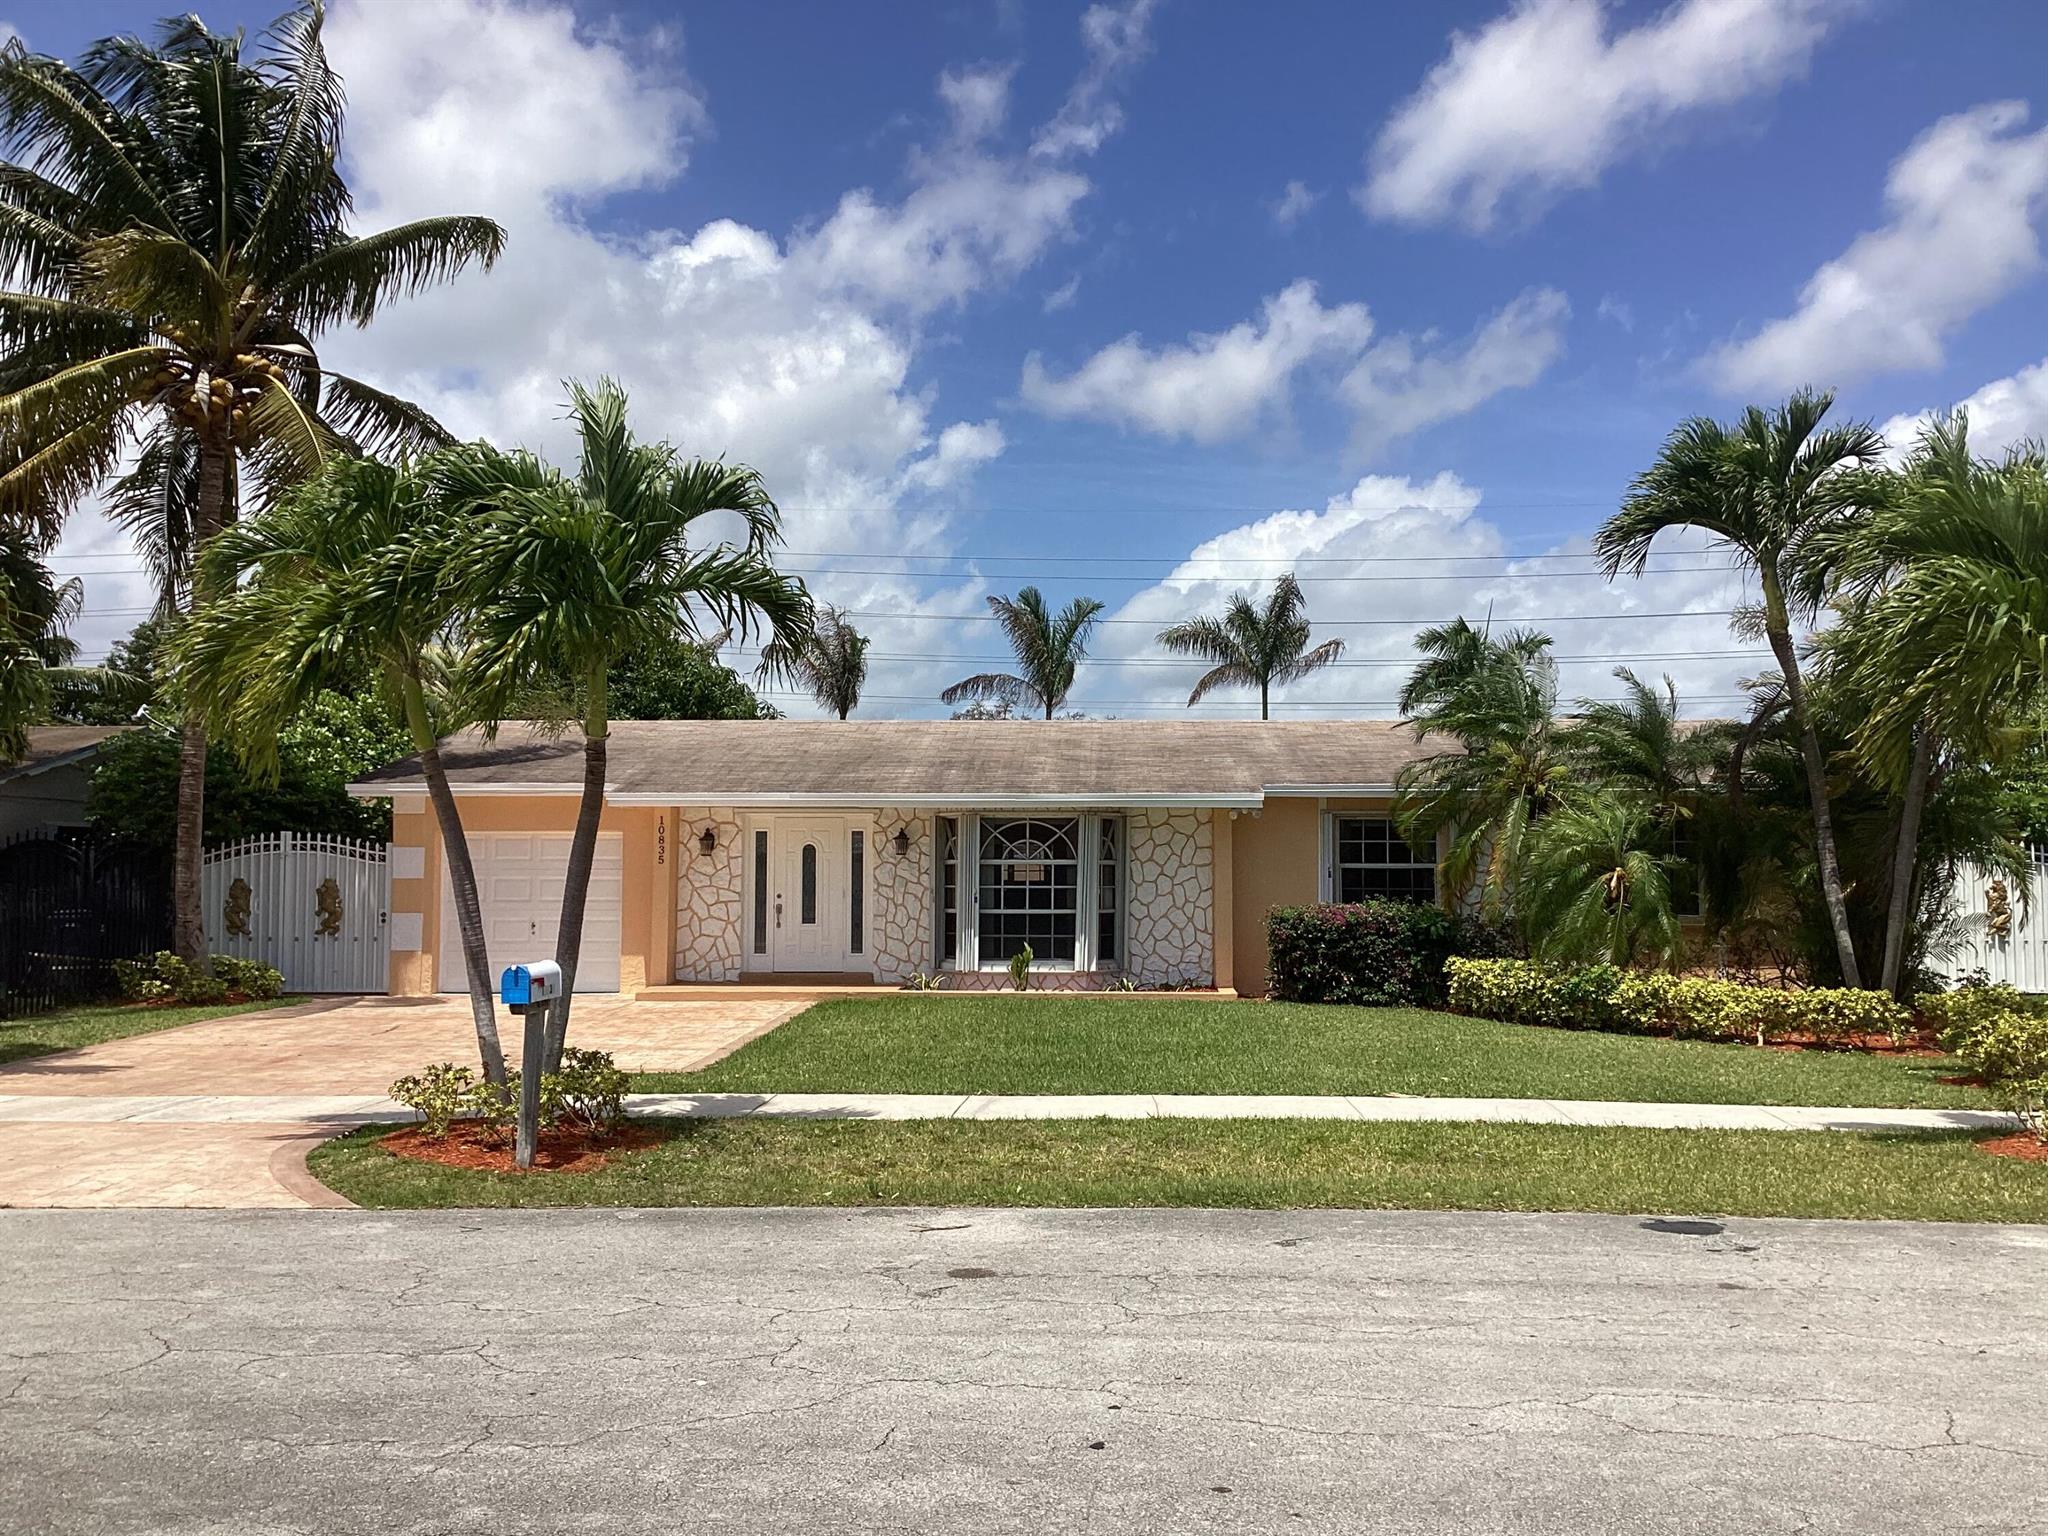
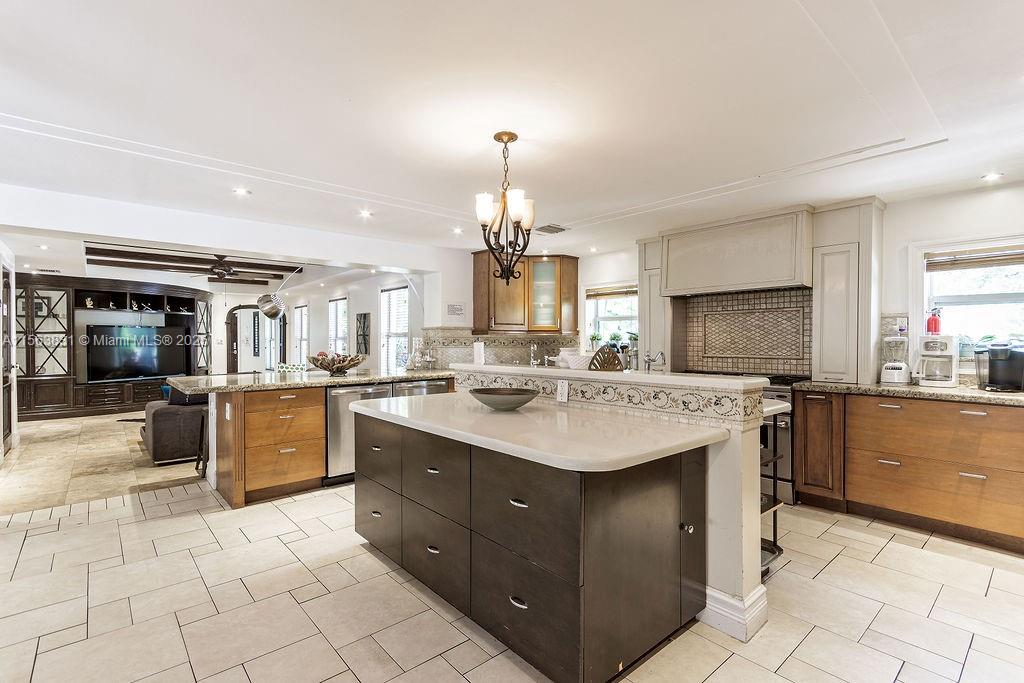
Active
$735,000
4
bds
|
2
ba
|
2,285
sqft
|
built
1974
10835 SW 152nd Ter, Miami, FL 33157
$-1,693
Cash flow
-12.0%
Cash-on-Cash Return
3.5%
Cap rate
0.5%
Rent to Value Ratio
Active
$590,462
2
bds
|
2
ba
|
1,048
sqft
|
built
2008
1750 N Bayshore Dr, Miami, FL 33132
$-2,979
Cash flow
-26.3%
Cash-on-Cash Return
0.2%
Cap rate
0.7%
Rent to Value Ratio
Active
$437,000
1
bds
|
2
ba
|
868
sqft
|
built
1975
1901 Brickell Ave, Miami, FL 33129
$-1,307
Cash flow
-15.6%
Cash-on-Cash Return
2.7%
Cap rate
0.7%
Rent to Value Ratio
Active
$585,000
2
bds
|
2
ba
|
1,075
sqft
|
built
2008
350 S Miami Ave, Miami, FL 33130
$-2,190
Cash flow
-19.5%
Cash-on-Cash Return
1.8%
Cap rate
0.7%
Rent to Value Ratio

Active
$625,000
2
bds
|
2
ba
|
1,018
sqft
|
built
2018
1600 NE 1st Ave, Miami, FL 33132
$-1,743
Cash flow
-14.6%
Cash-on-Cash Return
2.9%
Cap rate
0.7%
Rent to Value Ratio
Active
$349,000
2
bds
|
2
ba
|
500
sqft
|
built
1948
8016 NW 9th Ave, Miami, FL 33150
$-1,083
Cash flow
-16.2%
Cash-on-Cash Return
2.6%
Cap rate
0.5%
Rent to Value Ratio
Active
$3,850,000
5
bds
|
4
ba
|
3,518
sqft
|
built
1994
3950 Hardie Ave, Miami, FL 33133
$-14,993
Cash flow
-20.3%
Cash-on-Cash Return
1.6%
Cap rate
0.3%
Rent to Value Ratio
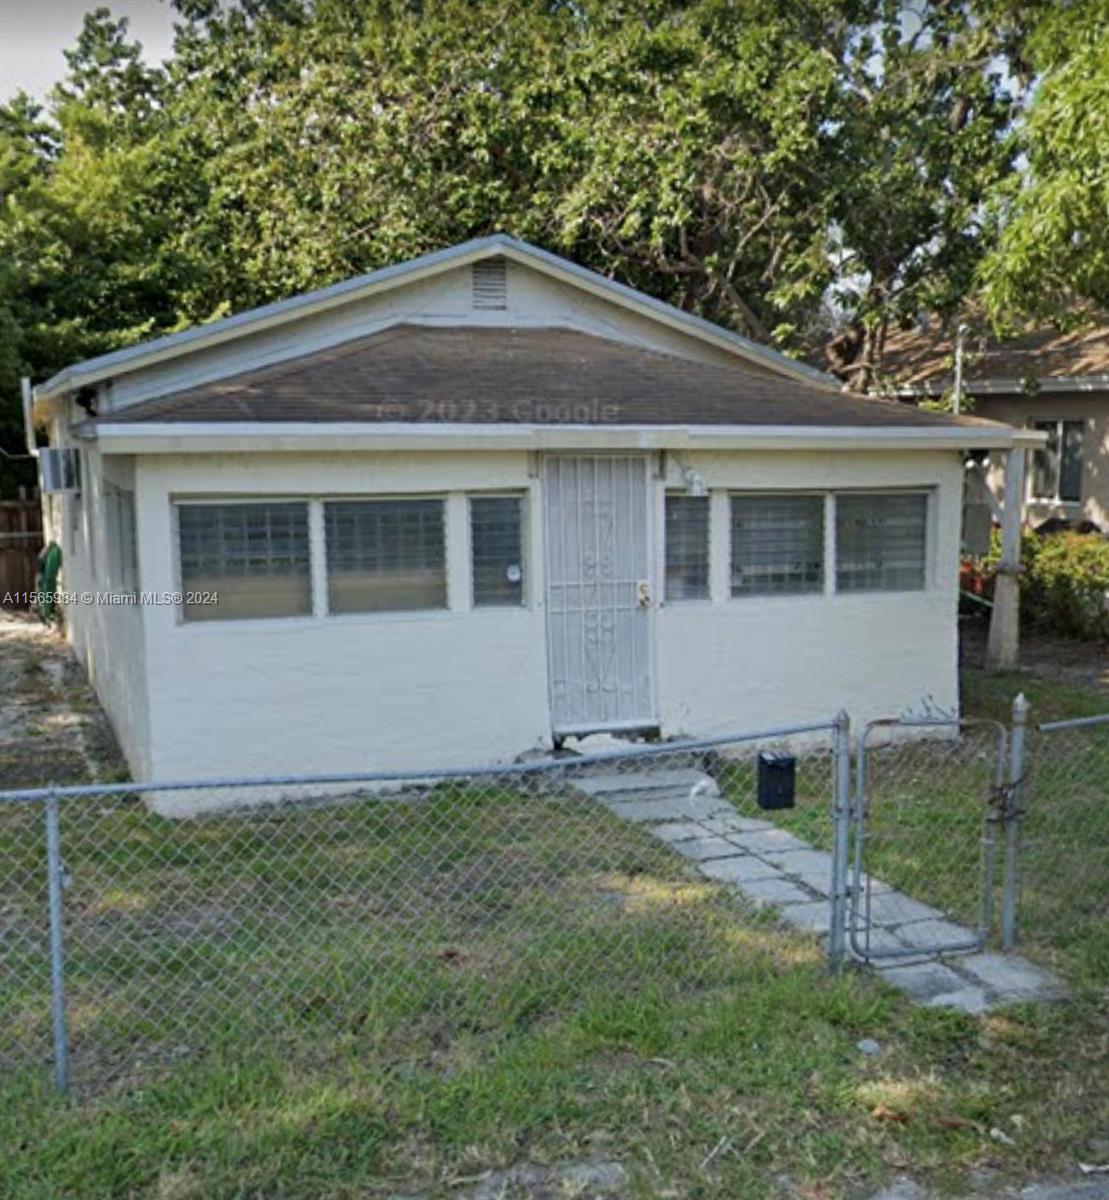
Active
$10,000,000
4
bds
|
0
ba
|
1,400
sqft
|
built
1959
3151 Mc Donald St, Miami, FL 33133
$-51,711
Cash flow
-27.0%
Cash-on-Cash Return
0.1%
Cap rate
0.0%
Rent to Value Ratio
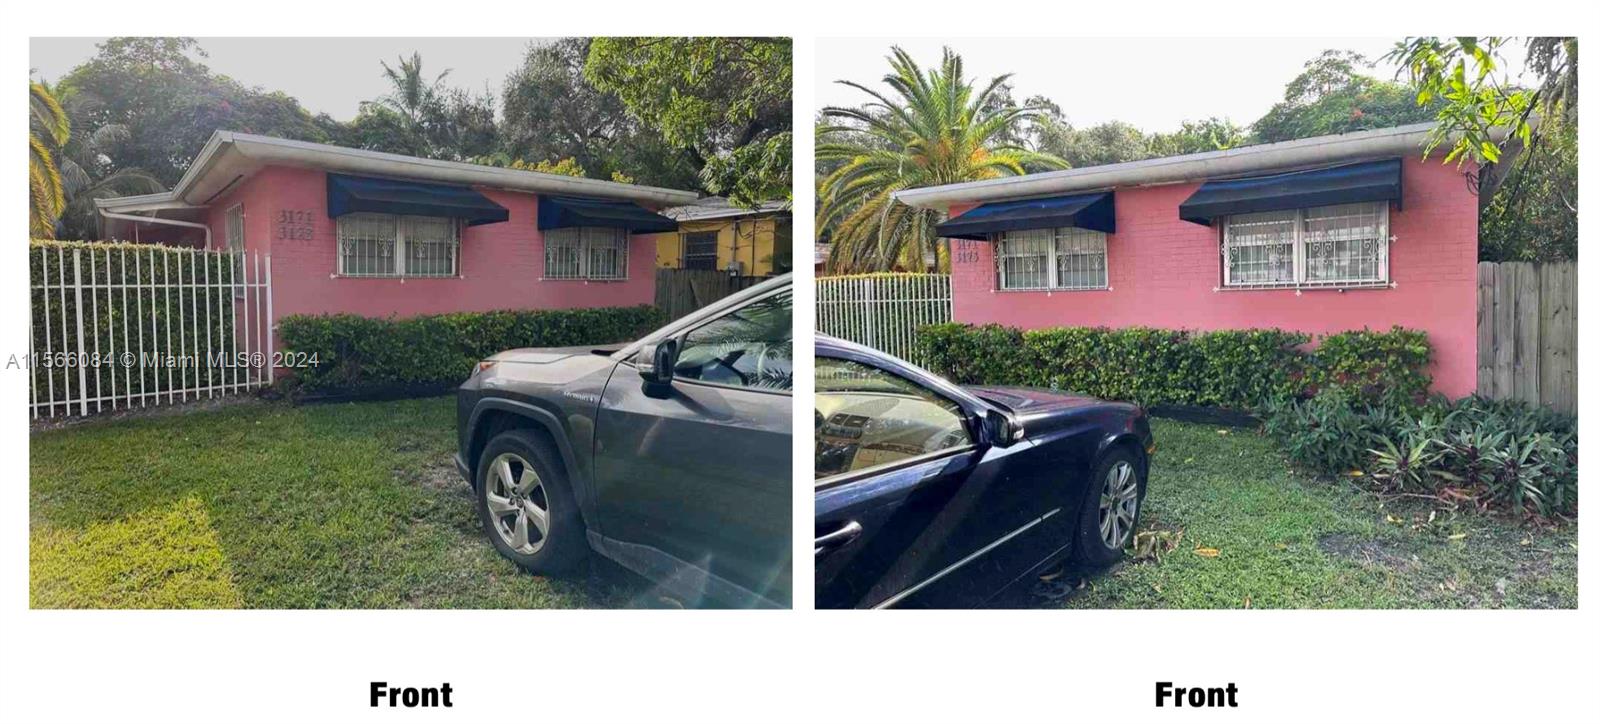
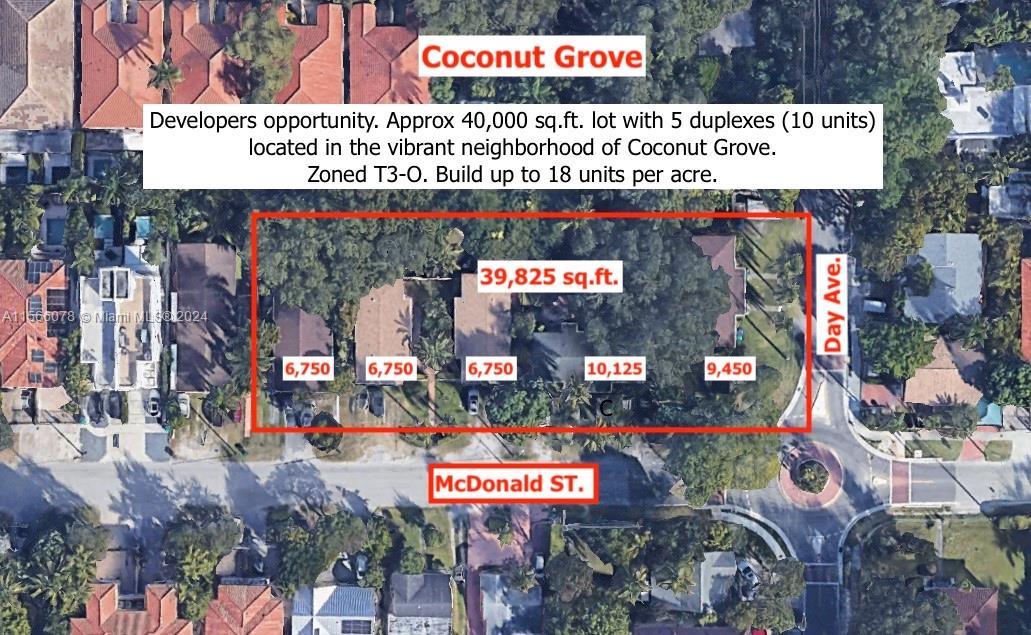
Active
$10,000,000
4
bds
|
0
ba
|
1,416
sqft
|
built
1955
3171 Mc Donald St, Miami, FL 33133
$-51,669
Cash flow
-27.0%
Cash-on-Cash Return
0.1%
Cap rate
0.0%
Rent to Value Ratio

Active
$10,000,000
4
bds
|
0
ba
|
1,500
sqft
|
built
1948
3181 Mc Donald St, Miami, FL 33133
$-51,501
Cash flow
-26.9%
Cash-on-Cash Return
0.1%
Cap rate
0.0%
Rent to Value Ratio

Active
$10,000,000
4
bds
|
0
ba
|
1,580
sqft
|
built
1948
3191 Day Ave, Miami, FL 33133
$-51,963
Cash flow
-27.1%
Cash-on-Cash Return
0.0%
Cap rate
0.0%
Rent to Value Ratio
Active
$1,500,000
4
bds
|
3
ba
|
2,448
sqft
|
built
2009
1884 SW 17th St, Miami, FL 33145
$-2,518
Cash flow
-8.8%
Cash-on-Cash Return
4.3%
Cap rate
0.6%
Rent to Value Ratio
Active
$229,000
2
bds
|
1
ba
|
685
sqft
|
built
1974
750 NW 43rd Ave, Miami, FL 33126
$-297
Cash flow
-6.8%
Cash-on-Cash Return
4.7%
Cap rate
0.9%
Rent to Value Ratio
Active
$950,000
2
bds
|
2
ba
|
0
sqft
|
built
2008
475 Brickell Ave, Miami, FL 33131
$-3,380
Cash flow
-18.6%
Cash-on-Cash Return
2.0%
Cap rate
0.6%
Rent to Value Ratio
Active
$1,050,000
2
bds
|
3
ba
|
1,244
sqft
|
built
2016
68 SE 6th St, Miami, FL 33131
$-4,579
Cash flow
-22.8%
Cash-on-Cash Return
1.1%
Cap rate
0.5%
Rent to Value Ratio
Active
$5,899,000
7
bds
|
7
ba
|
6,288
sqft
|
built
1939
1051 NE 89th St, Miami, FL 33138
$-28,651
Cash flow
-25.3%
Cash-on-Cash Return
0.5%
Cap rate
0.1%
Rent to Value Ratio

Active
$6,200,000
4
bds
|
6
ba
|
4,600
sqft
|
built
2019
1000 Biscayne Blvd, Miami, FL 33132
$-44,671
Cash flow
-37.6%
Cash-on-Cash Return
-2.4%
Cap rate
0.1%
Rent to Value Ratio
Active
$700,000
2
bds
|
3
ba
|
1,298
sqft
|
built
2008
60 SW 13th St, Miami, FL 33130
$-2,704
Cash flow
-20.2%
Cash-on-Cash Return
1.6%
Cap rate
0.7%
Rent to Value Ratio
Active
$1,300,000
2
bds
|
2
ba
|
1,269
sqft
|
built
2008
465 Brickell Ave, Miami, FL 33131
$-6,086
Cash flow
-24.4%
Cash-on-Cash Return
0.7%
Cap rate
0.4%
Rent to Value Ratio
Active
$3,500,000
3
bds
|
0
ba
|
4,956
sqft
|
built
1946
6255 NE Miami Pl, Miami, FL 33138
$-18,958
Cash flow
-28.3%
Cash-on-Cash Return
-0.2%
Cap rate
0.1%
Rent to Value Ratio
Active
$365,000
1
bds
|
1
ba
|
763
sqft
|
built
2005
275 NE 18th St, Miami, FL 33132
$-1,403
Cash flow
-20.1%
Cash-on-Cash Return
1.7%
Cap rate
0.7%
Rent to Value Ratio
Active
$455,000
1
bds
|
1
ba
|
671
sqft
|
built
1990
770 Claughton Island Dr, Miami, FL 33131
$-2,165
Cash flow
-24.8%
Cash-on-Cash Return
0.6%
Cap rate
0.5%
Rent to Value Ratio
Active
$400,000
3
bds
|
1
ba
|
950
sqft
|
built
1953
9030 NW 32nd Ave, Miami, FL 33147
$-468
Cash flow
-6.1%
Cash-on-Cash Return
4.9%
Cap rate
0.6%
Rent to Value Ratio
Active
$615,000
2
bds
|
2
ba
|
1,105
sqft
|
built
2005
335 S Biscayne Blvd, Miami, FL 33131
$-2,810
Cash flow
-23.8%
Cash-on-Cash Return
0.8%
Cap rate
0.6%
Rent to Value Ratio
Active
$350,000
2
bds
|
2
ba
|
803
sqft
|
built
2010
1871 NW South River Dr, Miami, FL 33125
$-1,510
Cash flow
-22.5%
Cash-on-Cash Return
1.1%
Cap rate
0.7%
Rent to Value Ratio