Miami, FL Investment Properties for Sale
Browse homes for sale and investment properties in Miami, FL. Refine your search by price, property type, or more.
Best cash flowing properties in Miami, FL
Active
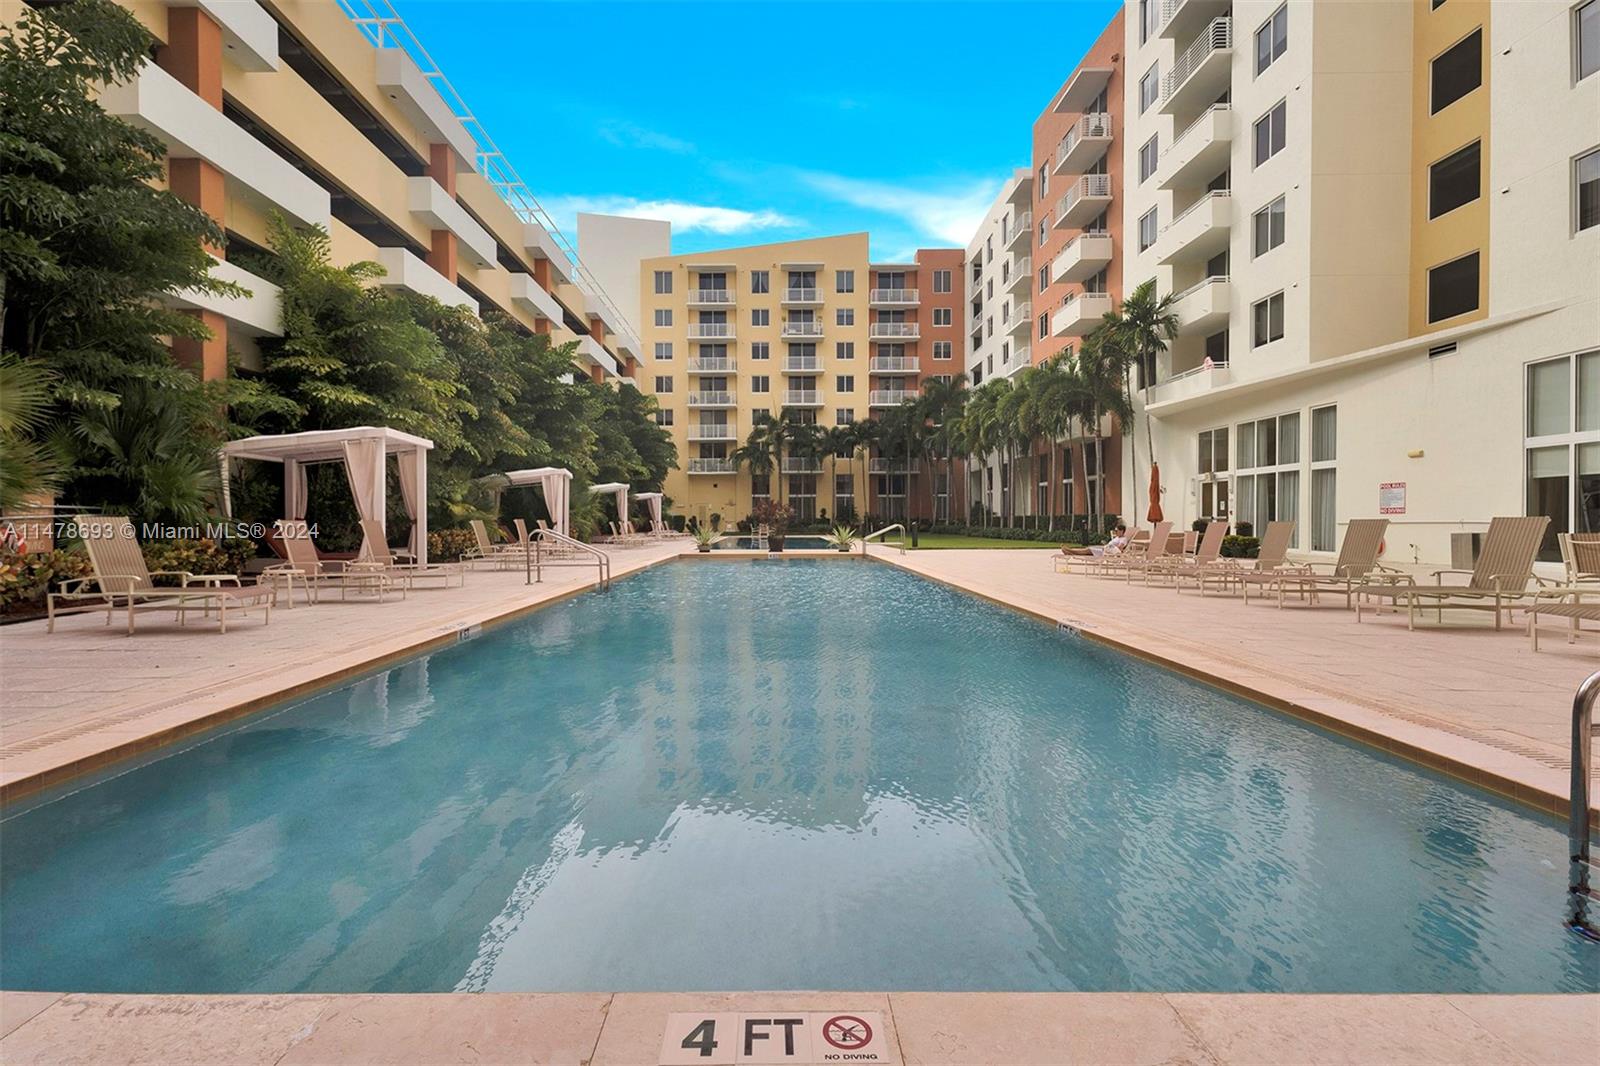
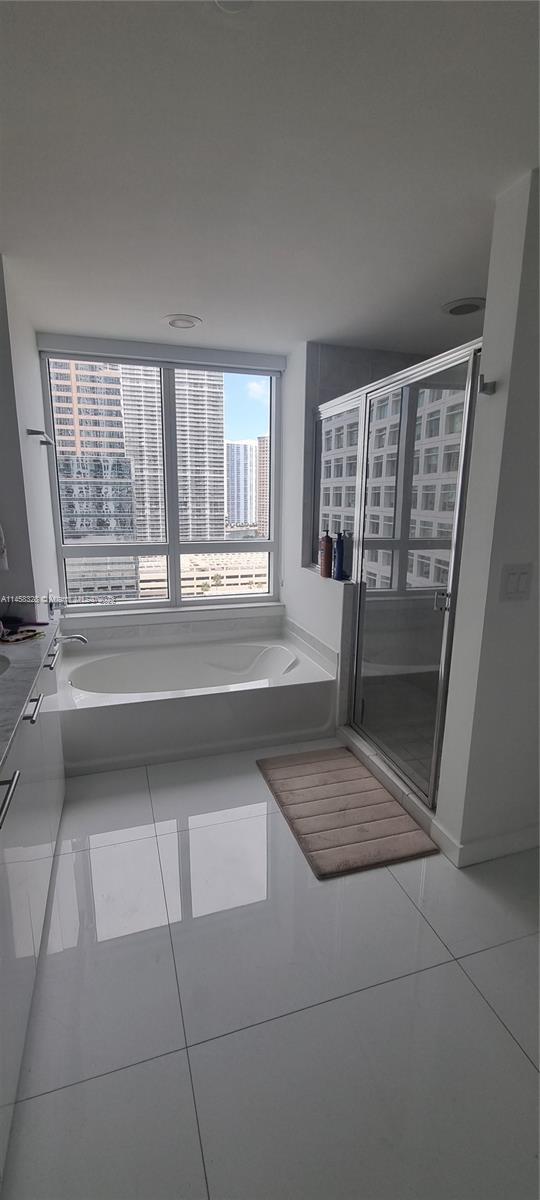
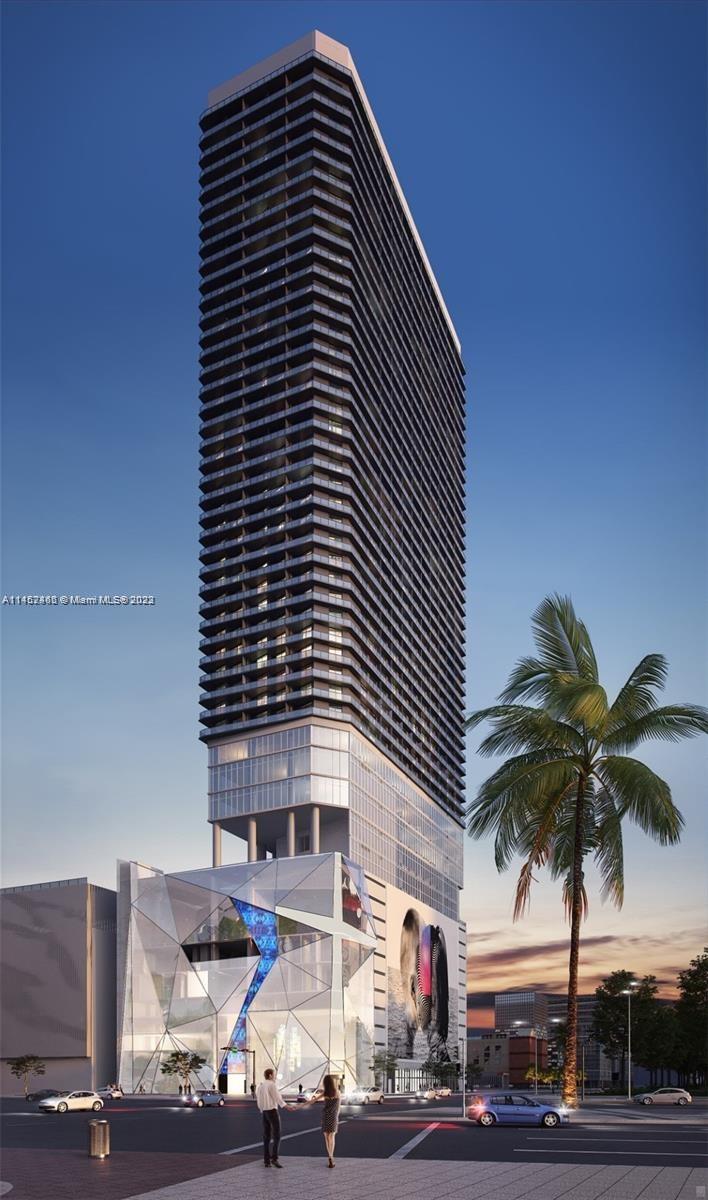
$699,999
2
bds
|
2
ba
|
1,190
sqft
|
built
2007
3250 NE 1st Ave, Miami, FL 33137
$-356
Cash flow
-2.7%
Cash-on-Cash Return
5.7%
Cap rate
1.0%
Rent to Value Ratio
Active
$219,900
3
bds
|
2
ba
|
1,954
sqft
|
built
1970
875 NE 195th St, Miami, FL 33179
$-364
Cash flow
-8.6%
Cash-on-Cash Return
4.3%
Cap rate
1.4%
Rent to Value Ratio
6,307 out of 7,161 properties for sale in Miami, FL
Limited Results Shown
Create a free account, or log in to reveal all property listings and enjoy the complete experience.
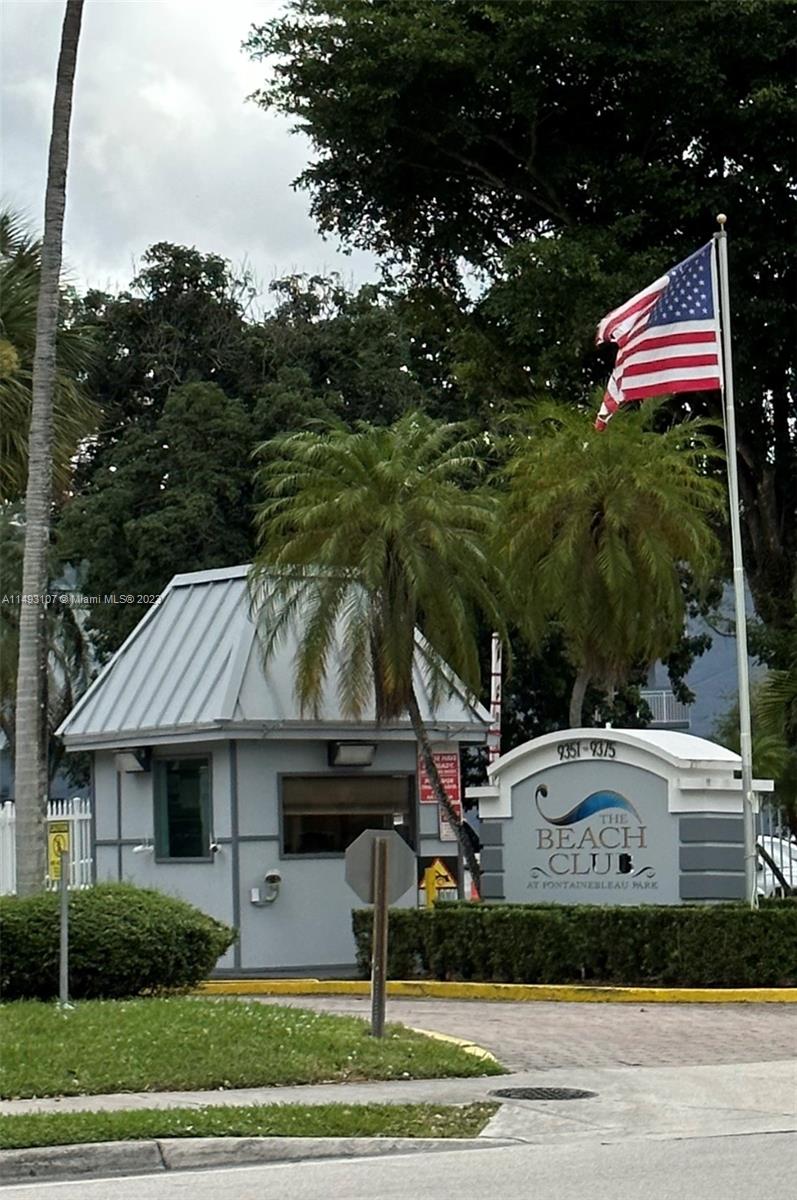
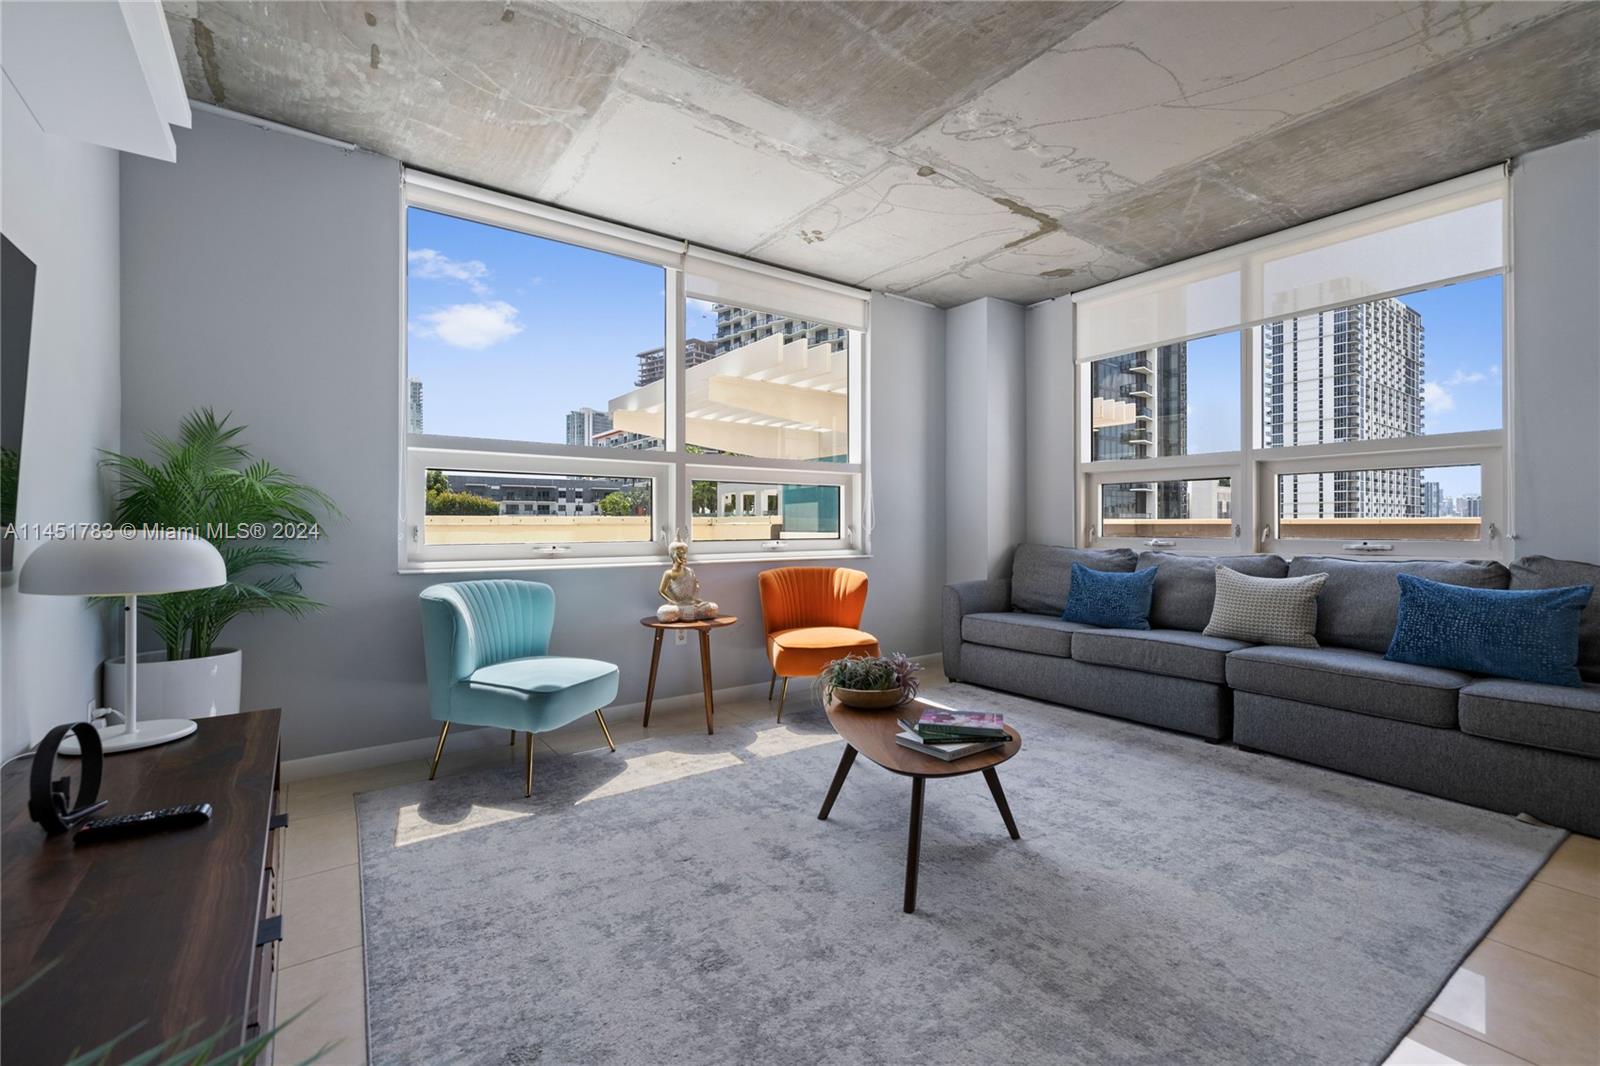
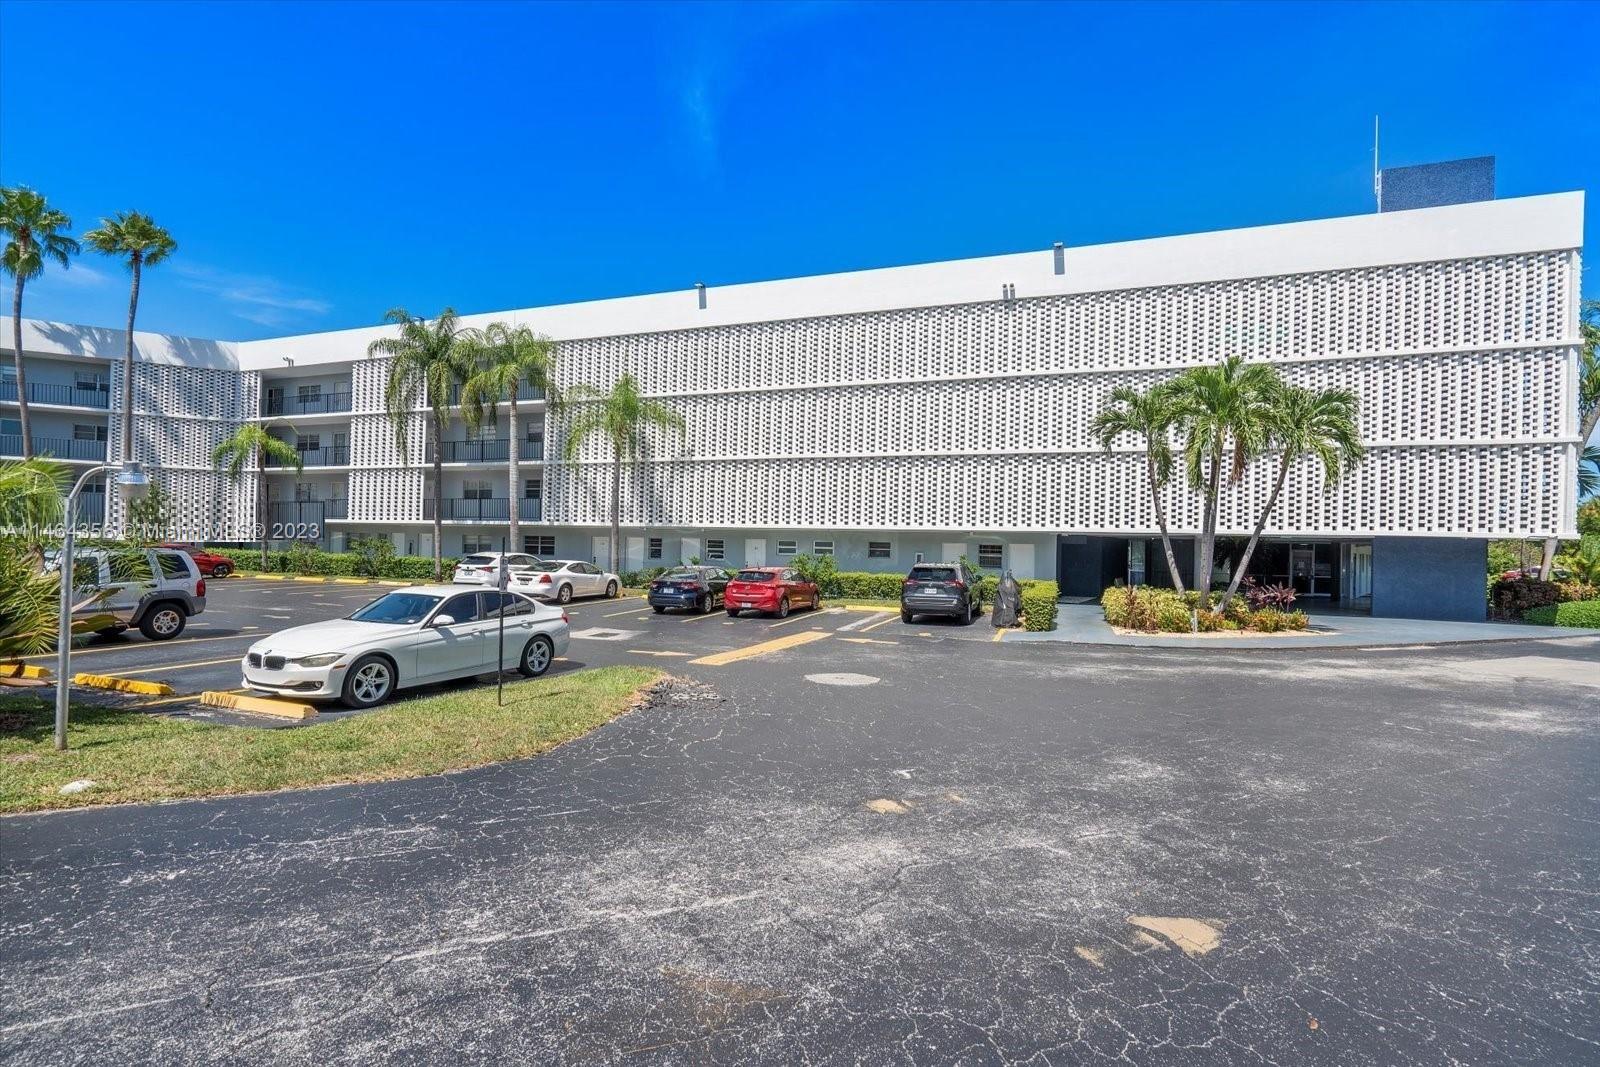
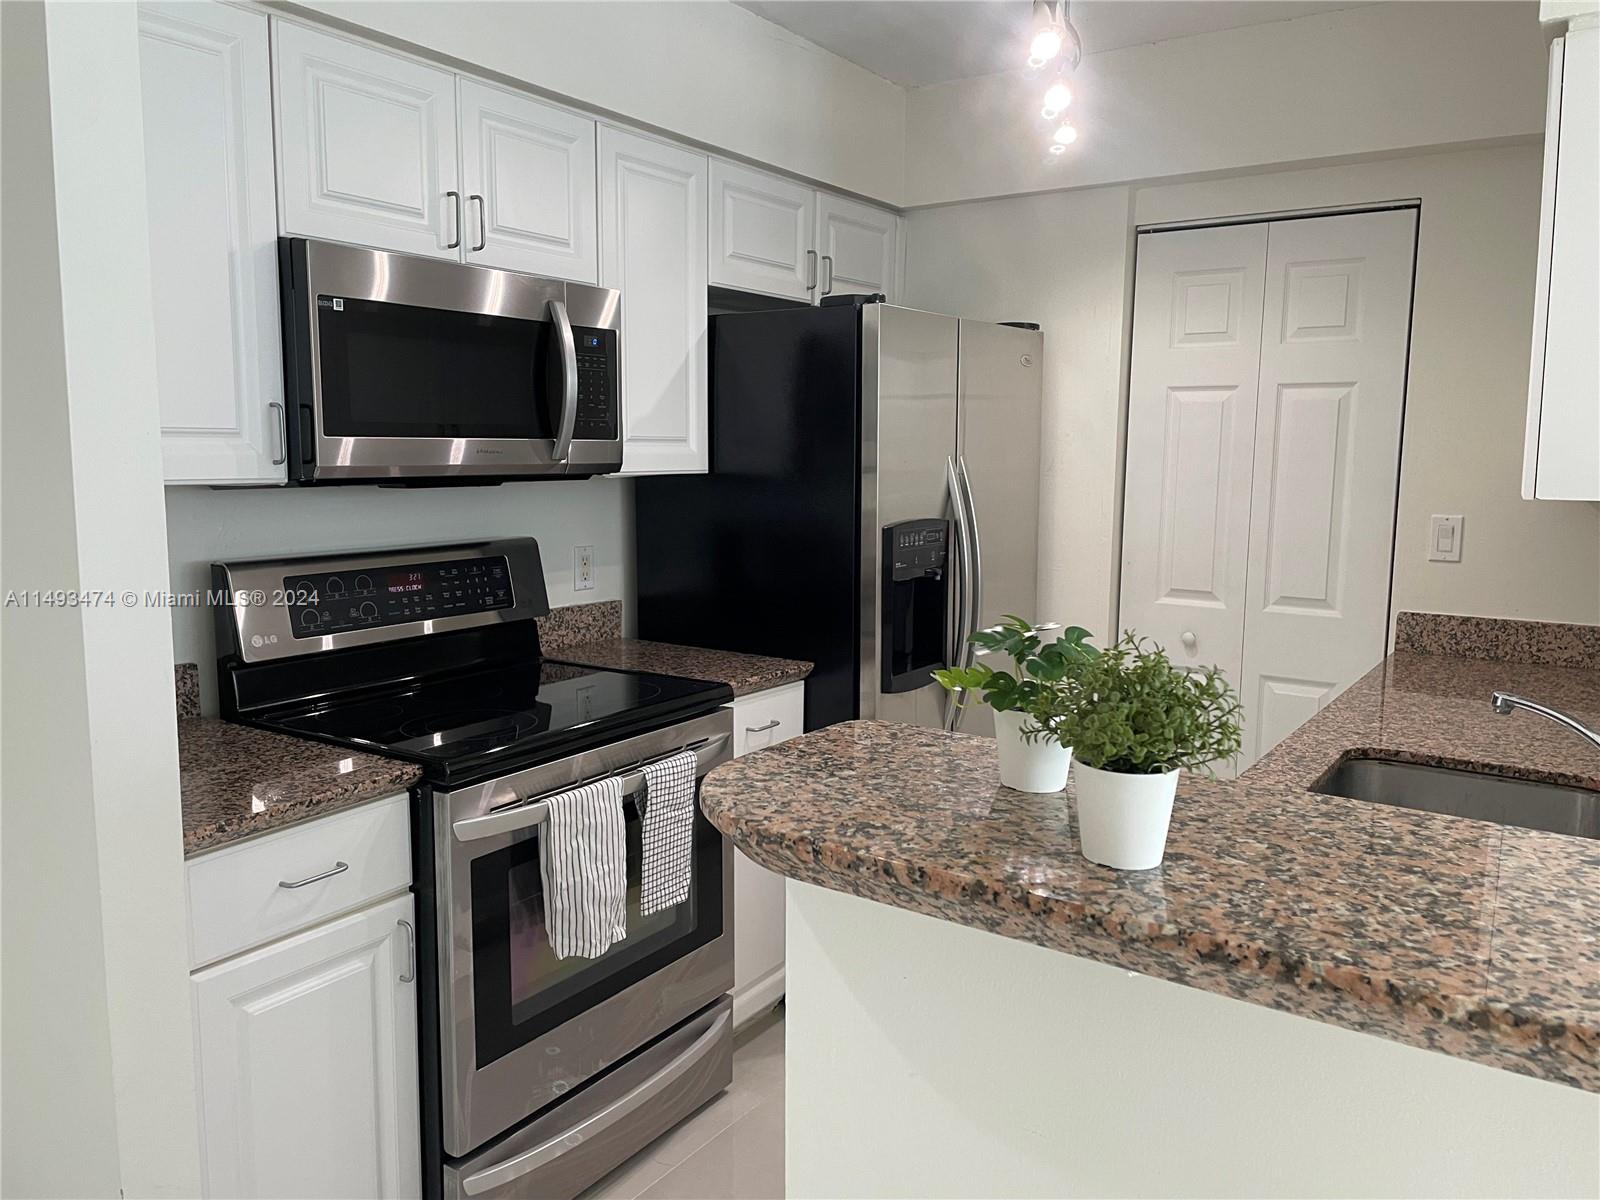
Active
$265,000
1
bds
|
2
ba
|
1,149
sqft
|
built
1972
9359 Fontainebleau Blvd, Miami, FL 33172
$-468
Cash flow
-9.2%
Cash-on-Cash Return
4.2%
Cap rate
0.8%
Rent to Value Ratio
Active
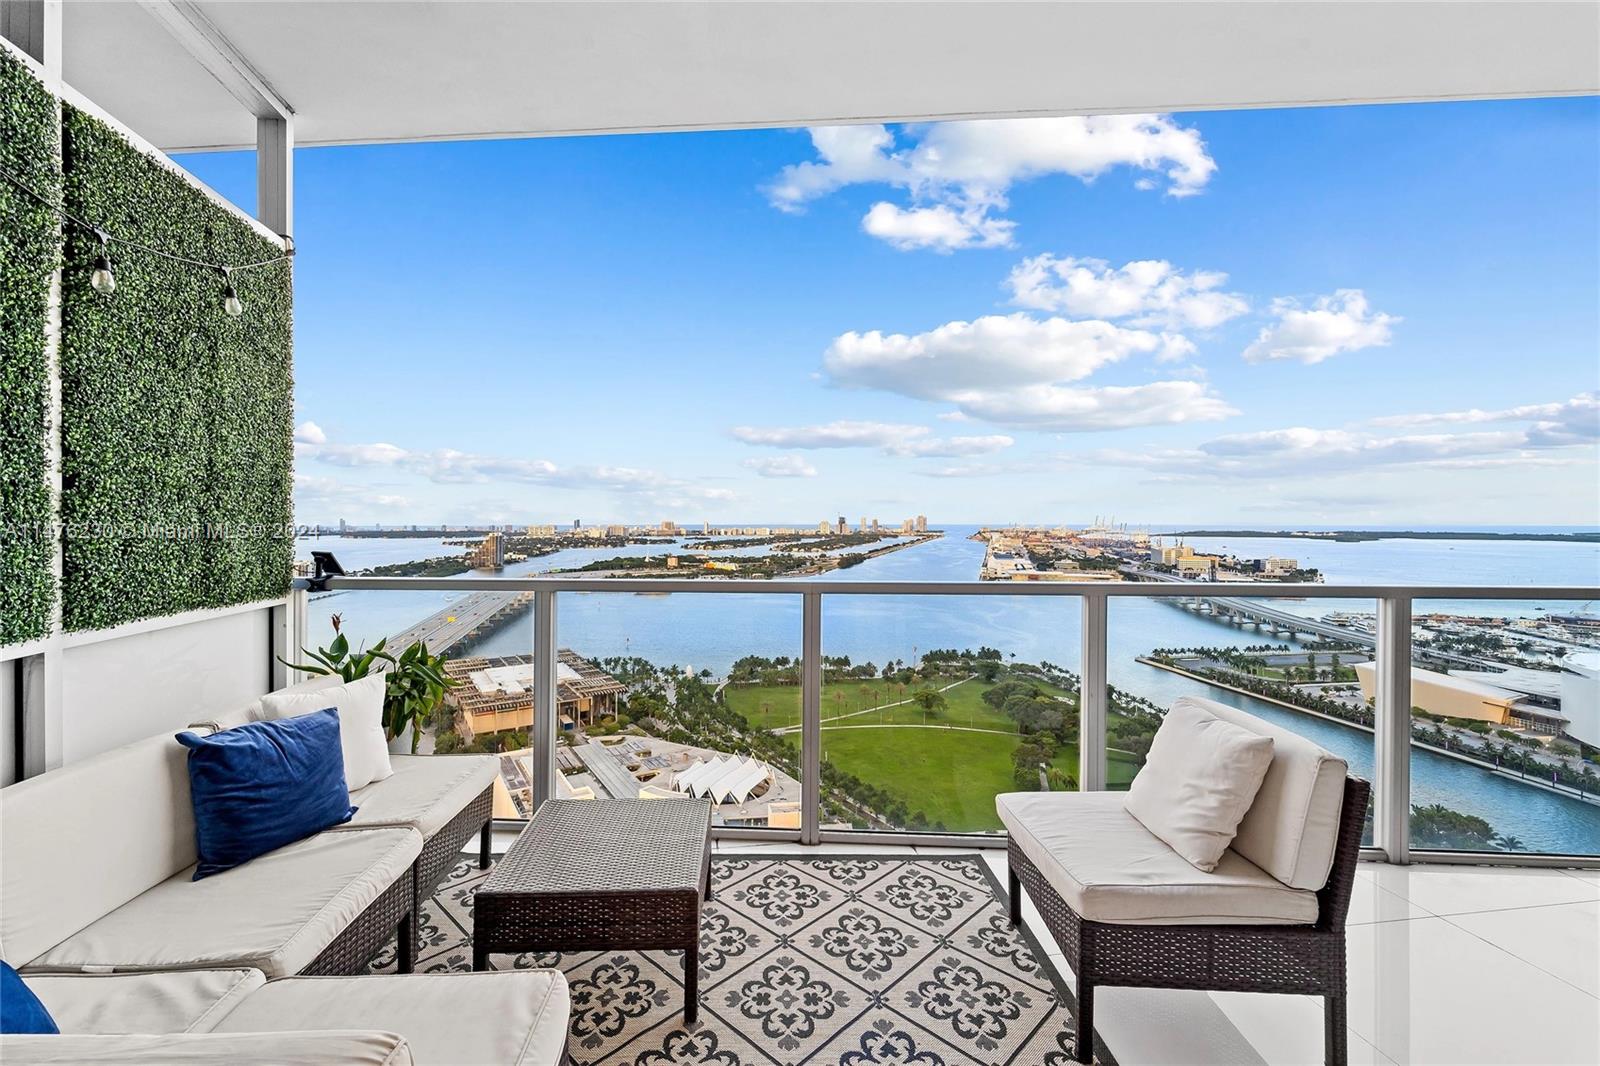
$399,900
1
bds
|
1
ba
|
750
sqft
|
built
2001
1155 Brickell Bay Dr, Miami, FL 33131
$-1,549
Cash flow
-20.2%
Cash-on-Cash Return
1.6%
Cap rate
0.8%
Rent to Value Ratio
Active
$795,000
1
bds
|
3
ba
|
938
sqft
|
built
2008
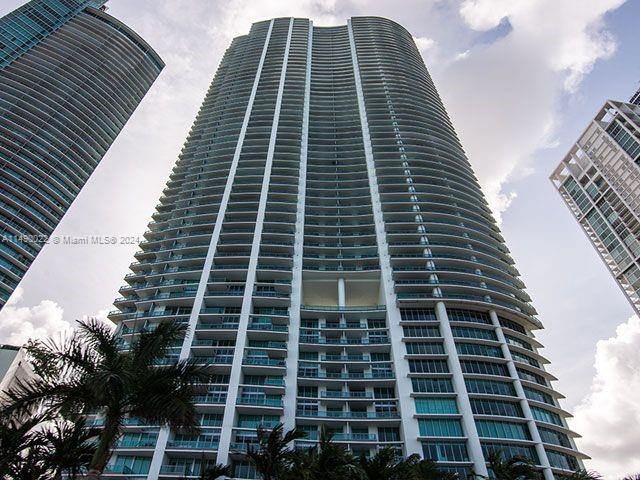
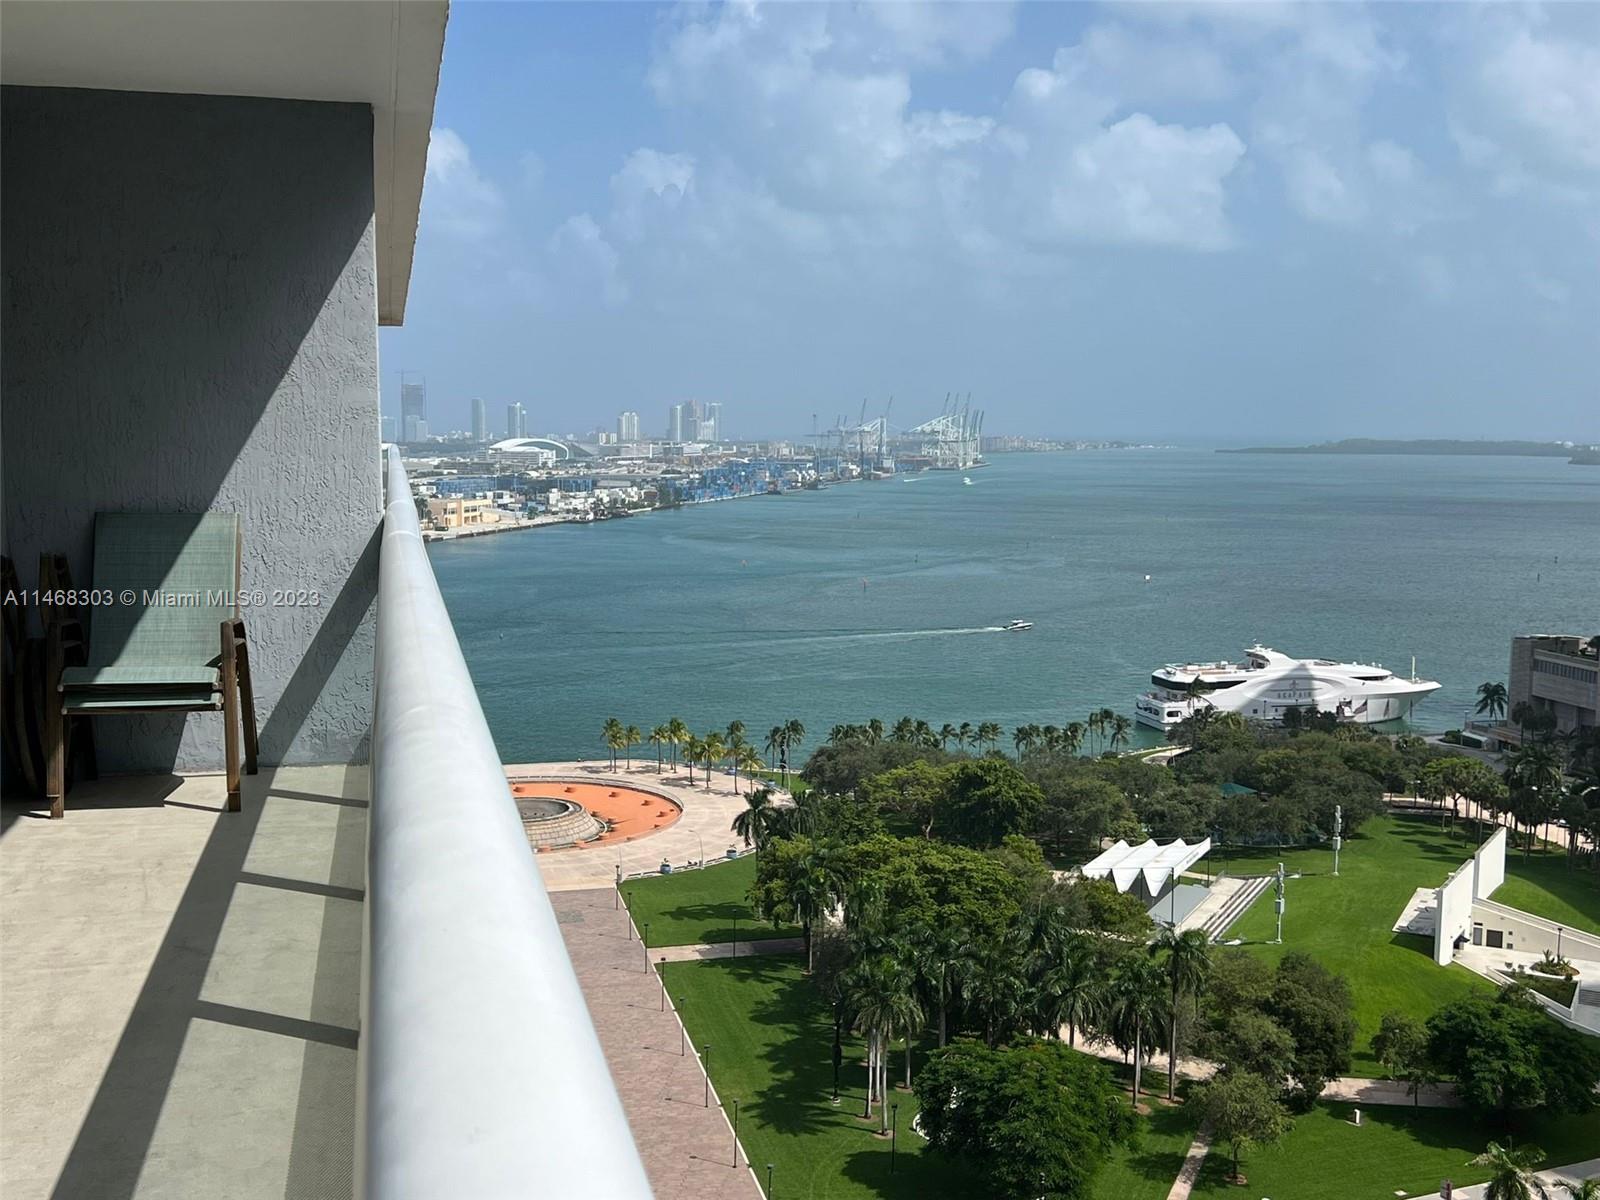
900 Biscayne Blvd, Miami, FL 33132
$-2,160
Cash flow
-14.2%
Cash-on-Cash Return
3.0%
Cap rate
0.5%
Rent to Value Ratio
Active
$350,000
1
bds
|
1
ba
|
825
sqft
|
built
2008
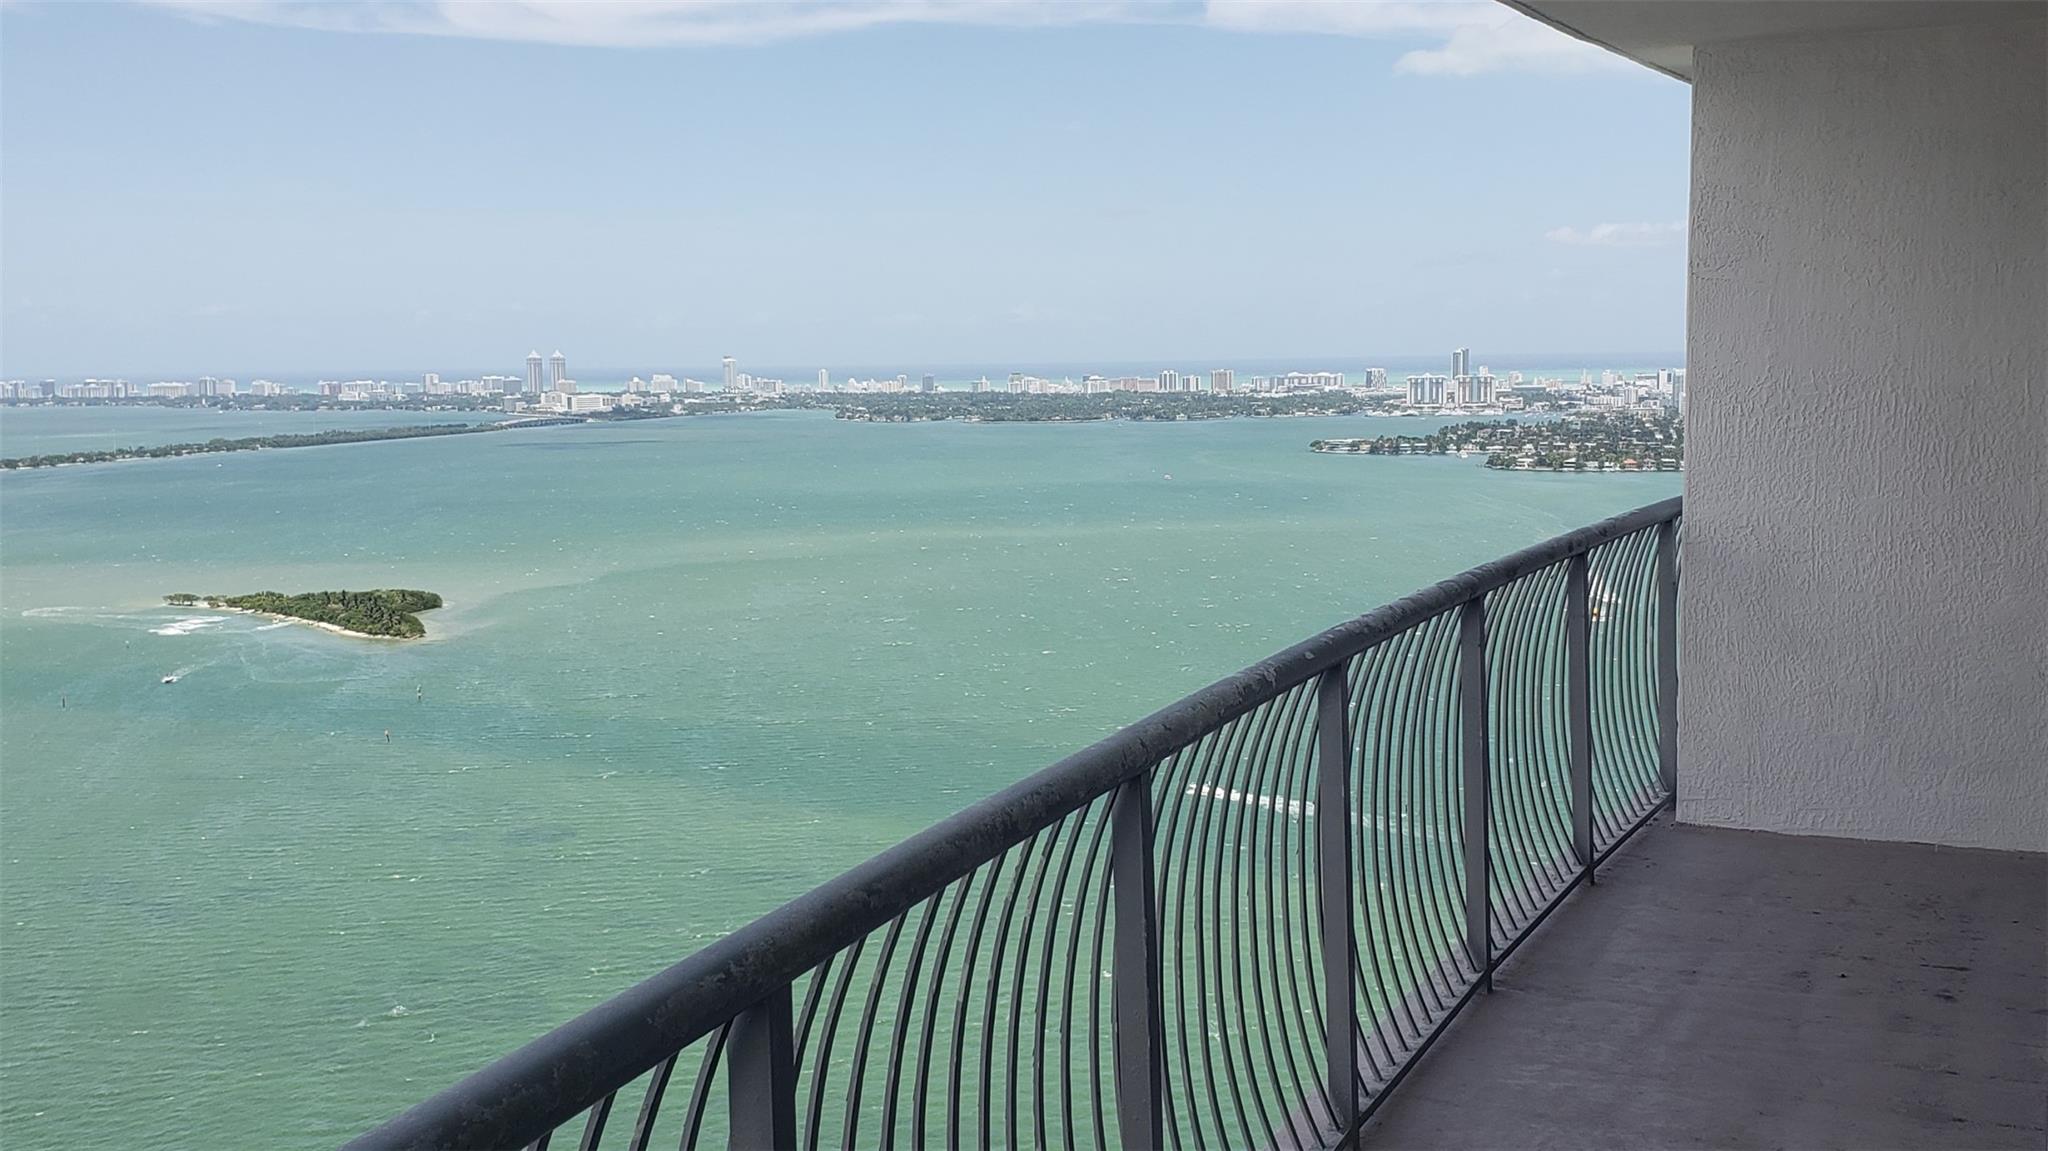
1750 N Bayshore Dr, Miami, FL 33132
$-1,160
Cash flow
-17.3%
Cash-on-Cash Return
2.3%
Cap rate
0.8%
Rent to Value Ratio
Active
$650,000
bds
|
1
ba
|
0
sqft
|
built
2018
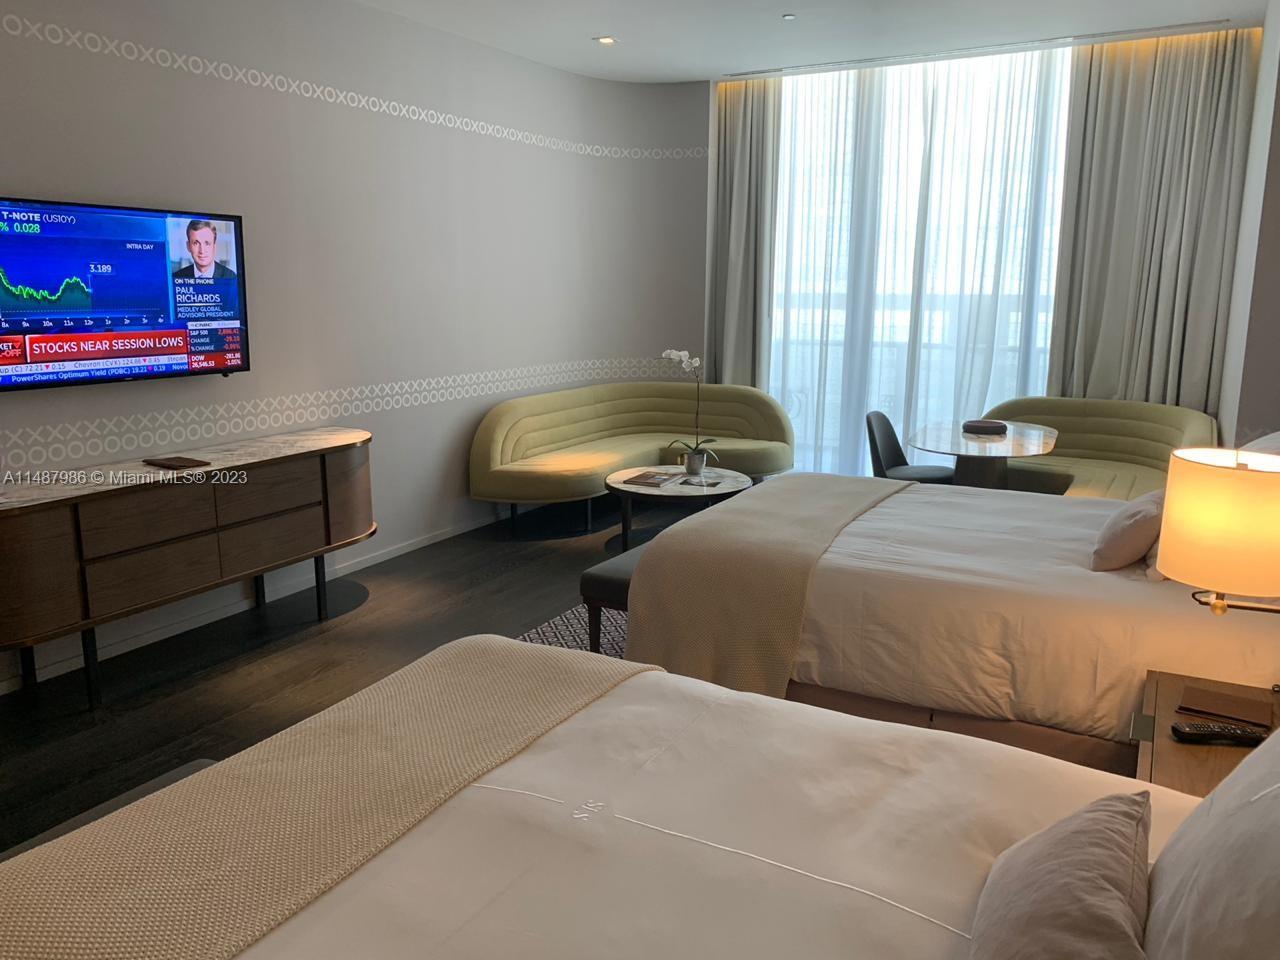
801 S Miami Ave, Miami, FL 33130
$-2,914
Cash flow
-23.4%
Cash-on-Cash Return
0.9%
Cap rate
0.5%
Rent to Value Ratio

Active
$945,000
2
bds
|
3
ba
|
1,161
sqft
|
built
2018
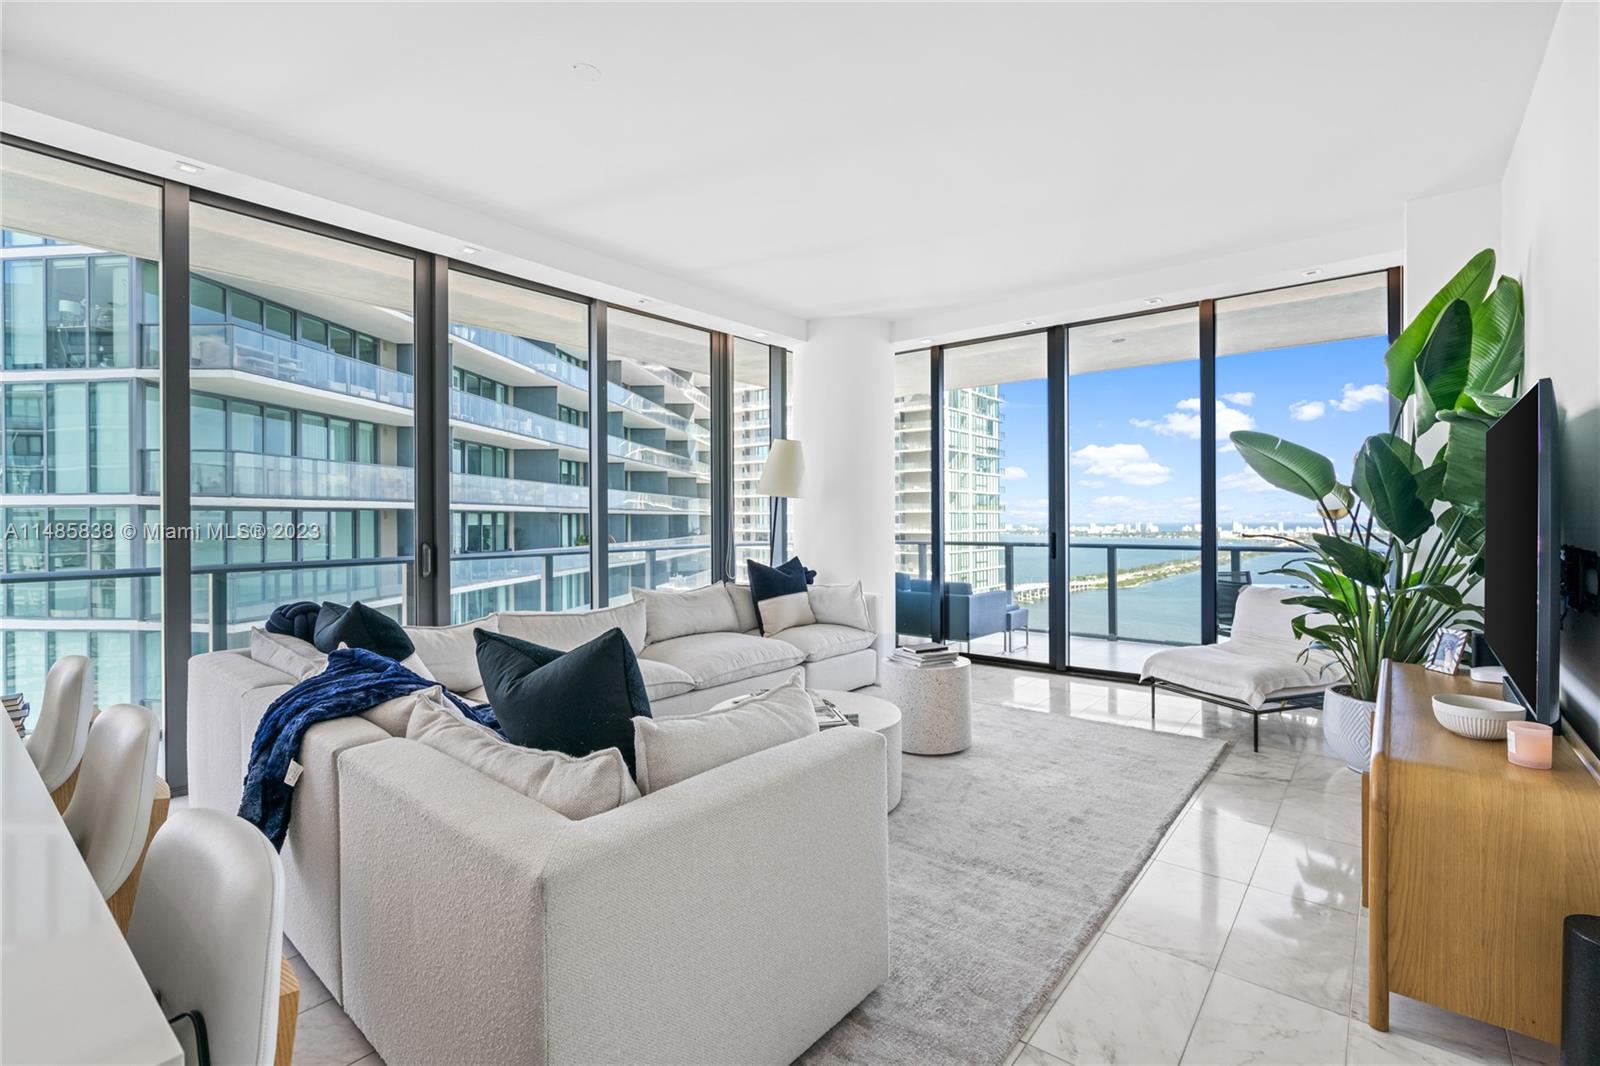
488 NE 18th St, Miami, FL 33132
$-1,978
Cash flow
-10.9%
Cash-on-Cash Return
3.8%
Cap rate
0.7%
Rent to Value Ratio
Active
$1,735,000
3
bds
|
3
ba
|
1,649
sqft
|
built
2018
480 NE 31st St, Miami, FL 33137
$-6,774
Cash flow
-20.4%
Cash-on-Cash Return
1.6%
Cap rate
0.5%
Rent to Value Ratio
Active
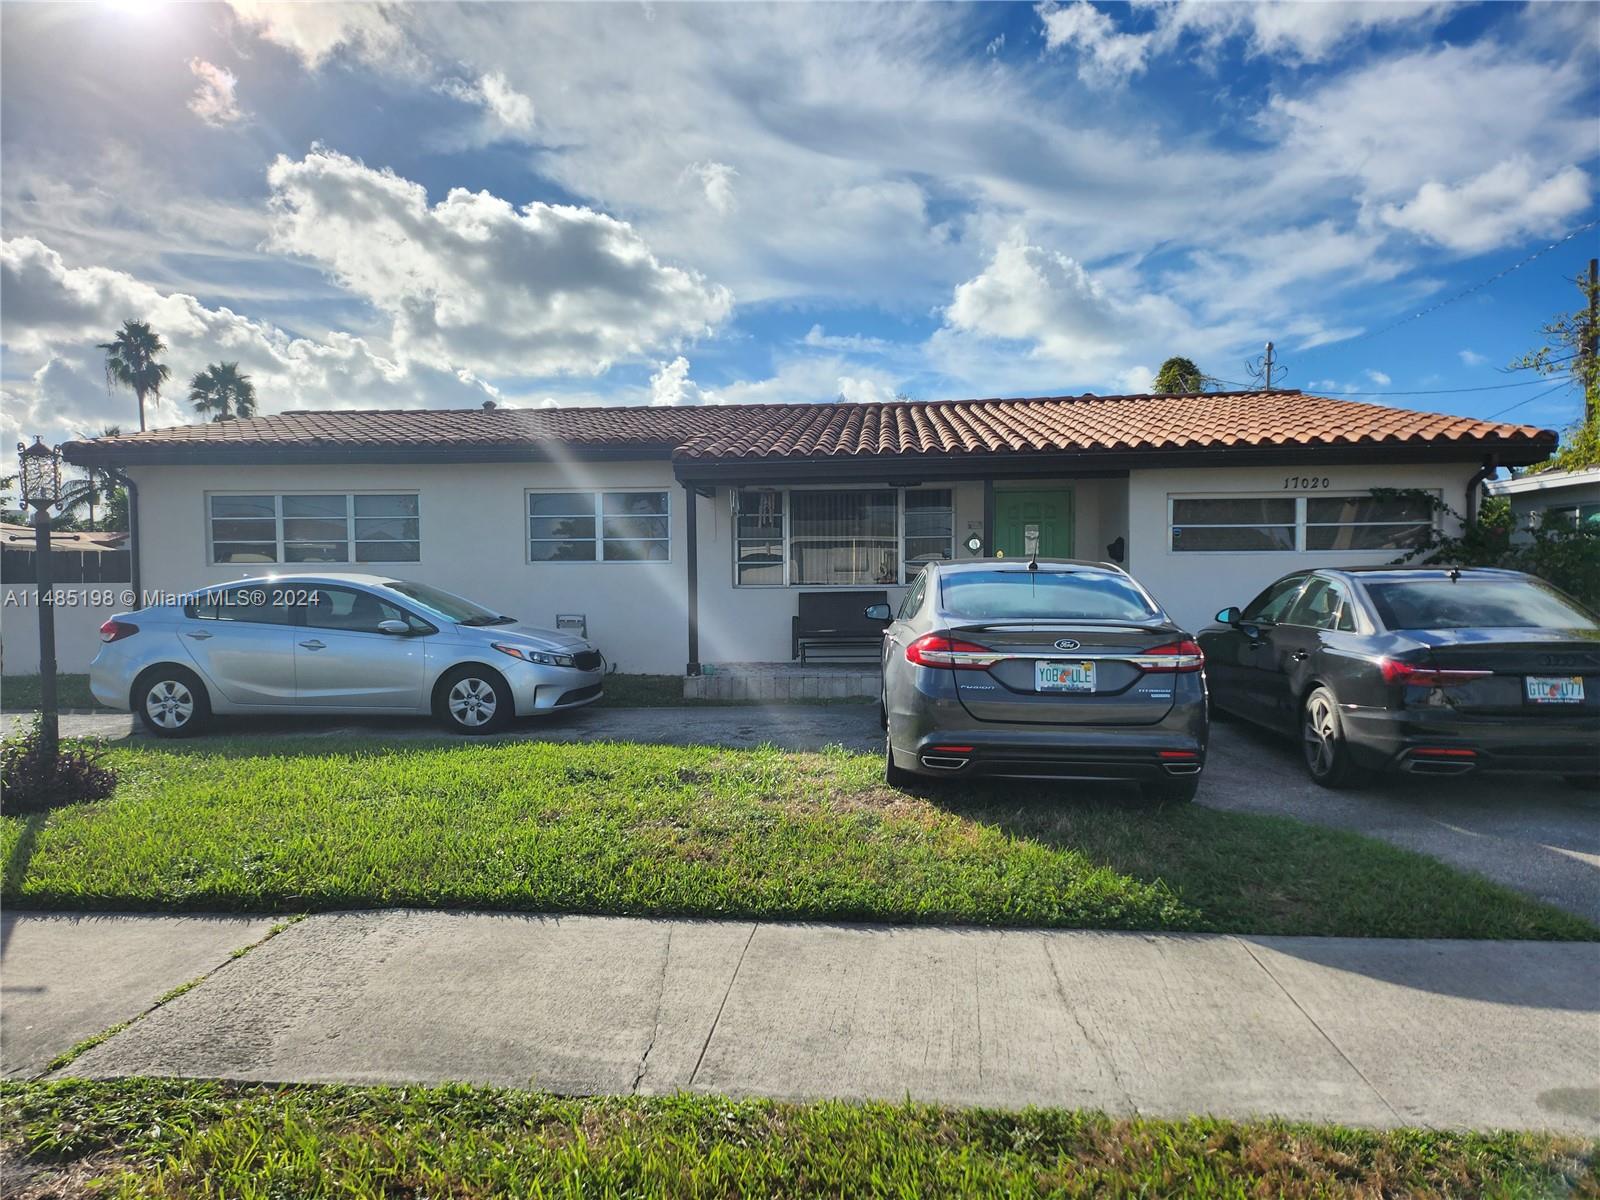
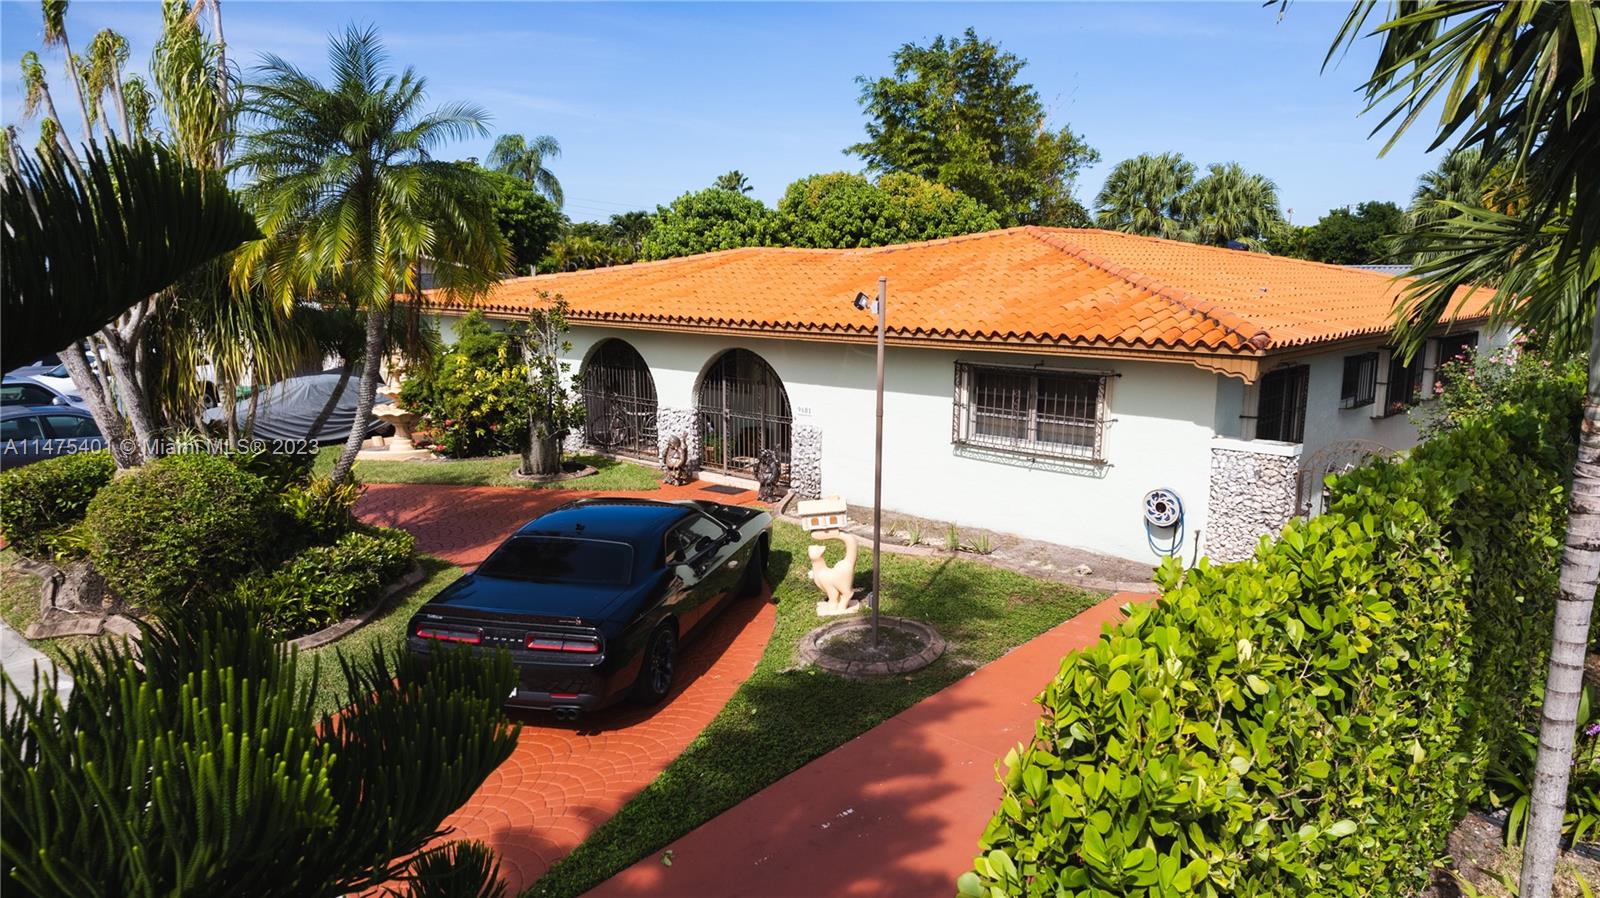
$1,000,000
3
bds
|
2
ba
|
1,414
sqft
|
built
1956
17020 NE 11th Ave, Miami, FL 33162
$-3,035
Cash flow
-15.8%
Cash-on-Cash Return
2.6%
Cap rate
0.4%
Rent to Value Ratio
Active
$3,799,000
4
bds
|
5
ba
|
3,127
sqft
|
built
2004
2752 Brickell Ct, Miami, FL 33129
$-13,363
Cash flow
-18.4%
Cash-on-Cash Return
2.1%
Cap rate
0.3%
Rent to Value Ratio

Active
$260,000
1
bds
|
1
ba
|
630
sqft
|
built
1989
6220 SW 131st Ct, Miami, FL 33183
$-435
Cash flow
-8.7%
Cash-on-Cash Return
4.3%
Cap rate
0.8%
Rent to Value Ratio
Active
$1,030,000
2
bds
|
2
ba
|
1,332
sqft
|
built
2016
1300 S Miami Ave, Miami, FL 33130
$-3,897
Cash flow
-19.7%
Cash-on-Cash Return
1.7%
Cap rate
0.6%
Rent to Value Ratio
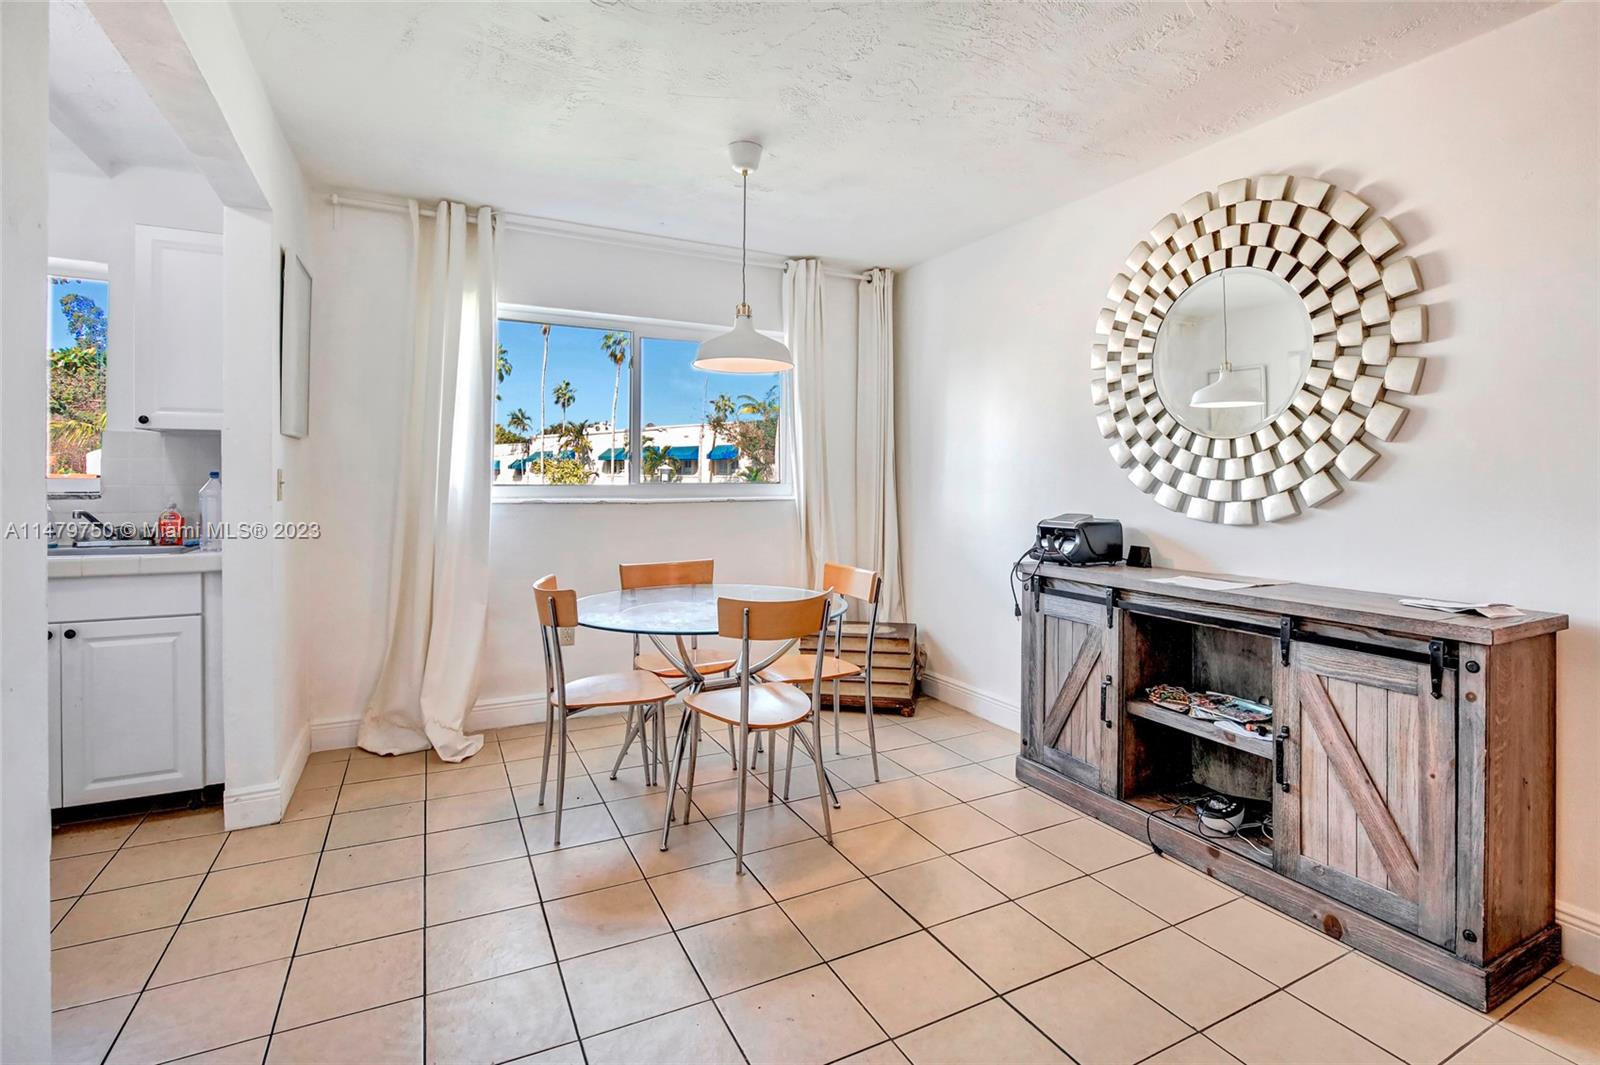
Active
$287,500
2
bds
|
2
ba
|
747
sqft
|
built
1974
5960 NE 5th Ct, Miami, FL 33137
$-481
Cash flow
-8.7%
Cash-on-Cash Return
4.3%
Cap rate
0.8%
Rent to Value Ratio
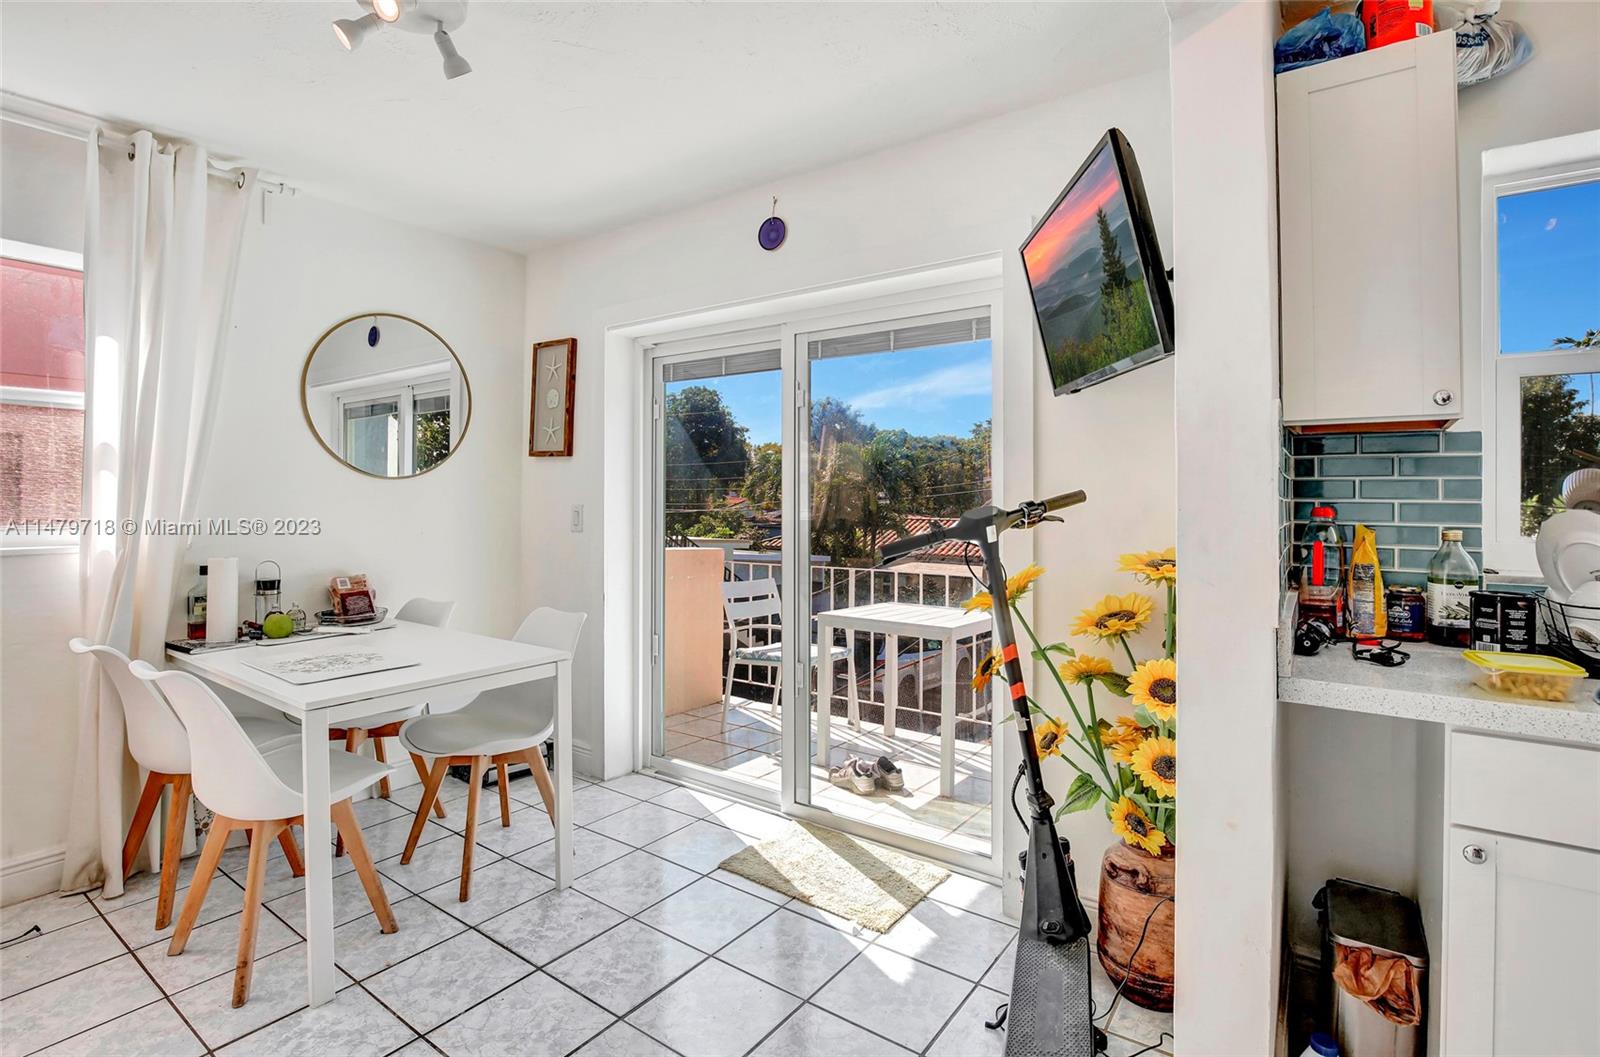
Active
$287,500
2
bds
|
2
ba
|
798
sqft
|
built
1974
5960 NE 5th Ct, Miami, FL 33137
$-551
Cash flow
-10.0%
Cash-on-Cash Return
4.0%
Cap rate
0.8%
Rent to Value Ratio
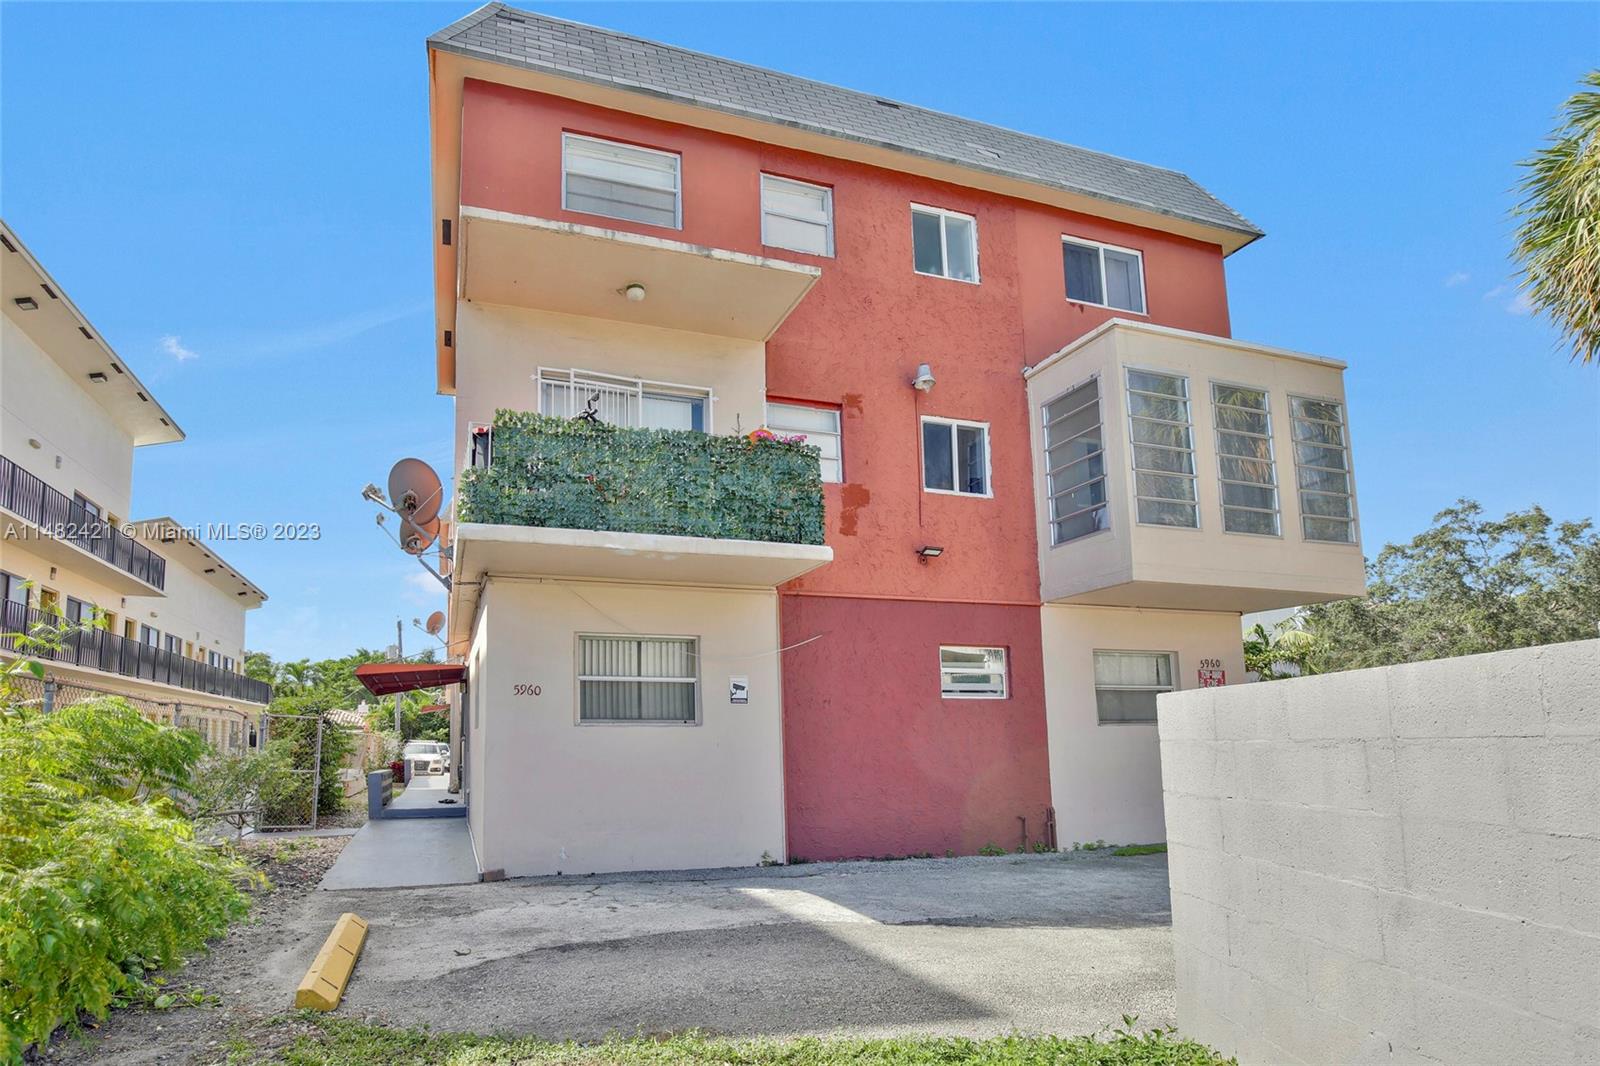
Active
$287,500
2
bds
|
2
ba
|
747
sqft
|
built
1974
5960 NE 5th Ct, Miami, FL 33137
$-688
Cash flow
-12.5%
Cash-on-Cash Return
3.4%
Cap rate
0.7%
Rent to Value Ratio
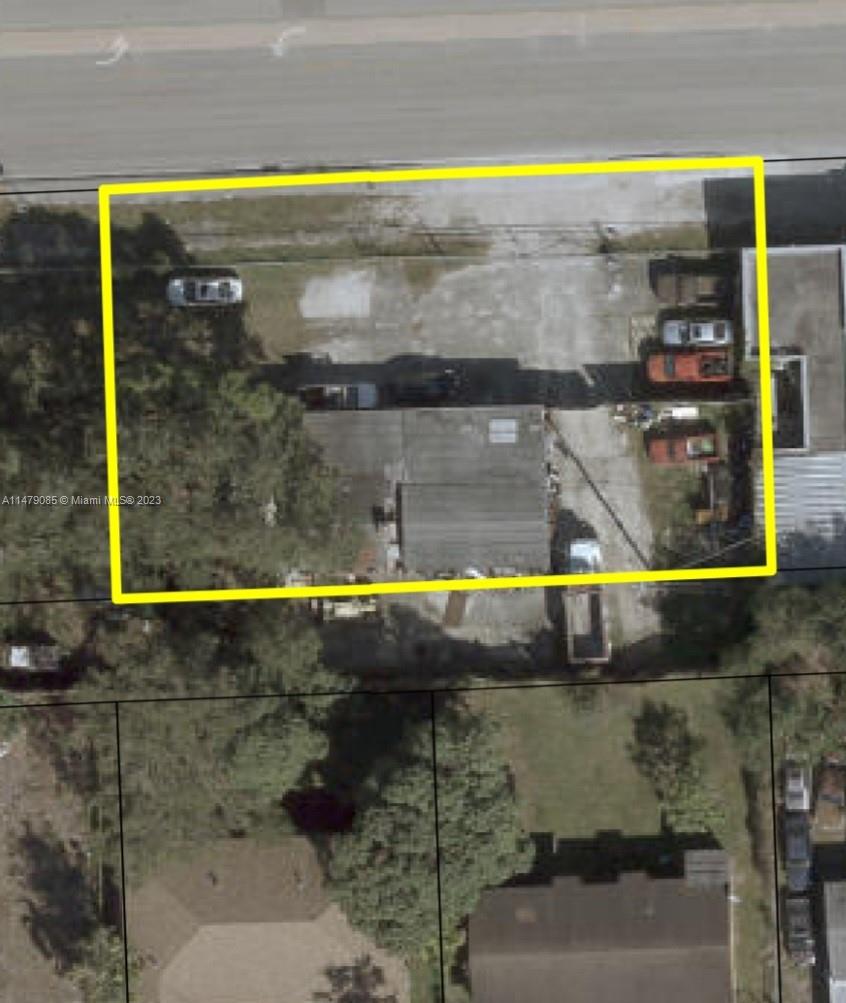
Active
$287,500
2
bds
|
2
ba
|
825
sqft
|
built
1974
5960 NE 5th Ct, Miami, FL 33137
$-555
Cash flow
-10.1%
Cash-on-Cash Return
4.0%
Cap rate
0.8%
Rent to Value Ratio
Active
$1,100,000
1
bds
|
1
ba
|
489
sqft
|
built
1941
1878 NW 95th St, Miami, FL 33147
$-4,984
Cash flow
-23.6%
Cash-on-Cash Return
0.8%
Cap rate
0.1%
Rent to Value Ratio
Active
$480,000
2
bds
|
2
ba
|
1,065
sqft
|
built
2005
2775 NE 187th St, Miami, FL 33180
$-1,543
Cash flow
-16.8%
Cash-on-Cash Return
2.4%
Cap rate
0.6%
Rent to Value Ratio
Active
$1,000,000
2
bds
|
3
ba
|
1,498
sqft
|
built
2009
1100 Biscayne Blvd, Miami, FL 33132
$-3,895
Cash flow
-20.3%
Cash-on-Cash Return
1.6%
Cap rate
0.6%
Rent to Value Ratio

Active
$820,000
2
bds
|
2
ba
|
1,254
sqft
|
built
2019
851 NE 1st Ave, Miami, FL 33132
$-4,104
Cash flow
-26.1%
Cash-on-Cash Return
0.3%
Cap rate
0.7%
Rent to Value Ratio
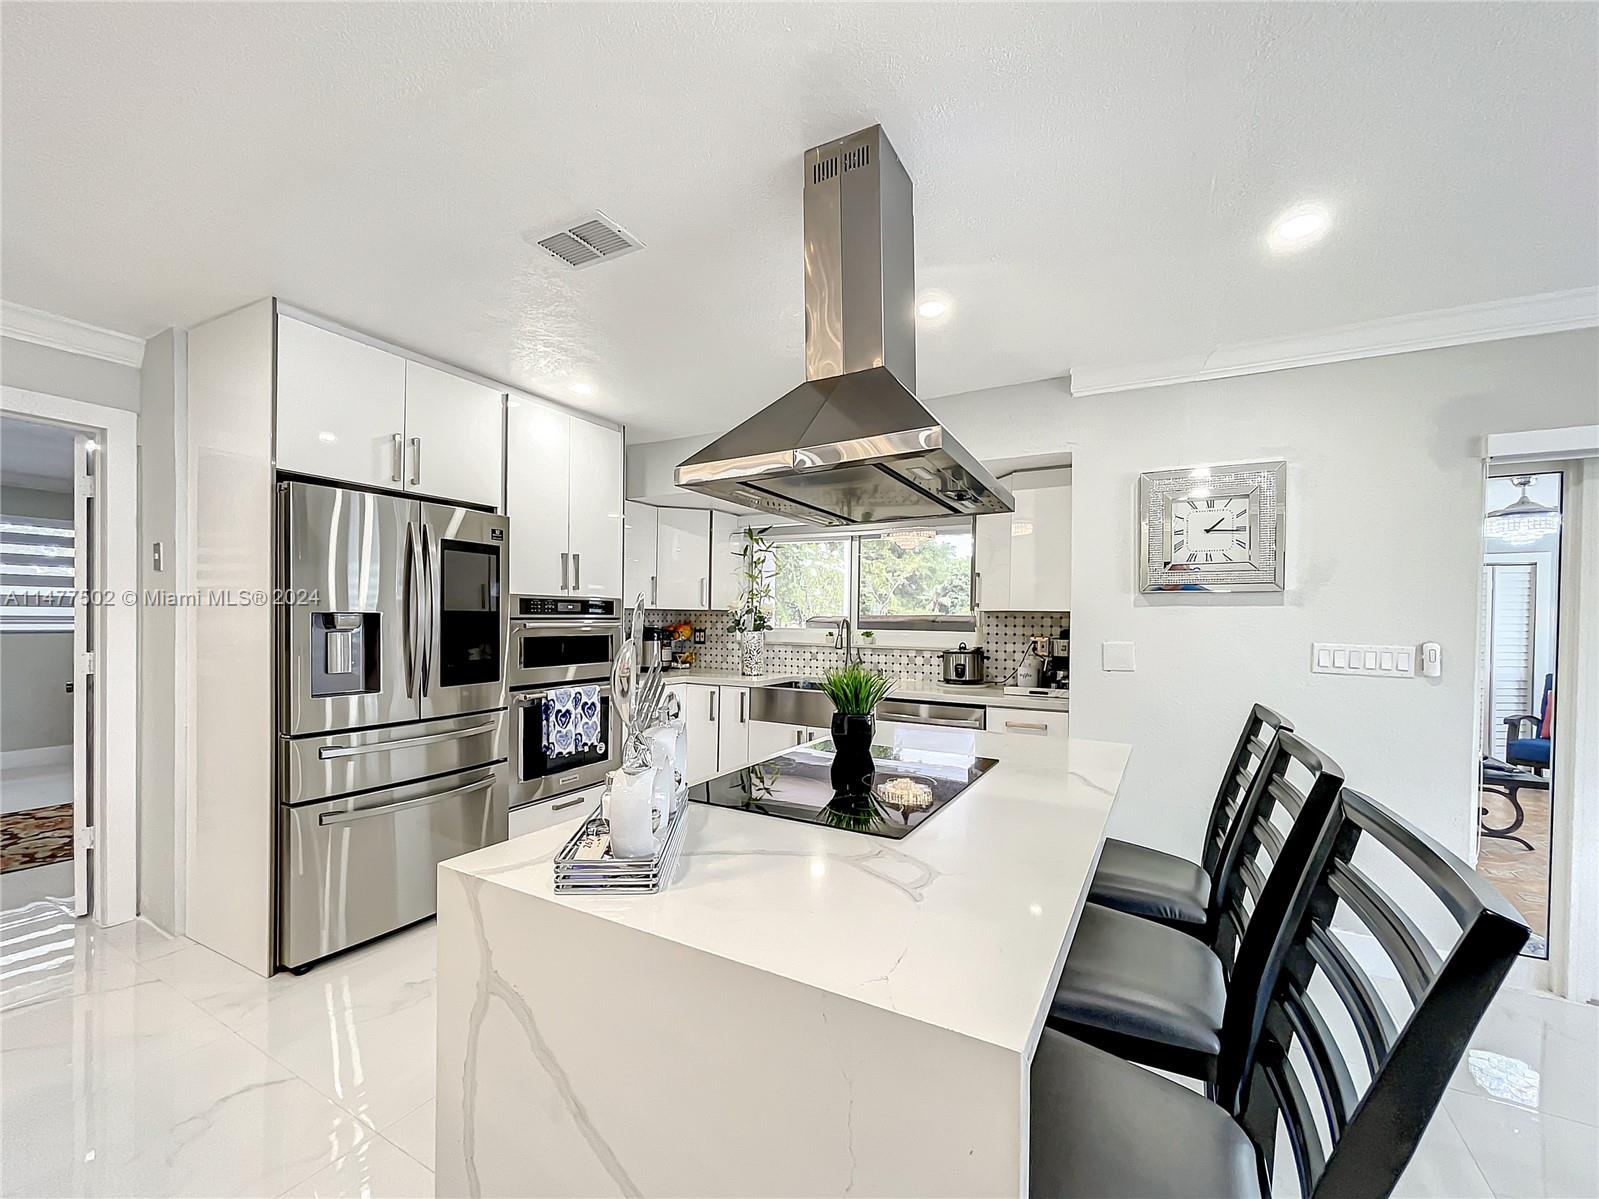
Active
$1,185,000
4
bds
|
4
ba
|
2,539
sqft
|
built
1972
9601 SW 66th St, Miami, FL 33173
$-2,761
Cash flow
-12.2%
Cash-on-Cash Return
3.5%
Cap rate
0.5%
Rent to Value Ratio
Active
$1,060,000
4
bds
|
3
ba
|
2,048
sqft
|
built
1974
12601 SW 204th St, Miami, FL 33177
$-1,936
Cash flow
-9.5%
Cash-on-Cash Return
4.1%
Cap rate
0.5%
Rent to Value Ratio

Active
$4,300,000
9
bds
|
10
ba
|
8,284
sqft
|
built
2009
7400 SW 72nd Ct, Miami, FL 33143
$-18,698
Cash flow
-22.7%
Cash-on-Cash Return
1.1%
Cap rate
0.2%
Rent to Value Ratio
Active
$750,000
2
bds
|
2
ba
|
1,256
sqft
|
built
2007
50 Biscayne Blvd, Miami, FL 33132
$-3,083
Cash flow
-21.4%
Cash-on-Cash Return
1.4%
Cap rate
0.6%
Rent to Value Ratio
Active
$290,000
2
bds
|
2
ba
|
1,000
sqft
|
built
1981
9686 Fontainebleau Blvd, Miami, FL 33172
$-574
Cash flow
-10.3%
Cash-on-Cash Return
3.9%
Cap rate
0.8%
Rent to Value Ratio
Active
$2,775,000
2
bds
|
3
ba
|
1,595
sqft
|
built
2005
2627 S Bayshore Dr, Miami, FL 33133
$-11,239
Cash flow
-21.1%
Cash-on-Cash Return
1.4%
Cap rate
0.4%
Rent to Value Ratio
Active
$219,900
3
bds
|
2
ba
|
1,954
sqft
|
built
1970
875 NE 195th St, Miami, FL 33179
$-364
Cash flow
-8.6%
Cash-on-Cash Return
4.3%
Cap rate
1.4%
Rent to Value Ratio
Active
$450,000
3
bds
|
3
ba
|
1,460
sqft
|
built
1996
8260 NW 10th St, Miami, FL 33126
$-522
Cash flow
-6.1%
Cash-on-Cash Return
4.9%
Cap rate
0.7%
Rent to Value Ratio
Active
$1,425,000
2
bds
|
2
ba
|
1,529
sqft
|
built
2004
1331 Brickell Bay Dr, Miami, FL 33131
$-6,815
Cash flow
-25.0%
Cash-on-Cash Return
0.5%
Cap rate
0.5%
Rent to Value Ratio
Active
$1,650,000
6
bds
|
0
ba
|
3,262
sqft
|
built
1968
2751 SW 11th St, Miami, FL 33135
$-7,429
Cash flow
-23.5%
Cash-on-Cash Return
0.9%
Cap rate
0.2%
Rent to Value Ratio
Active
$415,000
2
bds
|
2
ba
|
922
sqft
|
built
2003
5077 NW 7th St, Miami, FL 33126
$-1,476
Cash flow
-18.6%
Cash-on-Cash Return
2.0%
Cap rate
0.6%
Rent to Value Ratio
Active
$475,000
bds
|
1
ba
|
598
sqft
|
built
2008
475 Brickell Ave, Miami, FL 33131
$-988
Cash flow
-10.9%
Cash-on-Cash Return
3.8%
Cap rate
0.7%
Rent to Value Ratio
Active
$980,000
2
bds
|
3
ba
|
1,278
sqft
|
built
2008
950 Brickell Bay Dr, Miami, FL 33131
$-2,573
Cash flow
-13.7%
Cash-on-Cash Return
3.1%
Cap rate
0.6%
Rent to Value Ratio
Active
$819,000
2
bds
|
2
ba
|
1,048
sqft
|
built
2019
3900 Biscayne Blvd, Miami, FL 33137
$-3,465
Cash flow
-22.1%
Cash-on-Cash Return
1.2%
Cap rate
0.6%
Rent to Value Ratio

Active
$340,000
1
bds
|
1
ba
|
640
sqft
|
built
1998
185 SE 14th Ter, Miami, FL 33131
$-970
Cash flow
-14.9%
Cash-on-Cash Return
2.9%
Cap rate
0.8%
Rent to Value Ratio
Active
$1,999,999
5
bds
|
5
ba
|
2,984
sqft
|
built
2016
525 SW 87th Ave, Miami, FL 33174
$-4,525
Cash flow
-11.8%
Cash-on-Cash Return
3.6%
Cap rate
0.5%
Rent to Value Ratio
Active
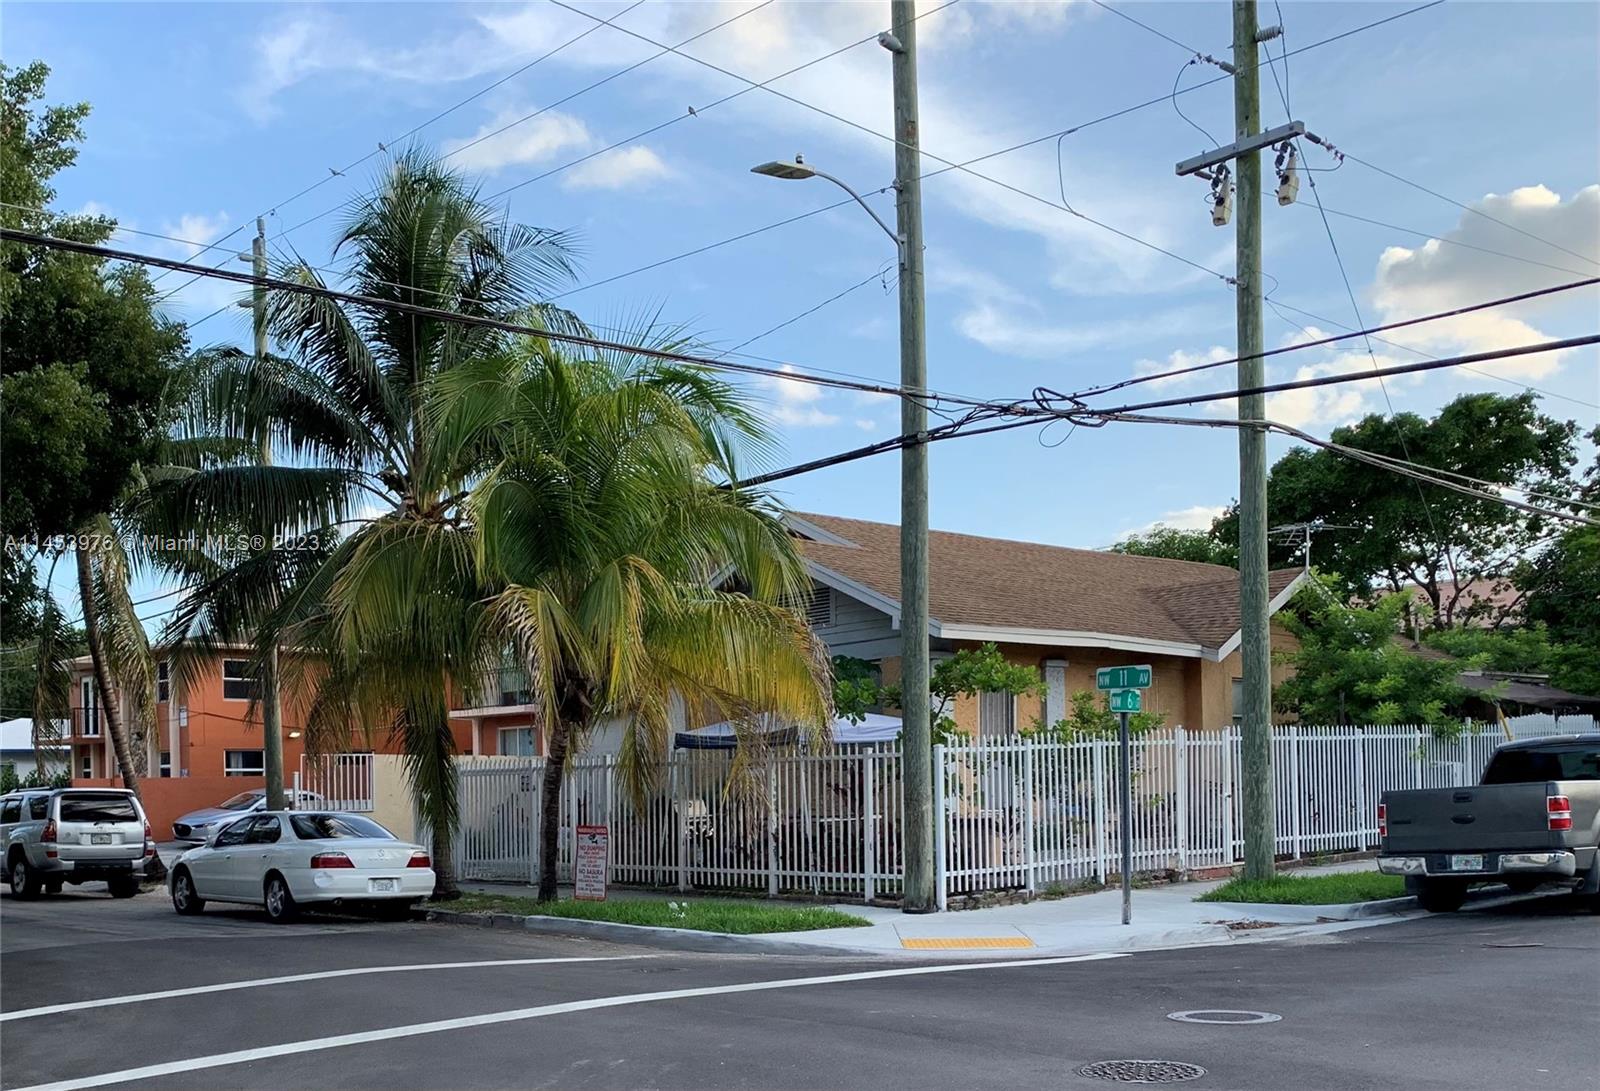
$599,900
3
bds
|
2
ba
|
1,649
sqft
|
built
1920
1104 NW 6th St, Miami, FL 33136
$-1,035
Cash flow
-9.0%
Cash-on-Cash Return
4.2%
Cap rate
0.5%
Rent to Value Ratio
Active
$958,800
1
bds
|
2
ba
|
665
sqft
|
built
2022
398 NE 5th St, Miami, FL 33132
$-1,753
Cash flow
-9.5%
Cash-on-Cash Return
4.1%
Cap rate
0.6%
Rent to Value Ratio
Active
$699,999
2
bds
|
2
ba
|
1,190
sqft
|
built
2007
3250 NE 1st Ave, Miami, FL 33137
$-356
Cash flow
-2.7%
Cash-on-Cash Return
5.7%
Cap rate
1.0%
Rent to Value Ratio
Active
$618,000
2
bds
|
2
ba
|
1,105
sqft
|
built
2005
335 S Biscayne Blvd, Miami, FL 33131
$-2,509
Cash flow
-21.2%
Cash-on-Cash Return
1.4%
Cap rate
0.6%
Rent to Value Ratio
Active
$230,000
2
bds
|
2
ba
|
1,175
sqft
|
built
1972
496 NW 165th Street Rd, Miami, FL 33169
$-593
Cash flow
-13.5%
Cash-on-Cash Return
3.2%
Cap rate
1.0%
Rent to Value Ratio