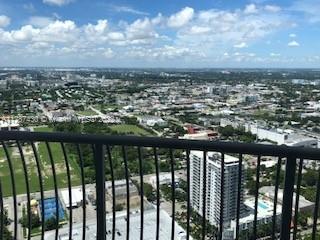
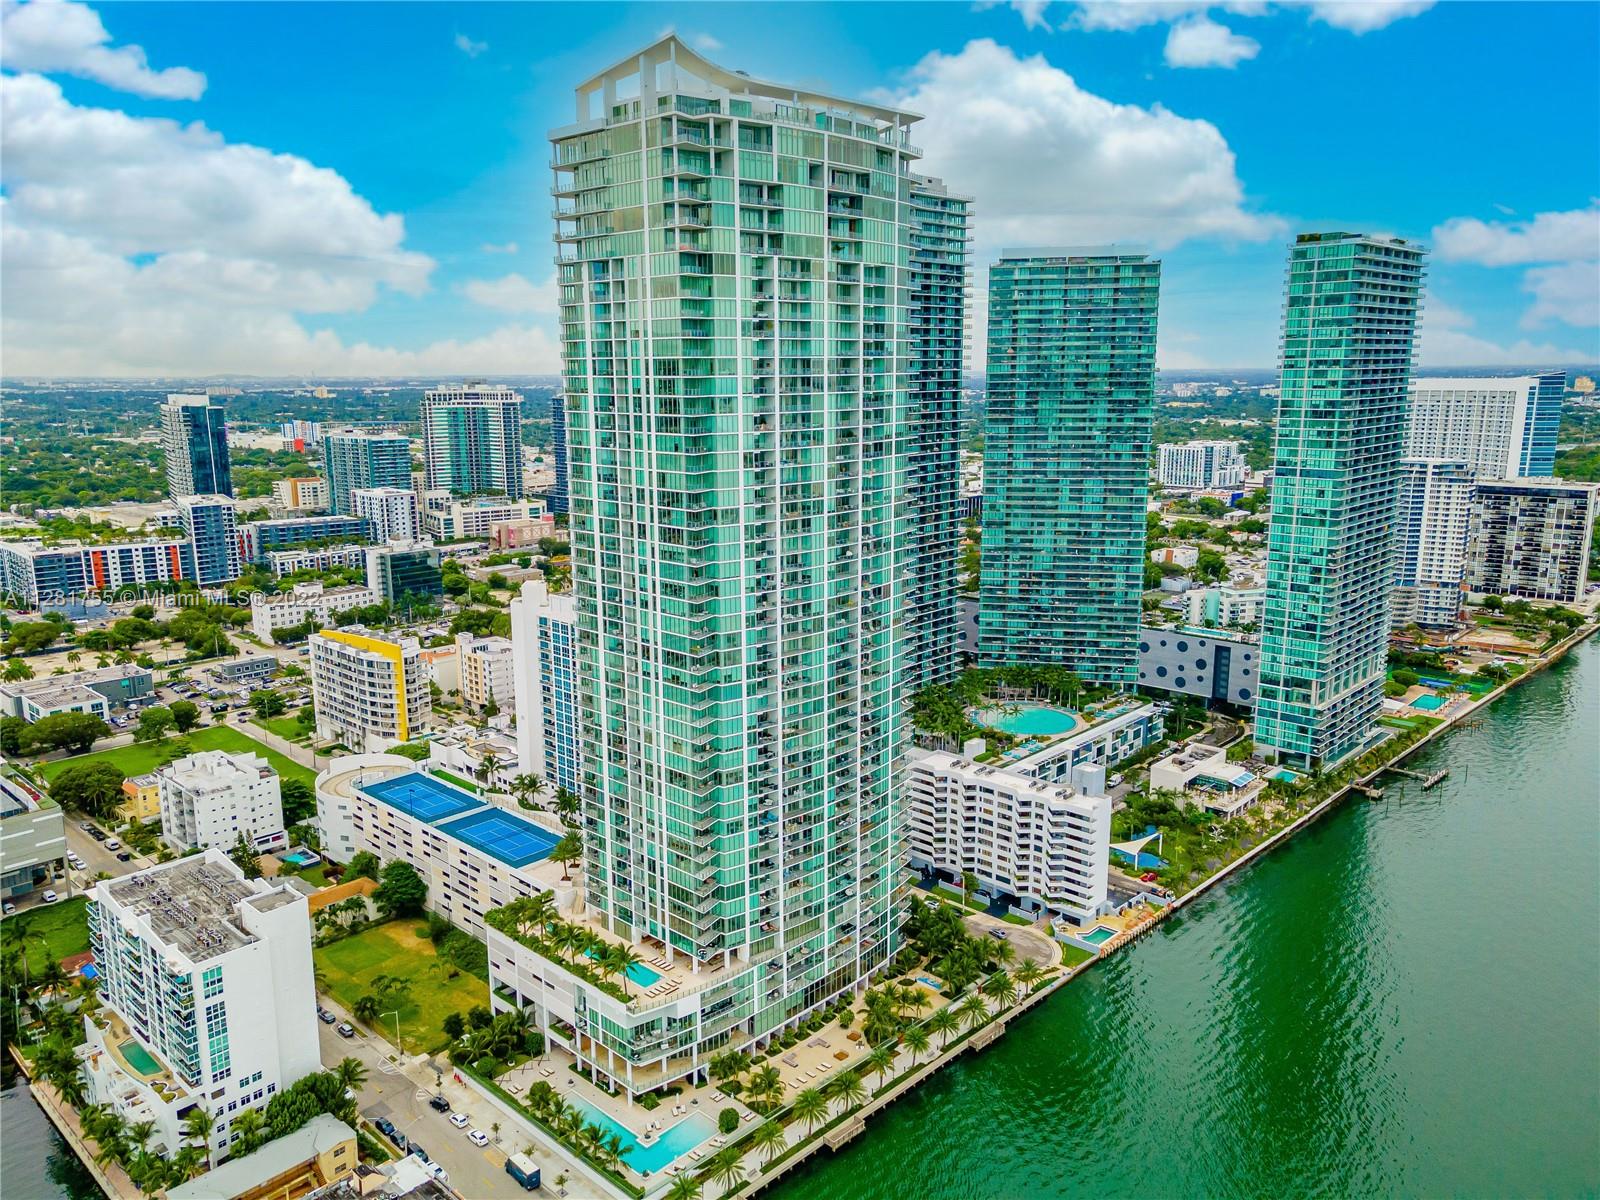
Miami, FL Investment Properties for Sale
Browse homes for sale and investment properties in Miami, FL. Refine your search by price, property type, or more.
Best cash flowing properties in Miami, FL

Active
$210,000
1
bds
|
2
ba
|
898
sqft
|
built
1969
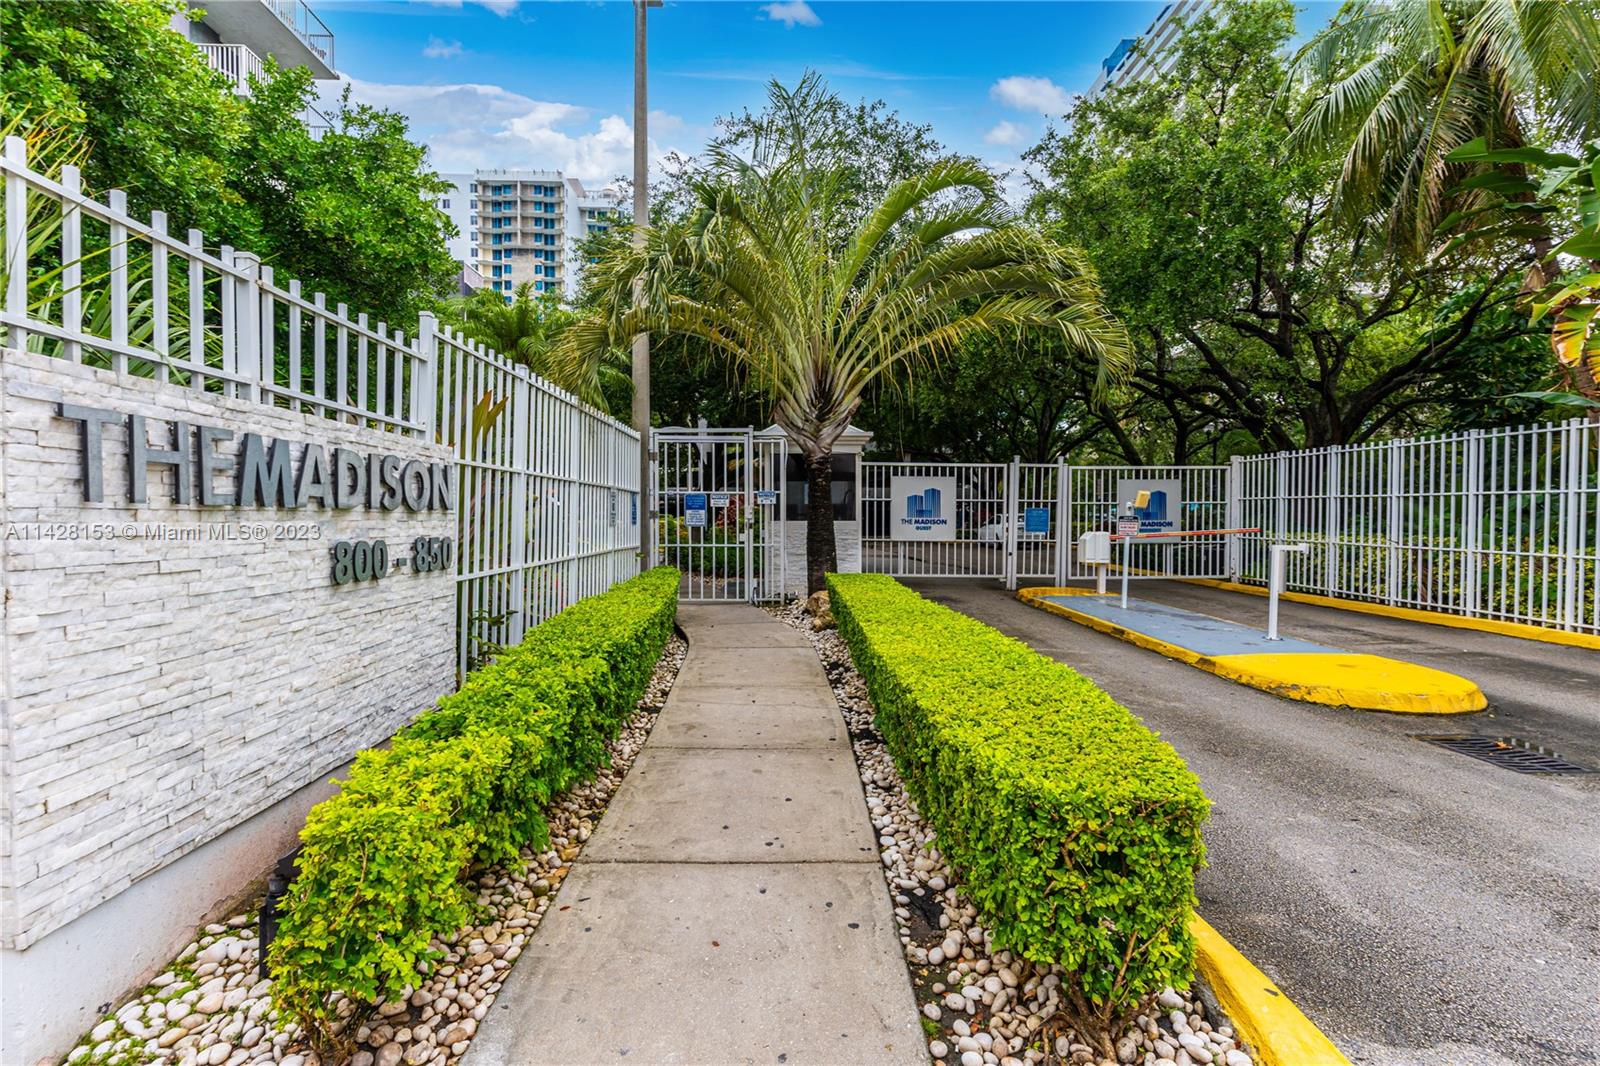
1501 NE 191st St, Miami, FL 33179
$-280
Cash flow
-7.0%
Cash-on-Cash Return
4.7%
Cap rate
0.9%
Rent to Value Ratio
Active
$359,000
bds
|
1
ba
|
508
sqft
|
built
2008
1750 N Bayshore Dr, Miami, FL 33132
$-293
Cash flow
-4.3%
Cash-on-Cash Return
5.3%
Cap rate
0.6%
Rent to Value Ratio
6,307 out of 7,161 properties for sale in Miami, FL
Limited Results Shown
Create a free account, or log in to reveal all property listings and enjoy the complete experience.
Active
$6,200,000
7
bds
|
8
ba
|
5,452
sqft
|
built
1959
7930 SW 52nd Ct, Miami, FL 33143
$-27,943
Cash flow
-23.5%
Cash-on-Cash Return
0.9%
Cap rate
0.1%
Rent to Value Ratio
Active
$399,000
1
bds
|
2
ba
|
860
sqft
|
built
1980
555 NE 15th St, Miami, FL 33132
$-1,666
Cash flow
-21.8%
Cash-on-Cash Return
1.3%
Cap rate
0.7%
Rent to Value Ratio
Active
$1,300,000
4
bds
|
2
ba
|
1,375
sqft
|
built
1971
2612 NE 206th St, Miami, FL 33180
$-5,836
Cash flow
-23.4%
Cash-on-Cash Return
0.9%
Cap rate
0.1%
Rent to Value Ratio

Active
$199,000
2
bds
|
2
ba
|
1,175
sqft
|
built
1972
498 NW 165th Street Rd, Miami, FL 33169
$-569
Cash flow
-14.9%
Cash-on-Cash Return
2.9%
Cap rate
1.0%
Rent to Value Ratio
Active
$5,000,000
3
bds
|
4
ba
|
3,083
sqft
|
built
2017
1451 Brickell Ave, Miami, FL 33131
$-31,016
Cash flow
-32.4%
Cash-on-Cash Return
-1.2%
Cap rate
0.2%
Rent to Value Ratio
Active
$199,000
2
bds
|
2
ba
|
1,036
sqft
|
built
1972
498 NW 165th Street Rd, Miami, FL 33169
$-474
Cash flow
-12.4%
Cash-on-Cash Return
3.4%
Cap rate
1.0%
Rent to Value Ratio
Active
$359,000
bds
|
1
ba
|
508
sqft
|
built
2008
1750 N Bayshore Dr, Miami, FL 33132
$-293
Cash flow
-4.3%
Cash-on-Cash Return
5.3%
Cap rate
0.6%
Rent to Value Ratio
Active
$945,000
2
bds
|
2
ba
|
1,505
sqft
|
built
2009
495 Brickell Ave, Miami, FL 33131
$-3,254
Cash flow
-18.0%
Cash-on-Cash Return
2.2%
Cap rate
0.6%
Rent to Value Ratio
Active
$595,000
1
bds
|
2
ba
|
799
sqft
|
built
2008
200 Biscayne Boulevard Way, Miami, FL 33131
$-2,059
Cash flow
-18.1%
Cash-on-Cash Return
2.1%
Cap rate
0.7%
Rent to Value Ratio
Active
$379,999
2
bds
|
2
ba
|
914
sqft
|
built
1989
850 N Miami Ave, Miami, FL 33136
$-1,440
Cash flow
-19.8%
Cash-on-Cash Return
1.7%
Cap rate
0.7%
Rent to Value Ratio
Active
$660,000
2
bds
|
2
ba
|
1,203
sqft
|
built
2008
244 Biscayne Blvd, Miami, FL 33132
$-2,358
Cash flow
-18.6%
Cash-on-Cash Return
2.0%
Cap rate
0.7%
Rent to Value Ratio
Active
$450,000
1
bds
|
1
ba
|
945
sqft
|
built
2015
999 SW 1st Ave, Miami, FL 33130
$-1,545
Cash flow
-17.9%
Cash-on-Cash Return
2.2%
Cap rate
0.7%
Rent to Value Ratio

Active
$4,750,000
4
bds
|
4
ba
|
5,165
sqft
|
built
1980
12005 SW 64th St, Miami, FL 33183
$-20,055
Cash flow
-22.0%
Cash-on-Cash Return
1.2%
Cap rate
0.2%
Rent to Value Ratio

Active
$679,000
1
bds
|
2
ba
|
937
sqft
|
built
2019
851 NE 1st St, Miami, FL 33132
$-1,883
Cash flow
-14.5%
Cash-on-Cash Return
3.0%
Cap rate
0.6%
Rent to Value Ratio

Active
$805,000
1
bds
|
2
ba
|
950
sqft
|
built
2008
200 Biscayne Boulevard Way, Miami, FL 33131
$-2,376
Cash flow
-15.4%
Cash-on-Cash Return
2.7%
Cap rate
0.7%
Rent to Value Ratio
Active
$1,050,000
2
bds
|
3
ba
|
1,255
sqft
|
built
2008
200 Biscayne Boulevard Way, Miami, FL 33131
$-4,265
Cash flow
-21.2%
Cash-on-Cash Return
1.4%
Cap rate
0.6%
Rent to Value Ratio
Active
$440,000
1
bds
|
1
ba
|
682
sqft
|
built
2016
201 SW 17th Rd, Miami, FL 33129
$-1,700
Cash flow
-20.2%
Cash-on-Cash Return
1.6%
Cap rate
0.6%
Rent to Value Ratio
Active
$869,000
4
bds
|
0
ba
|
2,386
sqft
|
built
1960
2855 NW 22nd Ave, Miami, FL 33142
$-3,250
Cash flow
-19.5%
Cash-on-Cash Return
1.8%
Cap rate
0.3%
Rent to Value Ratio
Active
$210,000
1
bds
|
2
ba
|
898
sqft
|
built
1969
1501 NE 191st St, Miami, FL 33179
$-280
Cash flow
-7.0%
Cash-on-Cash Return
4.7%
Cap rate
0.9%
Rent to Value Ratio
Active
$755,000
2
bds
|
2
ba
|
1,140
sqft
|
built
2001
1155 Brickell Bay Dr, Miami, FL 33131
$-2,263
Cash flow
-15.6%
Cash-on-Cash Return
2.7%
Cap rate
0.7%
Rent to Value Ratio
Active
$1,300,000
2
bds
|
2
ba
|
1,518
sqft
|
built
2009
495 Brickell Ave, Miami, FL 33131
$-4,183
Cash flow
-16.8%
Cash-on-Cash Return
2.4%
Cap rate
0.6%
Rent to Value Ratio
Active
$709,000
2
bds
|
2
ba
|
835
sqft
|
built
2018
121 NE 34th St, Miami, FL 33137
$-2,815
Cash flow
-20.7%
Cash-on-Cash Return
1.5%
Cap rate
0.6%
Rent to Value Ratio
Active
$2,000,000
3
bds
|
4
ba
|
2,188
sqft
|
built
2019
851 NE 1st St, Miami, FL 33132
$-5,994
Cash flow
-15.6%
Cash-on-Cash Return
2.7%
Cap rate
0.5%
Rent to Value Ratio
Active
$969,000
2
bds
|
2
ba
|
1,152
sqft
|
built
2018
801 S Miami Ave, Miami, FL 33130
$-3,882
Cash flow
-20.9%
Cash-on-Cash Return
1.5%
Cap rate
0.6%
Rent to Value Ratio
Active
$240,000
2
bds
|
2
ba
|
1,259
sqft
|
built
1975
16750 NE 10th Ave, Miami, FL 33162
$-590
Cash flow
-12.8%
Cash-on-Cash Return
3.3%
Cap rate
1.0%
Rent to Value Ratio
Active
$455,000
bds
|
1
ba
|
442
sqft
|
built
2017
1010 Brickell Ave, Miami, FL 33131
$-1,039
Cash flow
-11.9%
Cash-on-Cash Return
3.5%
Cap rate
0.6%
Rent to Value Ratio
Active
$2,400,000
3
bds
|
4
ba
|
2,018
sqft
|
built
2018
488 NE 18th St, Miami, FL 33132
$-10,217
Cash flow
-22.2%
Cash-on-Cash Return
1.2%
Cap rate
0.4%
Rent to Value Ratio

Active
$445,000
2
bds
|
2
ba
|
1,316
sqft
|
built
1982
780 NE 69th St, Miami, FL 33138
$-386
Cash flow
-4.5%
Cash-on-Cash Return
5.2%
Cap rate
0.8%
Rent to Value Ratio
Active
$5,000,000
4
bds
|
6
ba
|
2,390
sqft
|
built
1957
4756 Bay Point Rd, Miami, FL 33137
$-22,057
Cash flow
-23.0%
Cash-on-Cash Return
1.0%
Cap rate
0.2%
Rent to Value Ratio
Active
$389,000
1
bds
|
2
ba
|
828
sqft
|
built
1982
780 NE 69th St, Miami, FL 33138
$-1,392
Cash flow
-18.7%
Cash-on-Cash Return
2.0%
Cap rate
0.7%
Rent to Value Ratio
Active
$675,000
1
bds
|
2
ba
|
881
sqft
|
built
2018
801 S Miami Ave, Miami, FL 33130
$-2,237
Cash flow
-17.3%
Cash-on-Cash Return
2.3%
Cap rate
0.7%
Rent to Value Ratio
Active
$550,000
2
bds
|
2
ba
|
1,062
sqft
|
built
2015
4250 Biscayne Blvd, Miami, FL 33137
$-2,407
Cash flow
-22.8%
Cash-on-Cash Return
1.0%
Cap rate
0.7%
Rent to Value Ratio
Active
$1,975,000
3
bds
|
4
ba
|
2,321
sqft
|
built
2019
851 NE 1st Ave, Miami, FL 33132
$-7,469
Cash flow
-19.7%
Cash-on-Cash Return
1.7%
Cap rate
0.5%
Rent to Value Ratio
Active
$790,000
1
bds
|
2
ba
|
1,018
sqft
|
built
2019
851 NE 1st Ave, Miami, FL 33132
$-4,068
Cash flow
-26.9%
Cash-on-Cash Return
0.1%
Cap rate
0.5%
Rent to Value Ratio
Active
$550,000
2
bds
|
2
ba
|
1,048
sqft
|
built
2008
1750 N Bayshore Dr, Miami, FL 33132
$-999
Cash flow
-9.5%
Cash-on-Cash Return
4.1%
Cap rate
0.6%
Rent to Value Ratio
Active
$1,900,000
3
bds
|
4
ba
|
1,698
sqft
|
built
2017
2900 NE 7th Ave, Miami, FL 33137
$-7,555
Cash flow
-20.7%
Cash-on-Cash Return
1.5%
Cap rate
0.5%
Rent to Value Ratio
Active
$540,000
1
bds
|
1
ba
|
650
sqft
|
built
1998
2951 S Bayshore Dr, Miami, FL 33133
$-1,831
Cash flow
-17.7%
Cash-on-Cash Return
2.2%
Cap rate
0.6%
Rent to Value Ratio
Active
$679,999
4
bds
|
3
ba
|
1,680
sqft
|
built
2005
6311 NW 17th Ave, Miami, FL 33147
$-2,273
Cash flow
-17.4%
Cash-on-Cash Return
2.3%
Cap rate
0.3%
Rent to Value Ratio
Active
$1,835,000
3
bds
|
4
ba
|
2,165
sqft
|
built
2019
851 NE 1st Ave, Miami, FL 33132
$-7,288
Cash flow
-20.7%
Cash-on-Cash Return
1.5%
Cap rate
0.5%
Rent to Value Ratio
Active
$1,145,000
3
bds
|
2
ba
|
1,510
sqft
|
built
2001
1155 Brickell Bay Dr, Miami, FL 33131
$-4,923
Cash flow
-22.4%
Cash-on-Cash Return
1.1%
Cap rate
0.5%
Rent to Value Ratio