Miami, FL Investment Properties for Sale
Browse homes for sale and investment properties in Miami, FL. Refine your search by price, property type, or more.
Best cash flowing properties in Miami, FL
Active
$225,000
1
bds
|
1
ba
|
741
sqft
|
built
1971
3401 N Country Club Dr, Miami, FL 33180
$-526
Cash flow
-12.2%
Cash-on-Cash Return
3.5%
Cap rate
0.9%
Rent to Value Ratio
Active
$399,000
4
bds
|
2
ba
|
1,213
sqft
|
built
1988
546 SW 1st St, Miami, FL 33130
$-634
Cash flow
-8.3%
Cash-on-Cash Return
4.4%
Cap rate
0.7%
Rent to Value Ratio
6,307 out of 7,161 properties for sale in Miami, FL
Limited Results Shown
Create a free account, or log in to reveal all property listings and enjoy the complete experience.
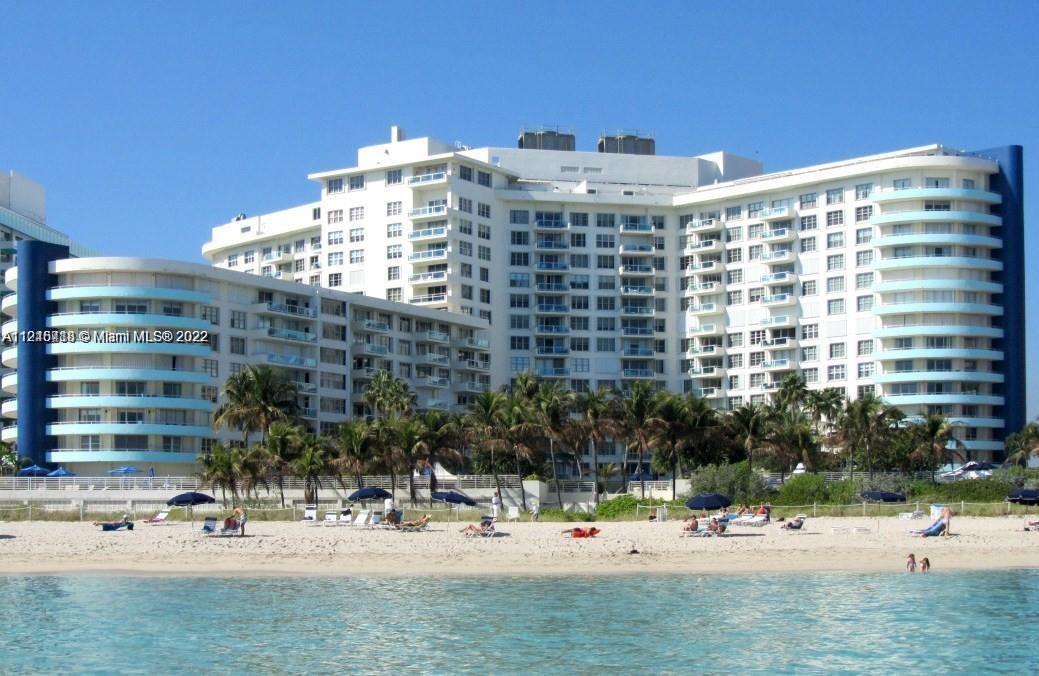
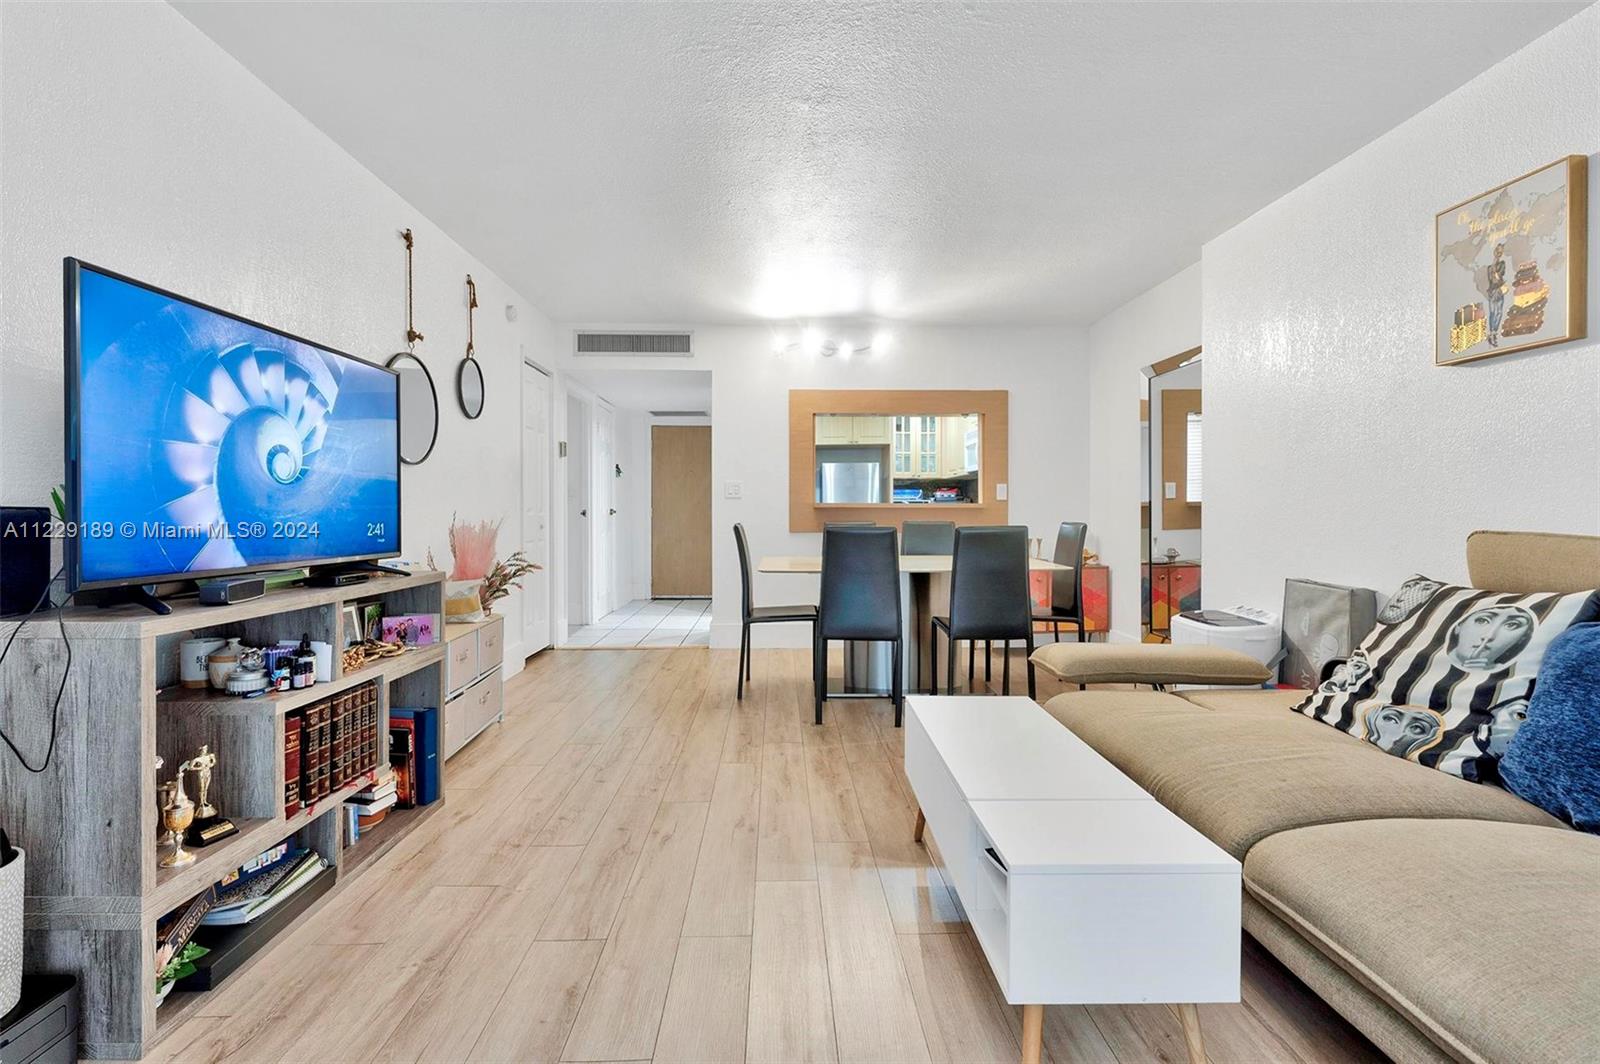
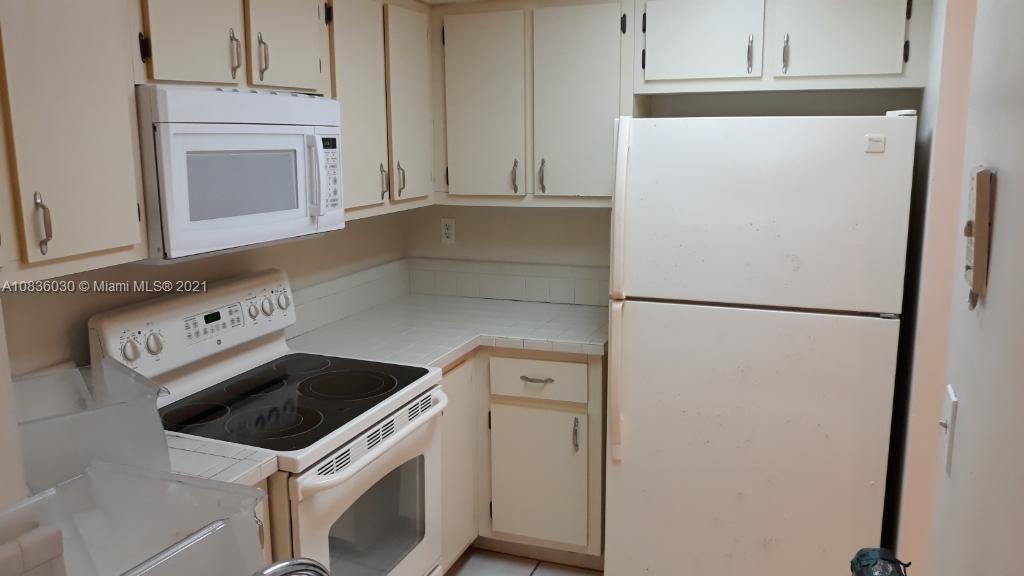
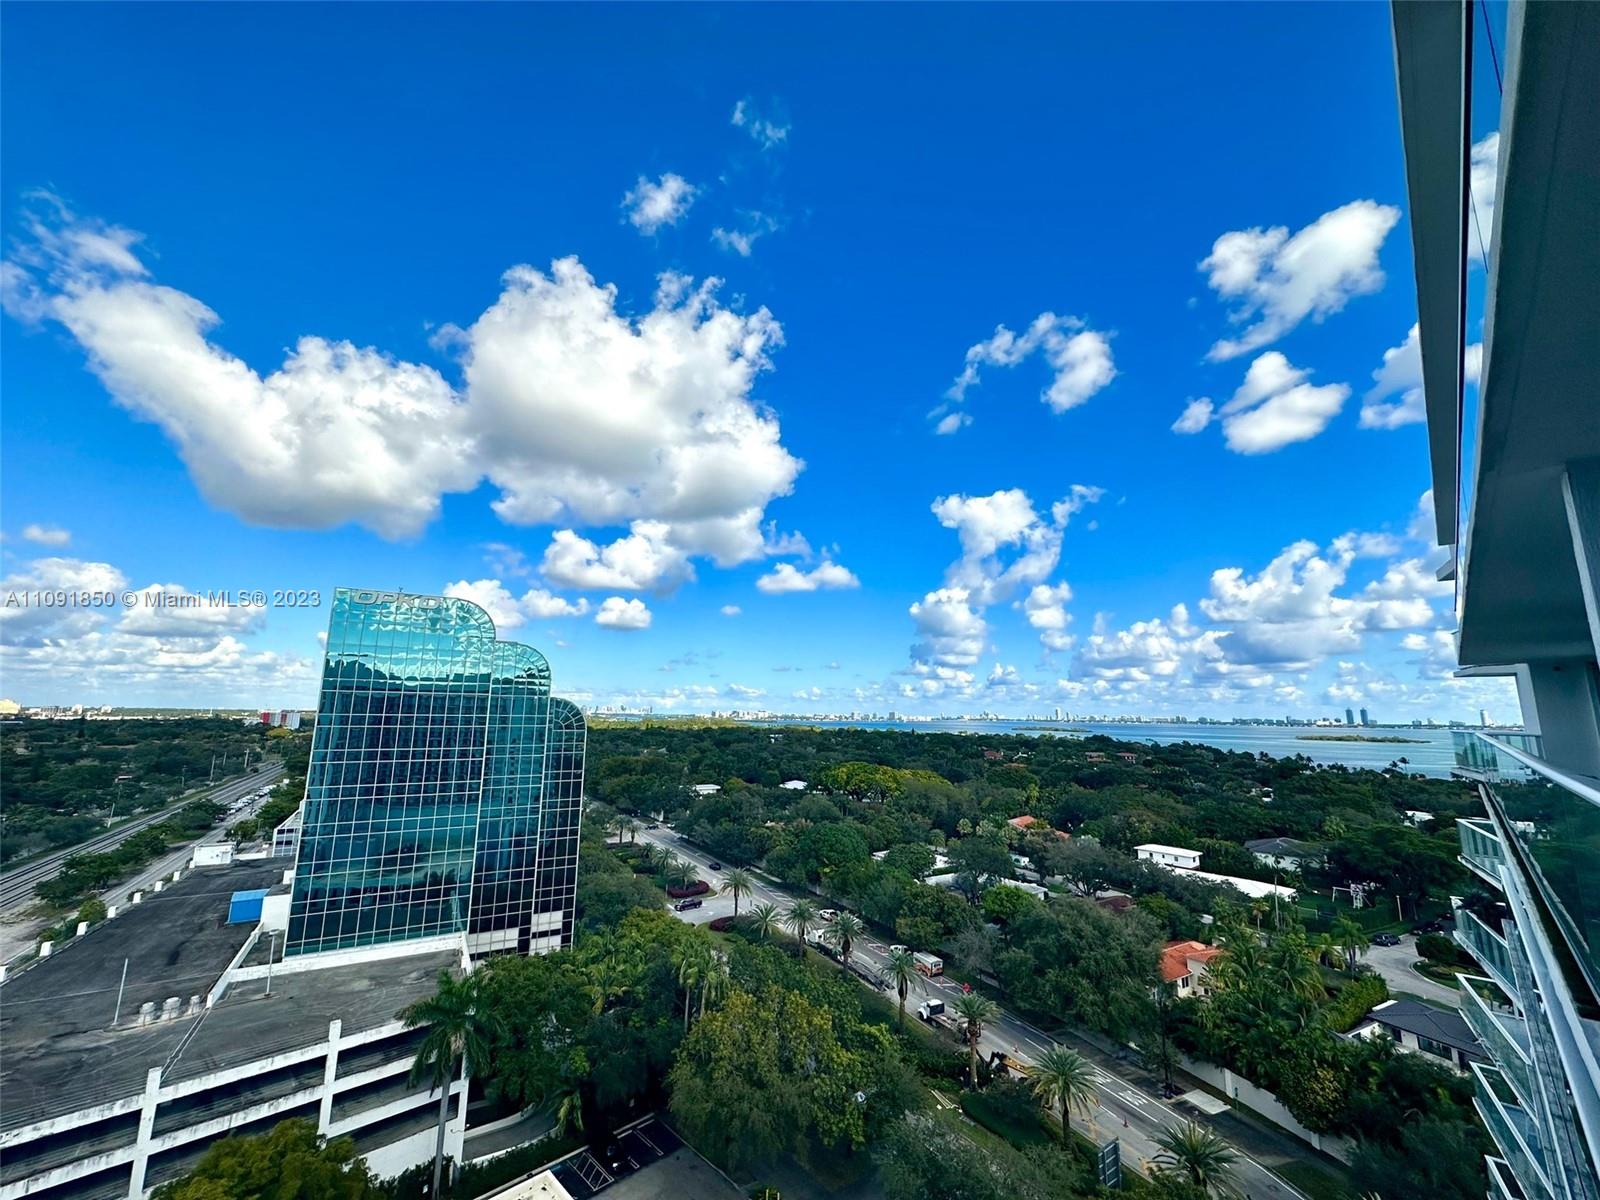
Active
$460,000
1
bds
|
1
ba
|
610
sqft
|
built
1966
5161 Collins Ave, Miami, FL 33140
$-1,450
Cash flow
-16.4%
Cash-on-Cash Return
2.5%
Cap rate
0.6%
Rent to Value Ratio
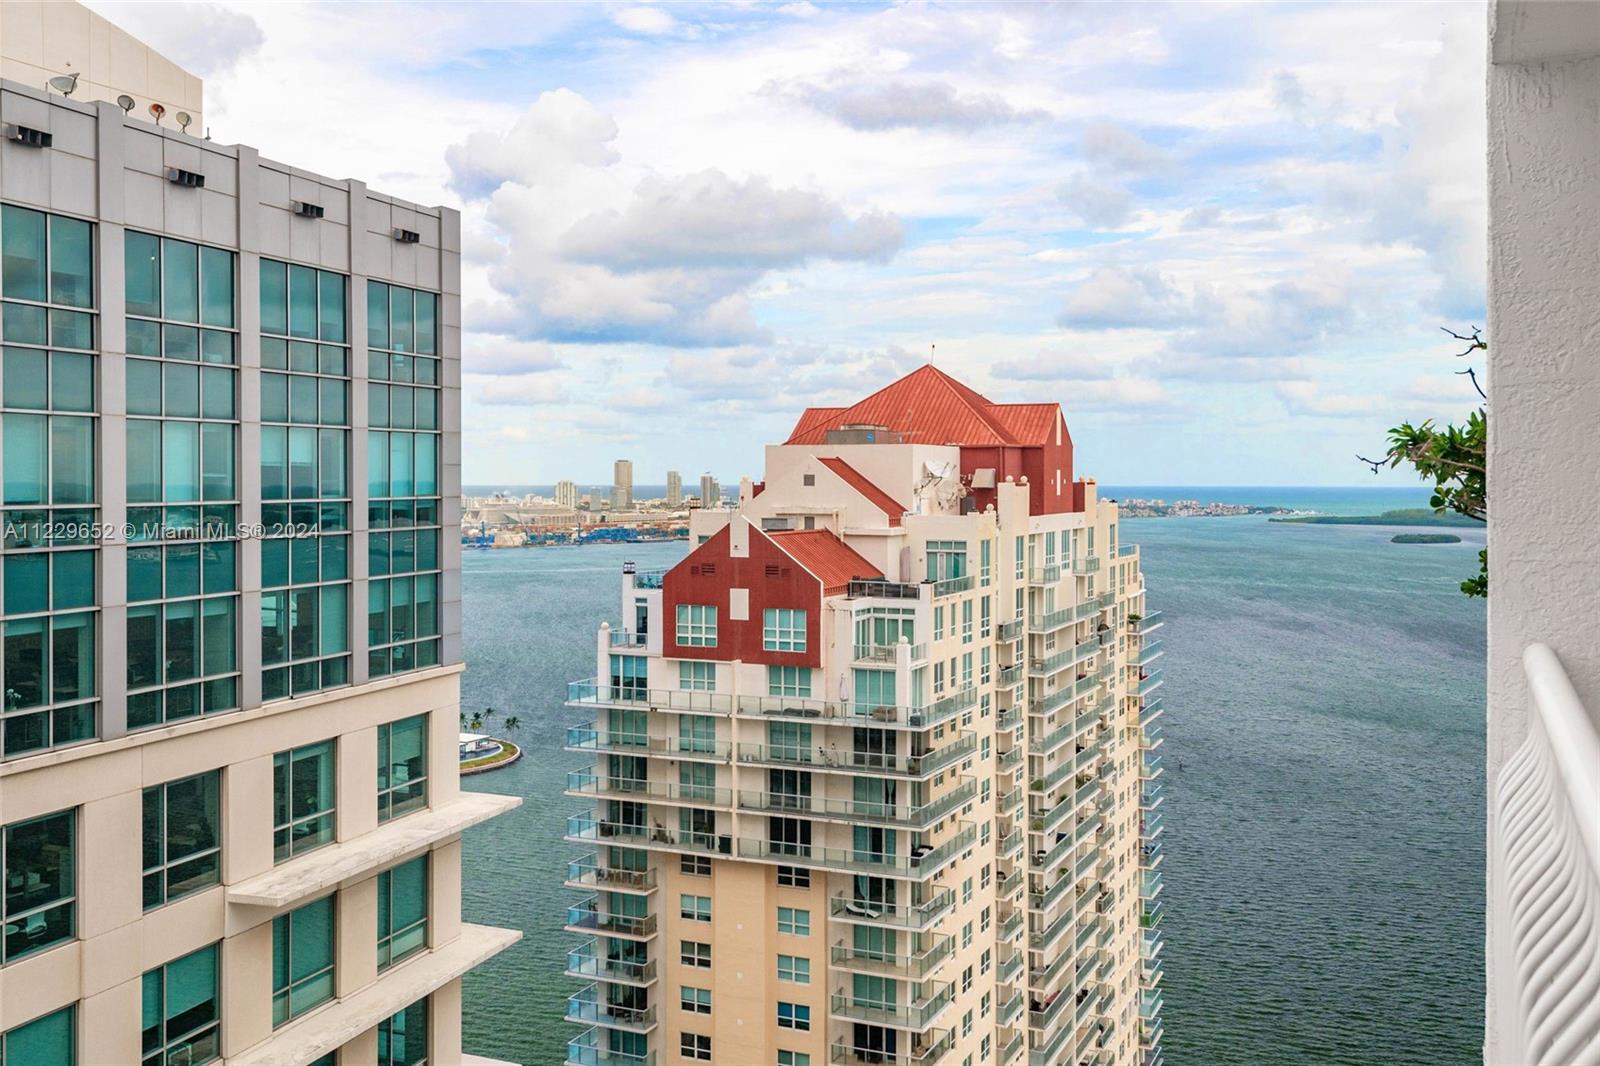
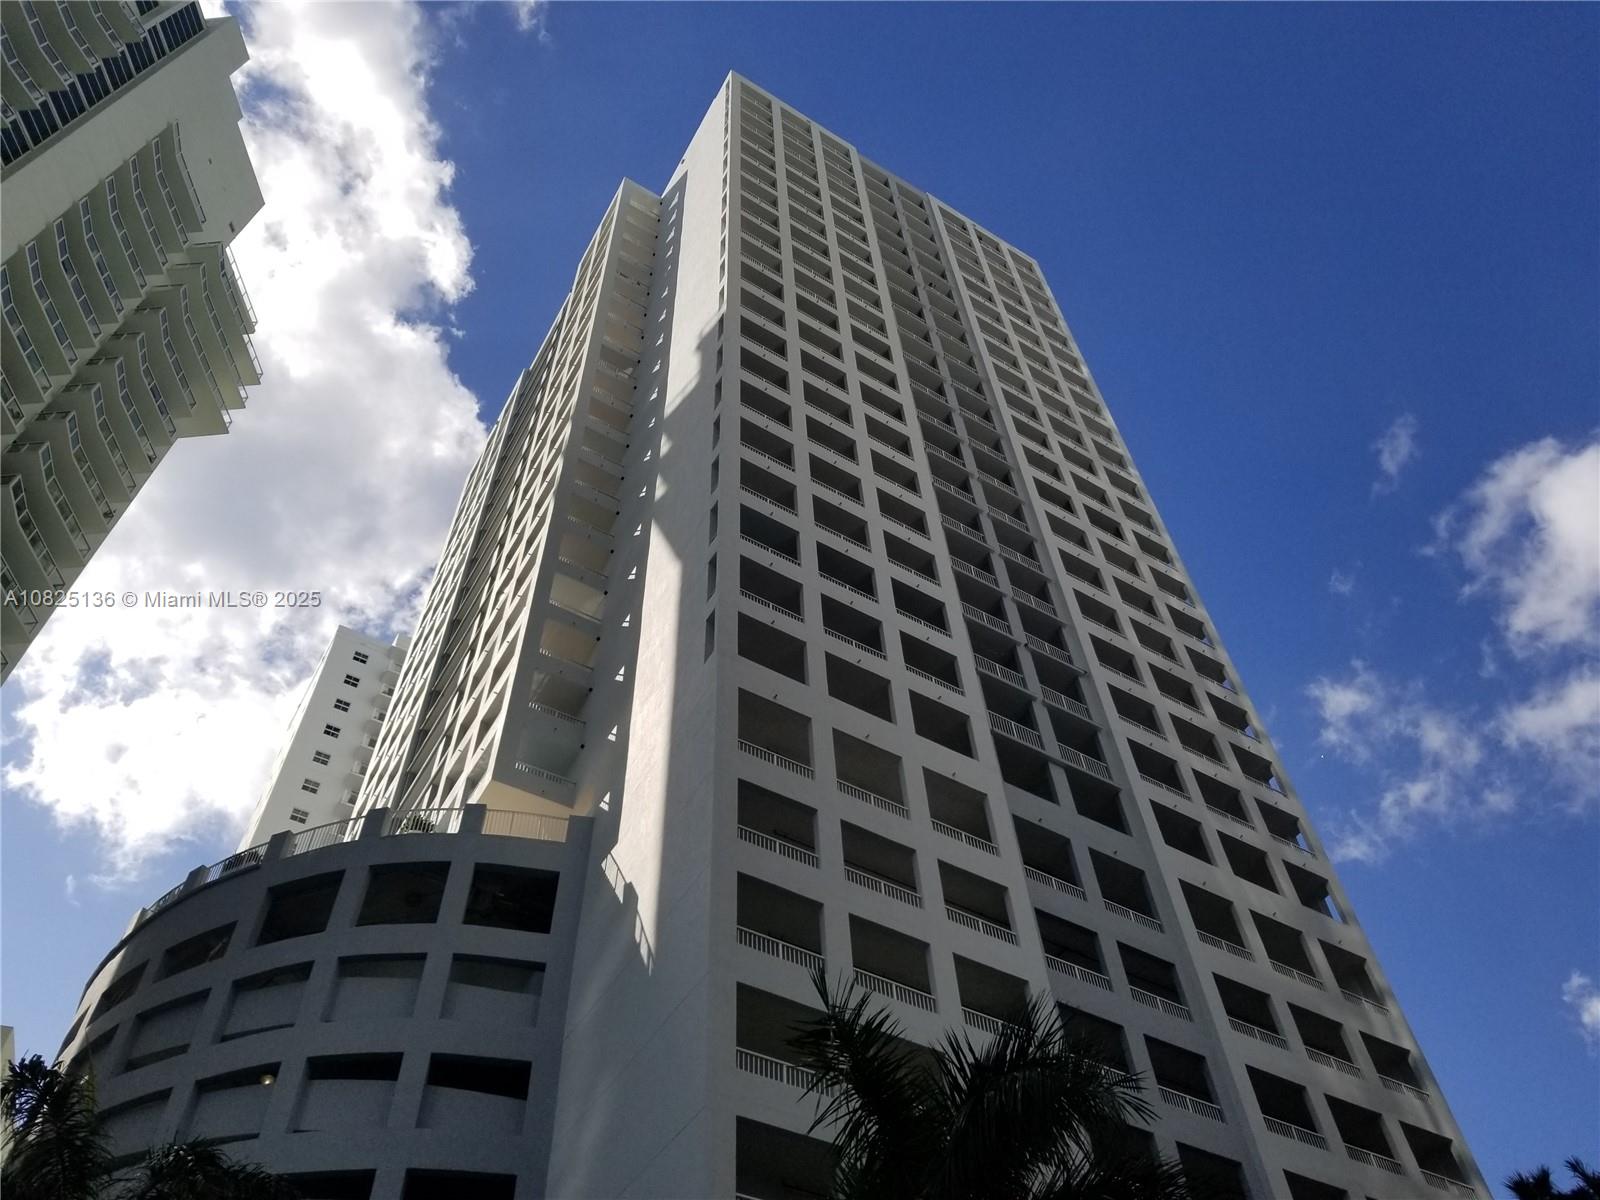
Active
$795,000
3
bds
|
2
ba
|
1,245
sqft
|
built
2005
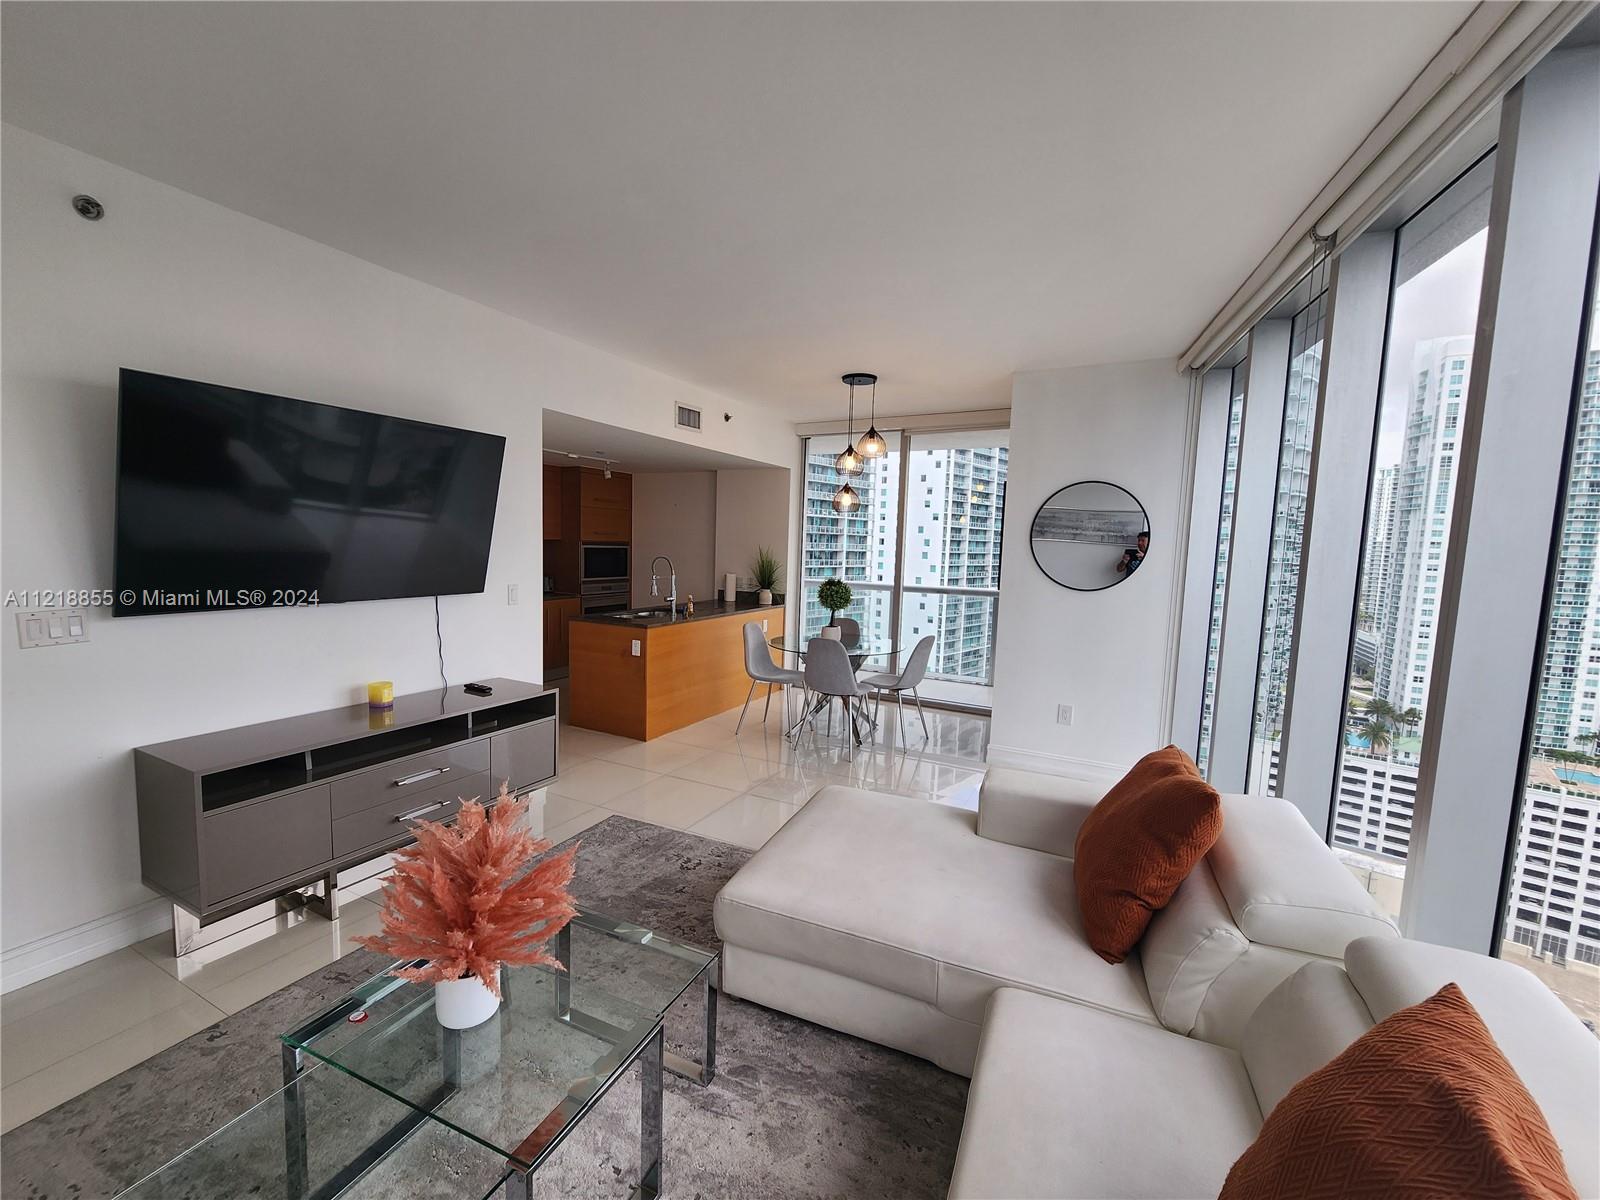
1200 Brickell Bay Dr, Miami, FL 33131
$-2,292
Cash flow
-15.0%
Cash-on-Cash Return
2.8%
Cap rate
0.6%
Rent to Value Ratio
Active
$225,000
1
bds
|
1
ba
|
741
sqft
|
built
1971
3401 N Country Club Dr, Miami, FL 33180
$-526
Cash flow
-12.2%
Cash-on-Cash Return
3.5%
Cap rate
0.9%
Rent to Value Ratio
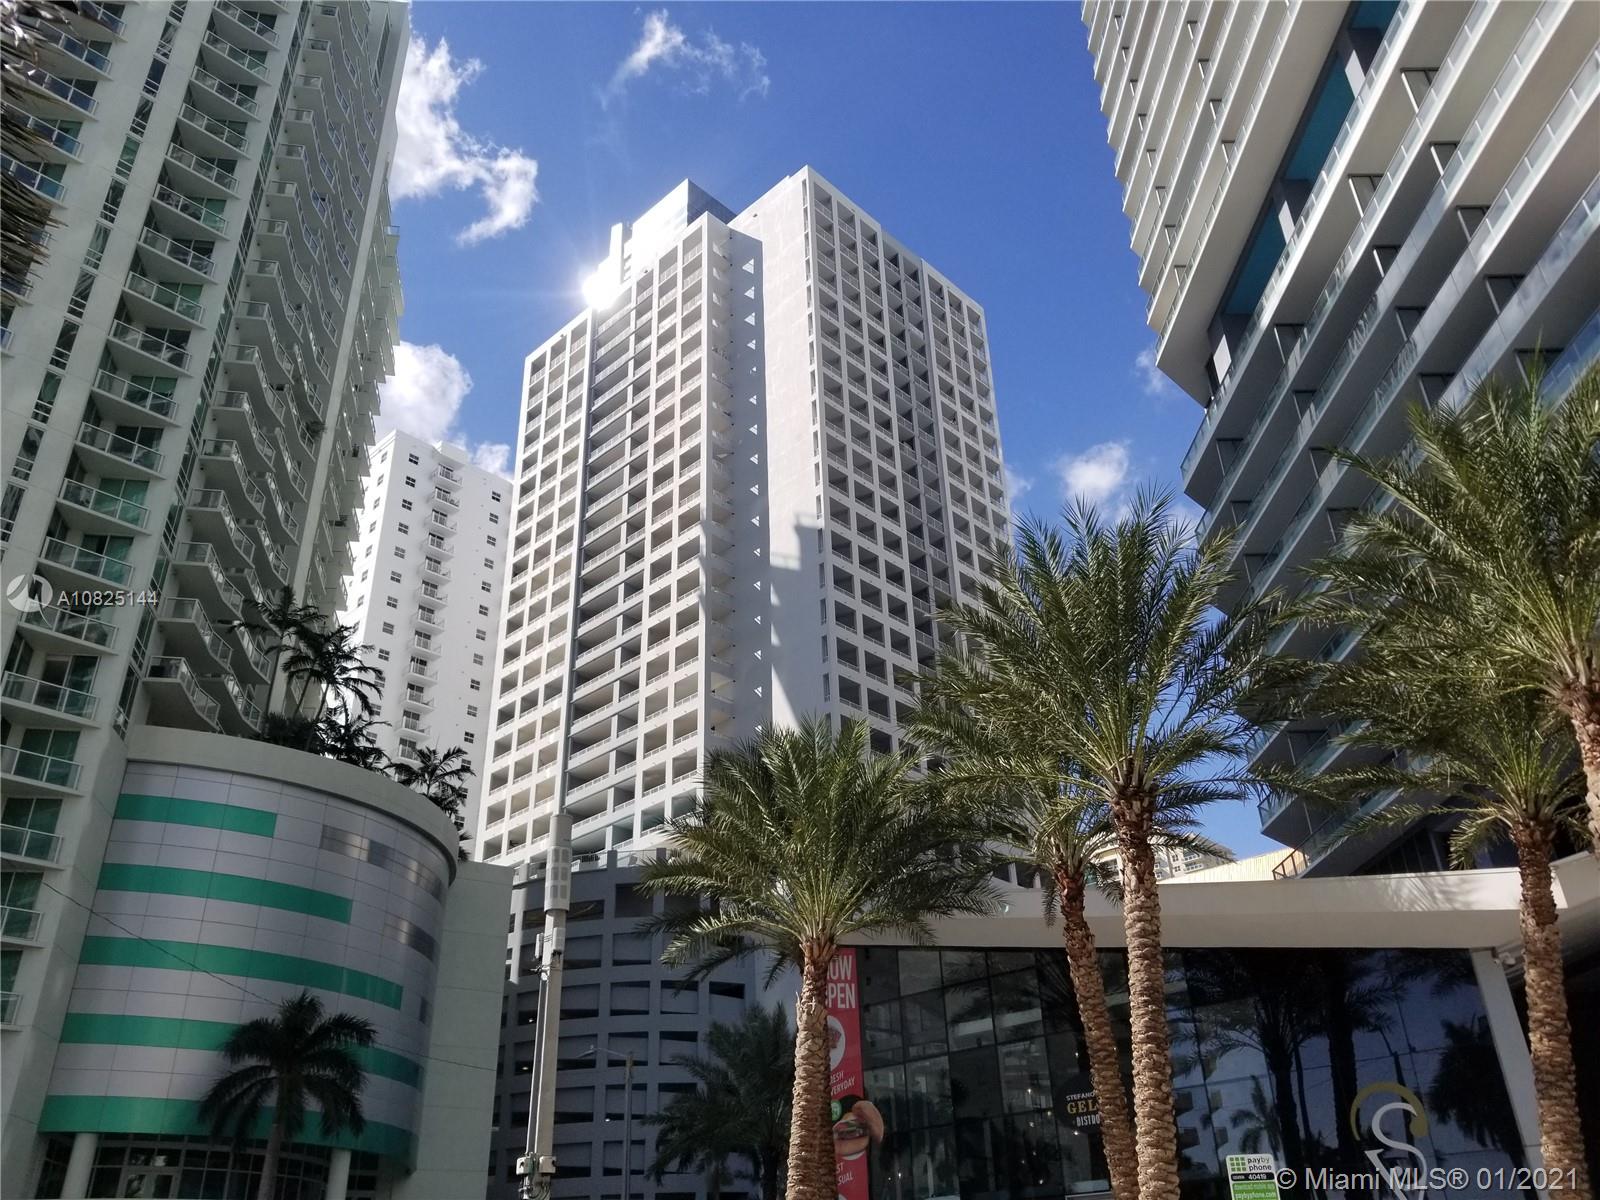
Active
$749,000
2
bds
|
3
ba
|
1,162
sqft
|
built
2008
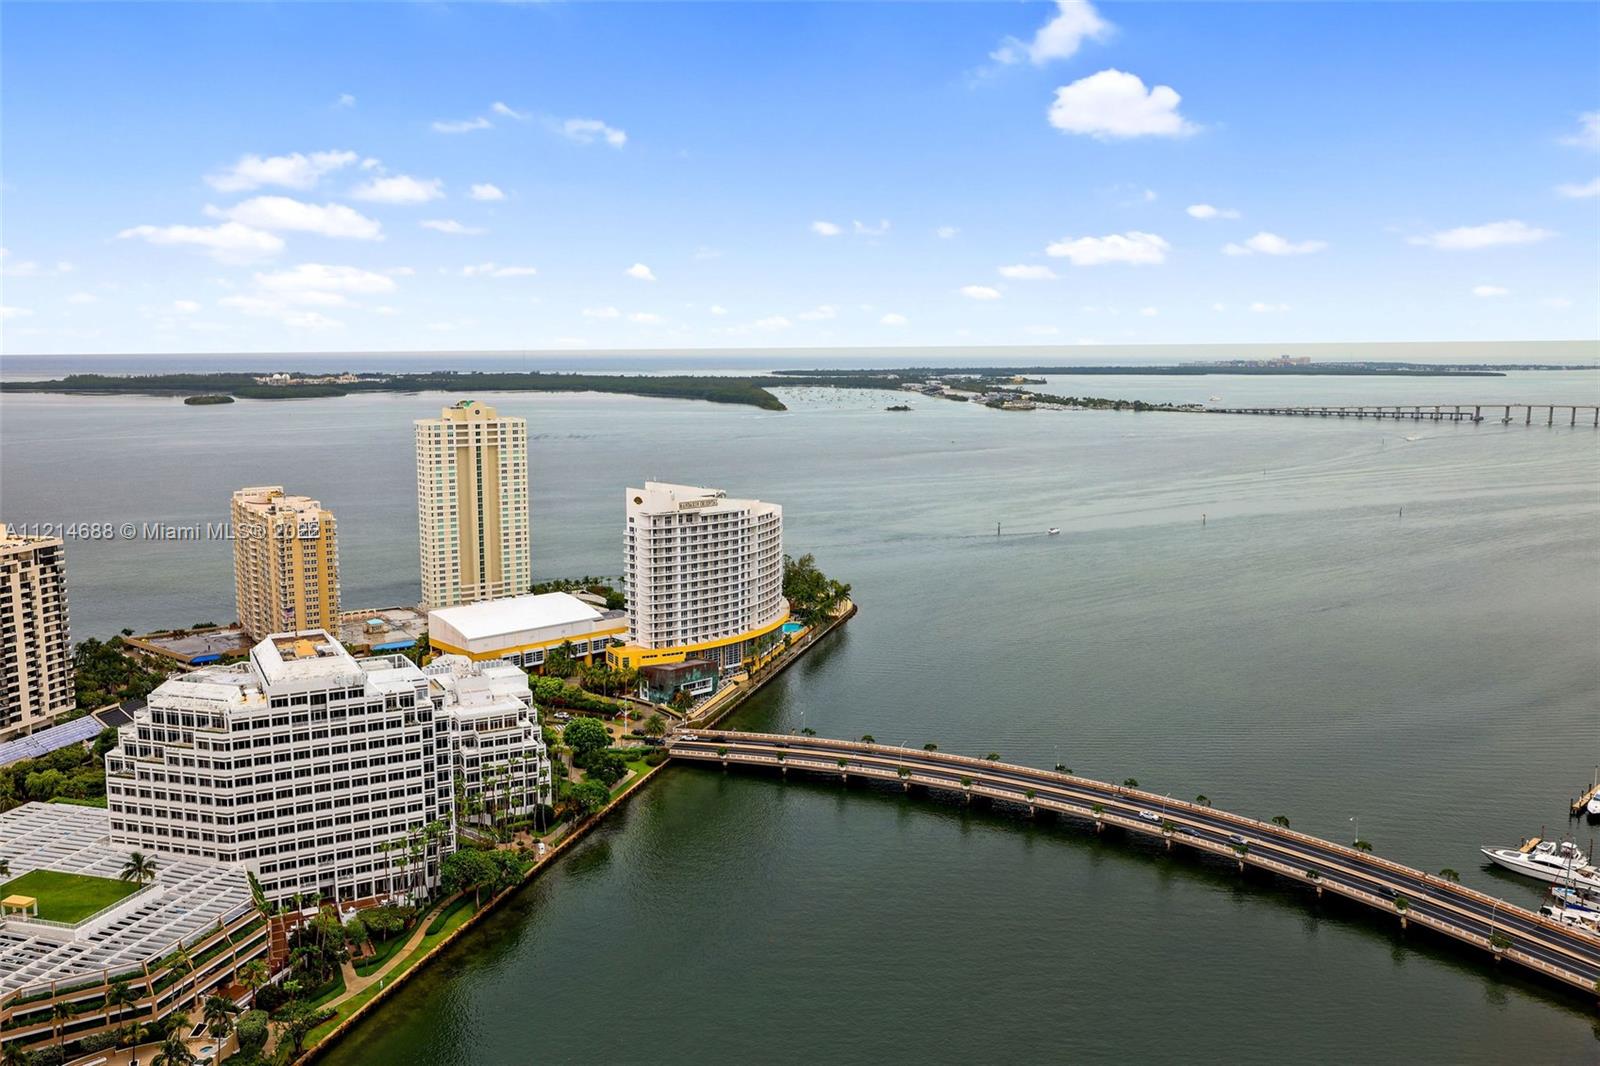
1900 N Bayshore Dr, Miami, FL 33132
$-2,542
Cash flow
-17.7%
Cash-on-Cash Return
2.2%
Cap rate
0.6%
Rent to Value Ratio
Active
$599,000
1
bds
|
1
ba
|
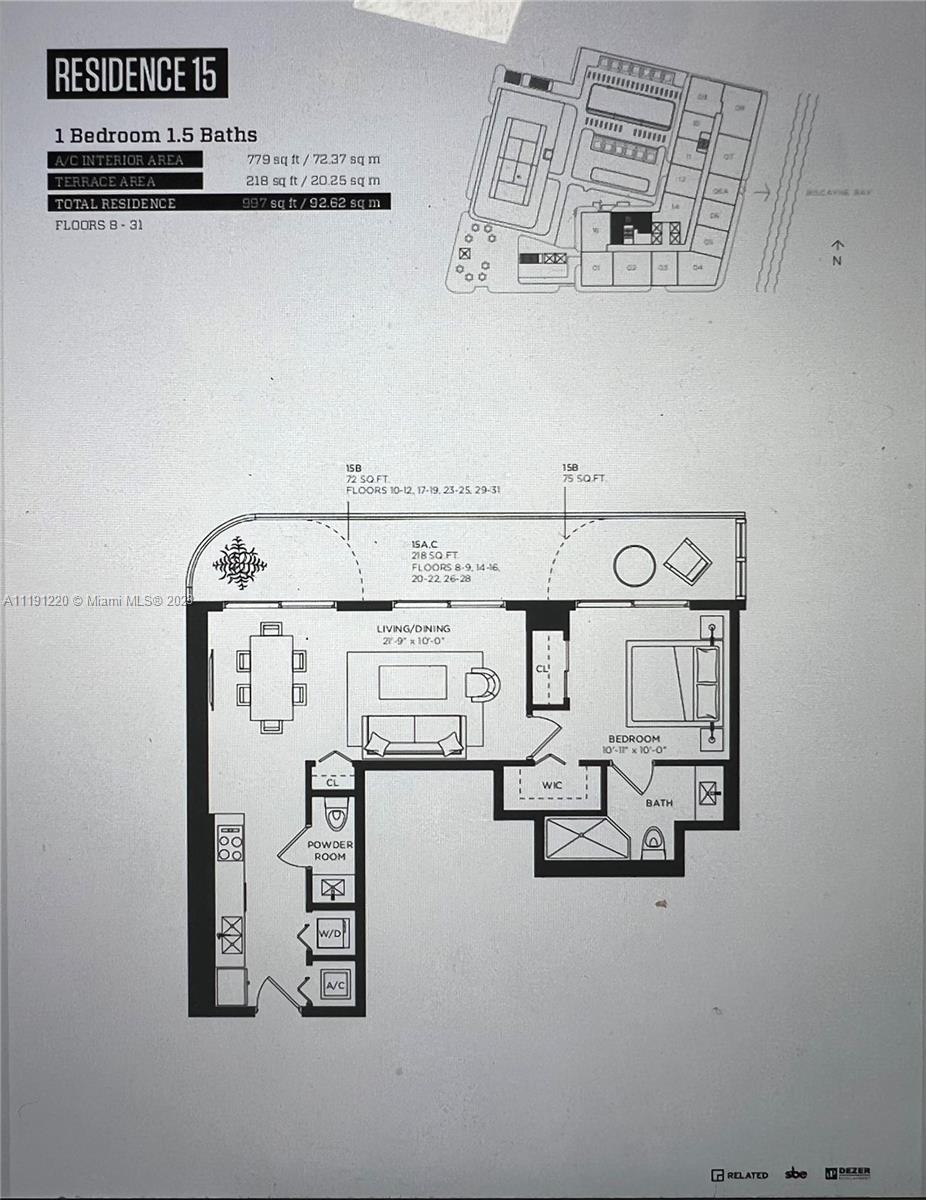
977
sqft
|
built
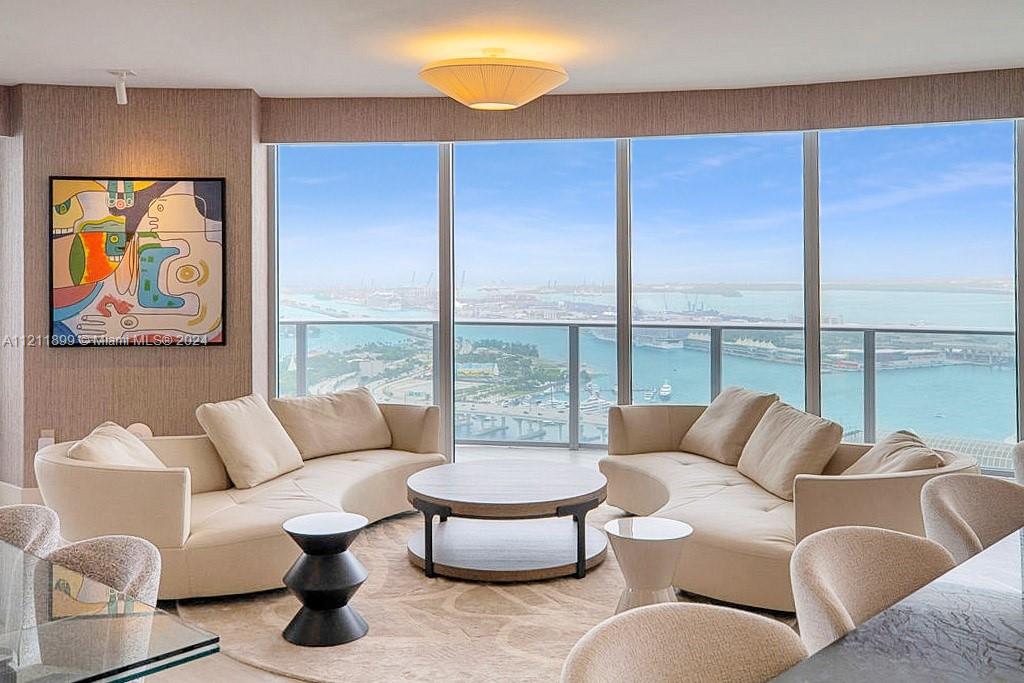
2014
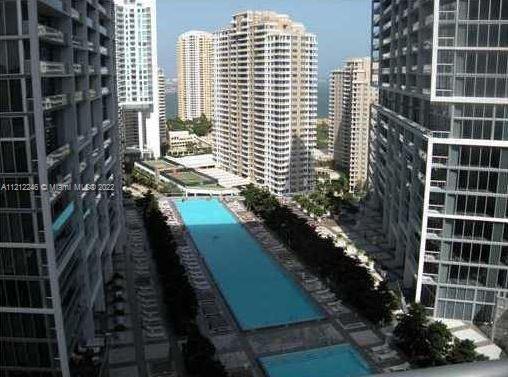
1100 S Miami Ave, Miami, FL 33130
$-1,517
Cash flow
-13.2%
Cash-on-Cash Return
3.2%
Cap rate
0.6%
Rent to Value Ratio
Active
$420,000
1
bds
|
1
ba
|
821
sqft
|
built
2007
1750 N Bayshore Dr, Miami, FL 33132
$-1,303
Cash flow
-16.2%
Cash-on-Cash Return
2.6%
Cap rate
0.7%
Rent to Value Ratio
Active
$898,000
1
bds
|
1
ba
|
743
sqft
|
built
2017
1451 Brickell Ave, Miami, FL 33131
$-3,714
Cash flow
-21.6%
Cash-on-Cash Return
1.3%
Cap rate
0.5%
Rent to Value Ratio
Active
$1,079,000
2
bds
|
2
ba
|
1,286
sqft
|
built
2009
485 Brickell Ave, Miami, FL 33131
$-4,505
Cash flow
-21.8%
Cash-on-Cash Return
1.3%
Cap rate
0.5%
Rent to Value Ratio
Active
$690,000
3
bds
|
2
ba
|
1,729
sqft
|
built
2000
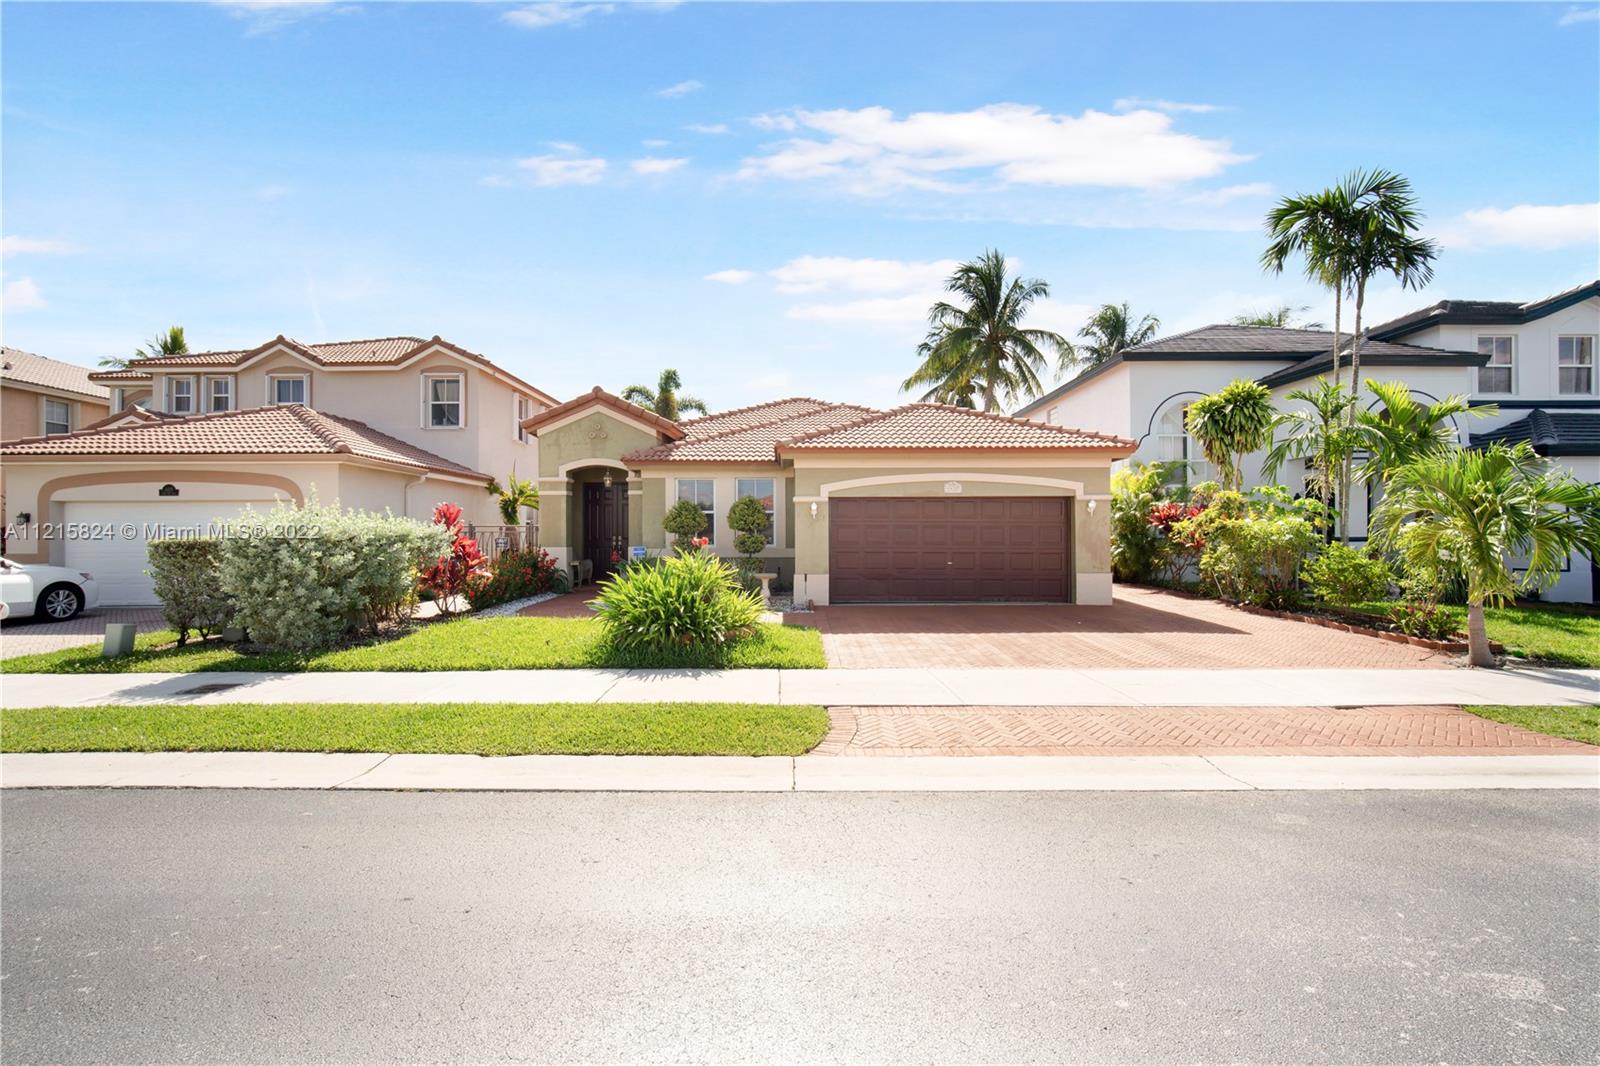
4437 SW 161st Path, Miami, FL 33185
$-1,372
Cash flow
-10.4%
Cash-on-Cash Return
3.9%
Cap rate
0.6%
Rent to Value Ratio
Active
$1,400,000
2
bds
|
2
ba
|
1,518
sqft
|
built
2009
495 Brickell Ave, Miami, FL 33131
$-5,191
Cash flow
-19.3%
Cash-on-Cash Return
1.8%
Cap rate
0.4%
Rent to Value Ratio
Active
$775,000
1
bds
|
1
ba
|
842
sqft
|
built
2009
485 Brickell Ave, Miami, FL 33131
$-2,121
Cash flow
-14.3%
Cash-on-Cash Return
3.0%
Cap rate
0.6%
Rent to Value Ratio
Active
$2,599,900
3
bds
|
4
ba
|
2,365
sqft
|
built
2018
488 NE 18th St, Miami, FL 33132
$-11,521
Cash flow
-23.1%
Cash-on-Cash Return
1.0%
Cap rate
0.4%
Rent to Value Ratio
Active
$550,000
1
bds
|
1
ba
|
650
sqft
|
built
1998
2951 S Bayshore Dr, Miami, FL 33133
$-1,993
Cash flow
-18.9%
Cash-on-Cash Return
1.9%
Cap rate
0.5%
Rent to Value Ratio
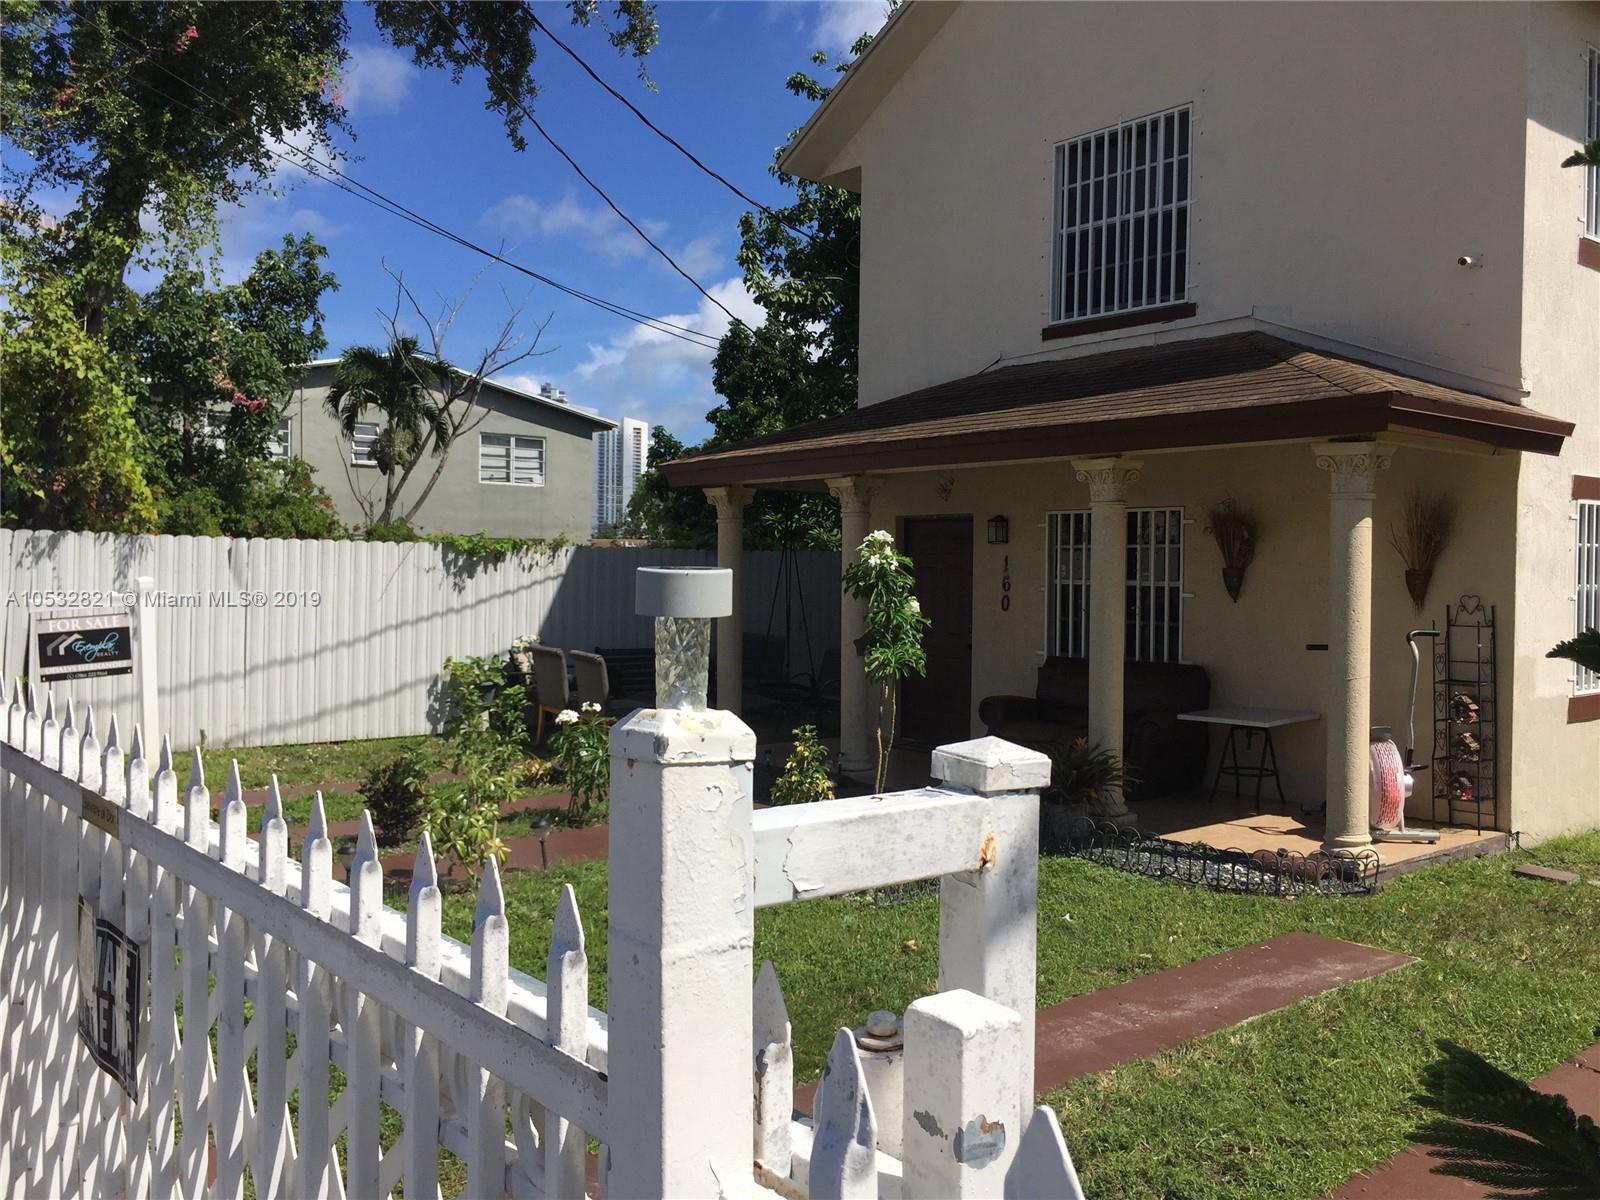
Active
$1,000,000
4
bds
|
0
ba
|
1,602
sqft
|
built
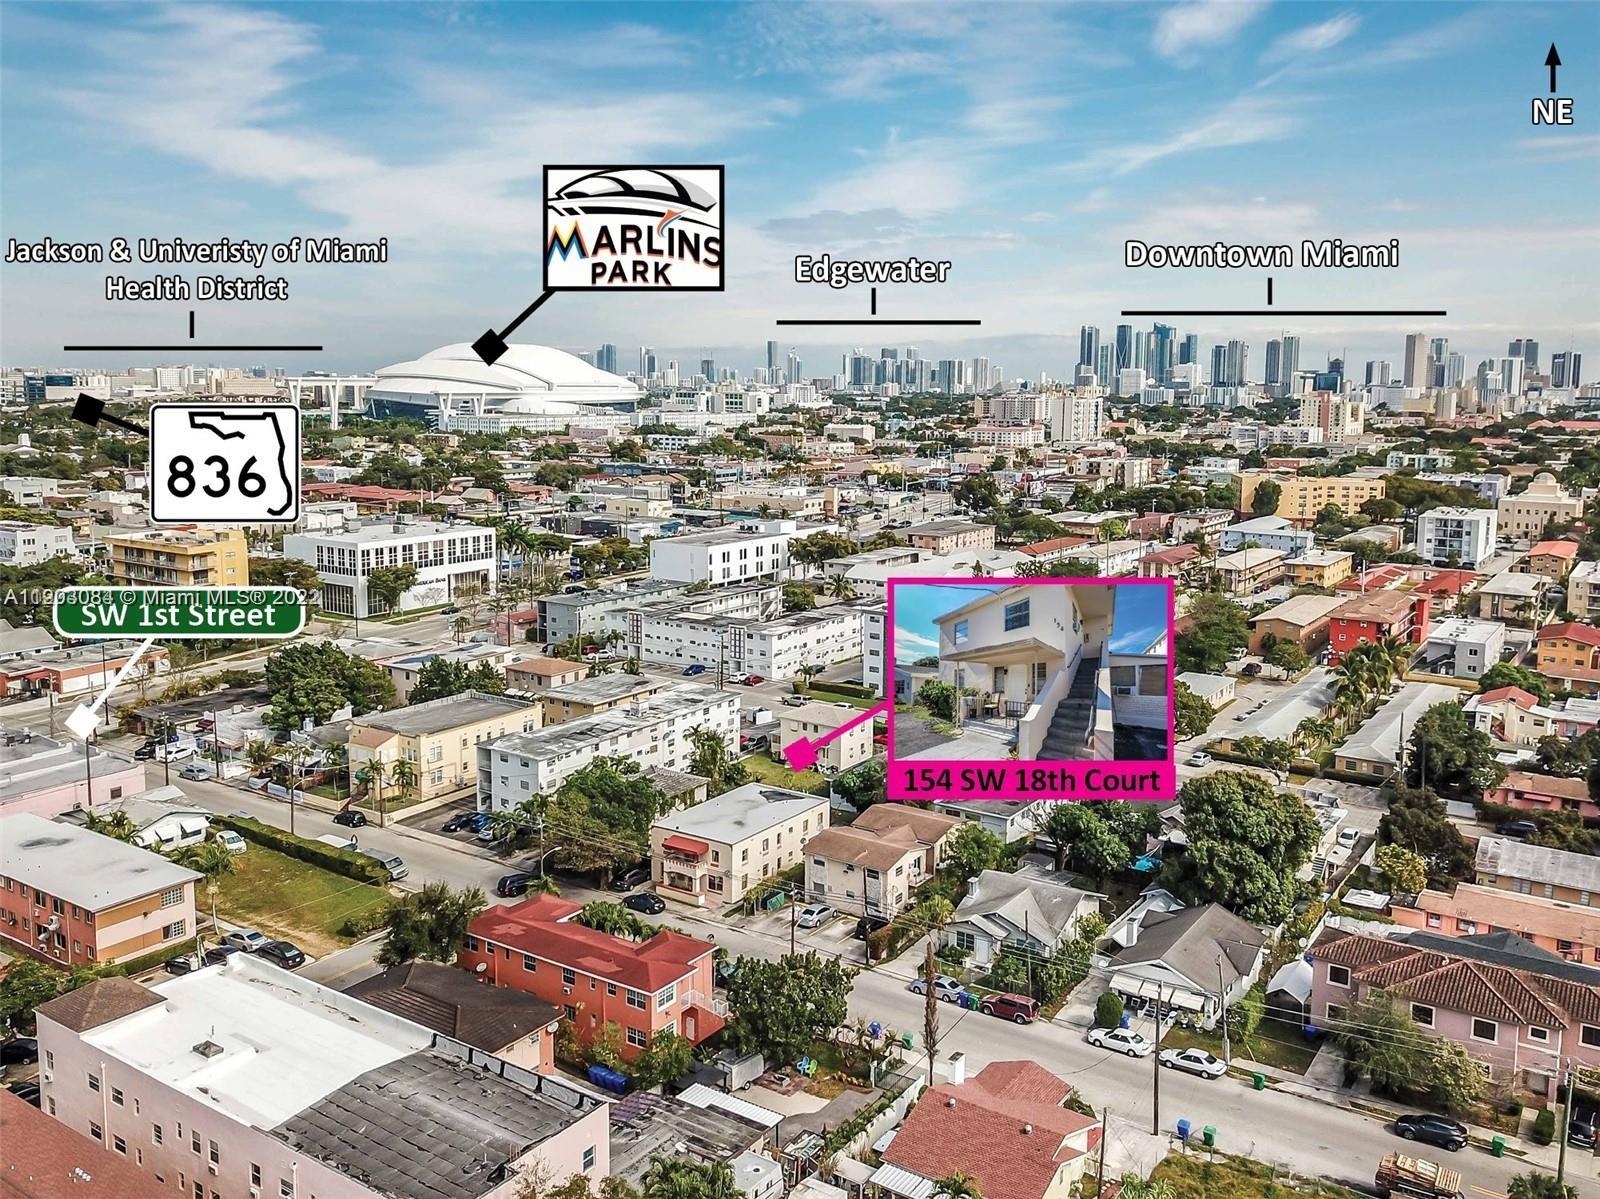
1926
154 SW 18th Ct, Miami, FL 33135
$-3,298
Cash flow
-17.2%
Cash-on-Cash Return
2.3%
Cap rate
0.4%
Rent to Value Ratio
Active
$550,000
1
bds
|
2
ba
|
621
sqft
|
built
2018
121 NE 34th St, Miami, FL 33137
$-1,441
Cash flow
-13.7%
Cash-on-Cash Return
3.1%
Cap rate
0.5%
Rent to Value Ratio
Active
$1,490,000
3
bds
|
4
ba
|
2,204
sqft
|
built
2019
851 NE 1st Ave, Miami, FL 33132
$-4,727
Cash flow
-16.6%
Cash-on-Cash Return
2.5%
Cap rate
0.7%
Rent to Value Ratio
Active
$865,000
3
bds
|
2
ba
|
1,672
sqft
|
built
1924
1703 SW 10th St, Miami, FL 33135
$-3,141
Cash flow
-18.9%
Cash-on-Cash Return
1.9%
Cap rate
0.3%
Rent to Value Ratio
Active
$450,000
1
bds
|
1
ba
|
526
sqft
|
built
2016
151 SE 1st St, Miami, FL 33131
$-1,702
Cash flow
-19.7%
Cash-on-Cash Return
1.7%
Cap rate
0.5%
Rent to Value Ratio

Active
$950,000
2
bds
|
3
ba
|
1,186
sqft
|
built
2019
480 NE 31st St, Miami, FL 33137
$-3,266
Cash flow
-17.9%
Cash-on-Cash Return
2.2%
Cap rate
0.6%
Rent to Value Ratio
Active
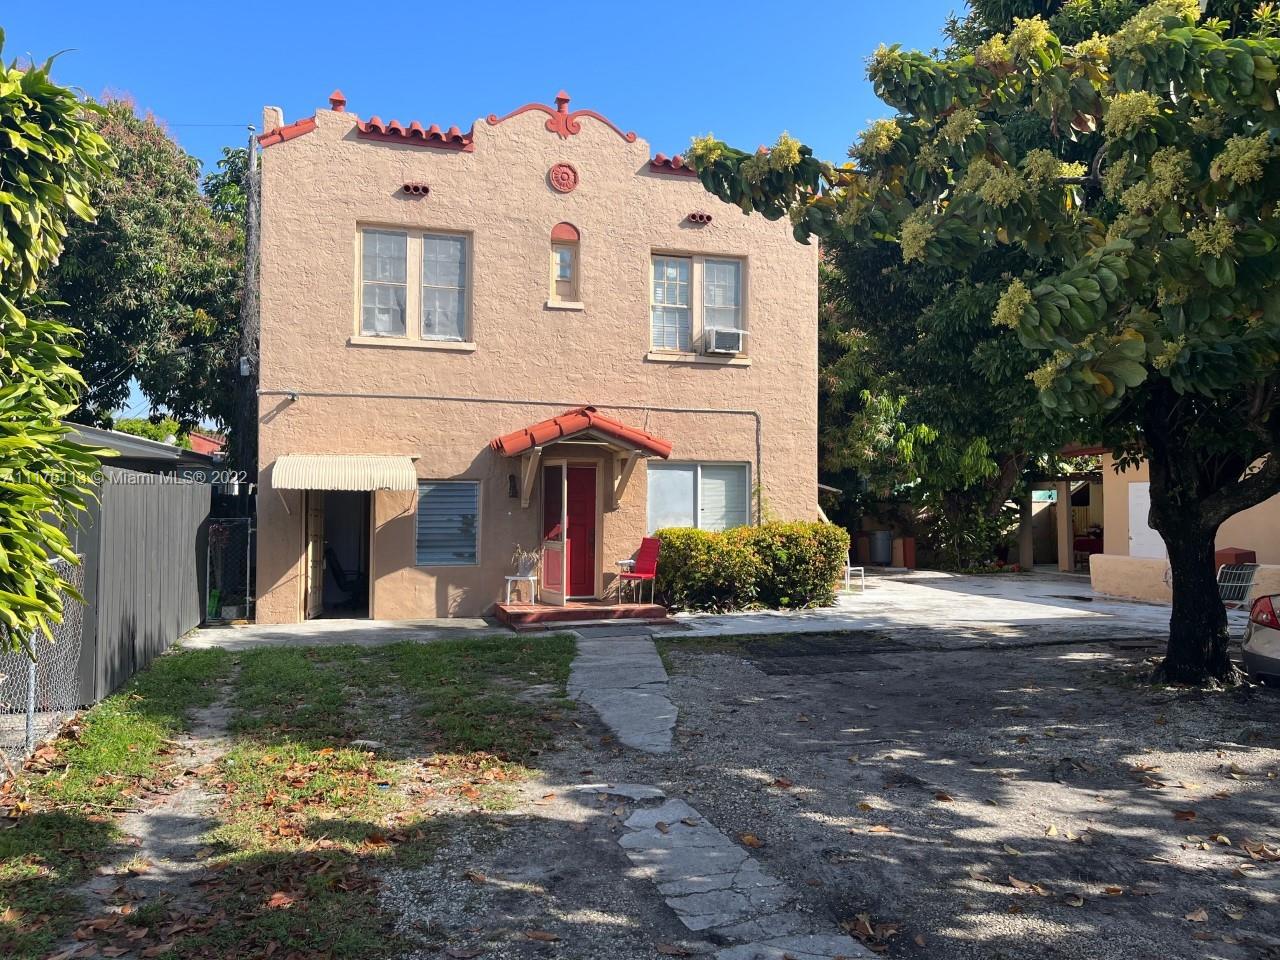
$1,200,000
2
bds
|
0
ba
|
1,620
sqft
|
built
1923
68 NW 45th St, Miami, FL 33127
$-4,221
Cash flow
-18.4%
Cash-on-Cash Return
2.1%
Cap rate
0.3%
Rent to Value Ratio
Active
$496,000
2
bds
|
2
ba
|
1,183
sqft
|
built
2015
4250 Biscayne Blvd, Miami, FL 33137
$-2,843
Cash flow
-29.9%
Cash-on-Cash Return
-0.6%
Cap rate
0.7%
Rent to Value Ratio
Active
$399,000
4
bds
|
2
ba
|
1,213
sqft
|
built
1988
546 SW 1st St, Miami, FL 33130
$-634
Cash flow
-8.3%
Cash-on-Cash Return
4.4%
Cap rate
0.7%
Rent to Value Ratio
Active
$465,000
1
bds
|
1
ba
|
630
sqft
|
built
2006
170 SE 14th St, Miami, FL 33131
$-1,240
Cash flow
-13.9%
Cash-on-Cash Return
3.1%
Cap rate
0.7%
Rent to Value Ratio
Active
$465,000
1
bds
|
1
ba
|
630
sqft
|
built
2006
170 SE 14th St, Miami, FL 33131
$-1,662
Cash flow
-18.6%
Cash-on-Cash Return
2.0%
Cap rate
0.5%
Rent to Value Ratio
Active
$4,000,000
3
bds
|
3
ba
|
1,520
sqft
|
built
2006
160 NW 27th St, Miami, FL 33127
$-18,432
Cash flow
-24.0%
Cash-on-Cash Return
0.8%
Cap rate
0.1%
Rent to Value Ratio

Active
$565,900
1
bds
|
2
ba
|
822
sqft
|
built
2008
200 Biscayne Boulevard Way, Miami, FL 33131
$-1,956
Cash flow
-18.0%
Cash-on-Cash Return
2.1%
Cap rate
0.7%
Rent to Value Ratio
Active
$450,000
1
bds
|
1
ba
|
738
sqft
|
built
2008
55 SE 6th St, Miami, FL 33131
$-1,187
Cash flow
-13.8%
Cash-on-Cash Return
3.1%
Cap rate
0.7%
Rent to Value Ratio