Miami, FL Investment Properties for Sale
Browse homes for sale and investment properties in Miami, FL. Refine your search by price, property type, or more.
Best cash flowing properties in Miami, FL
Active
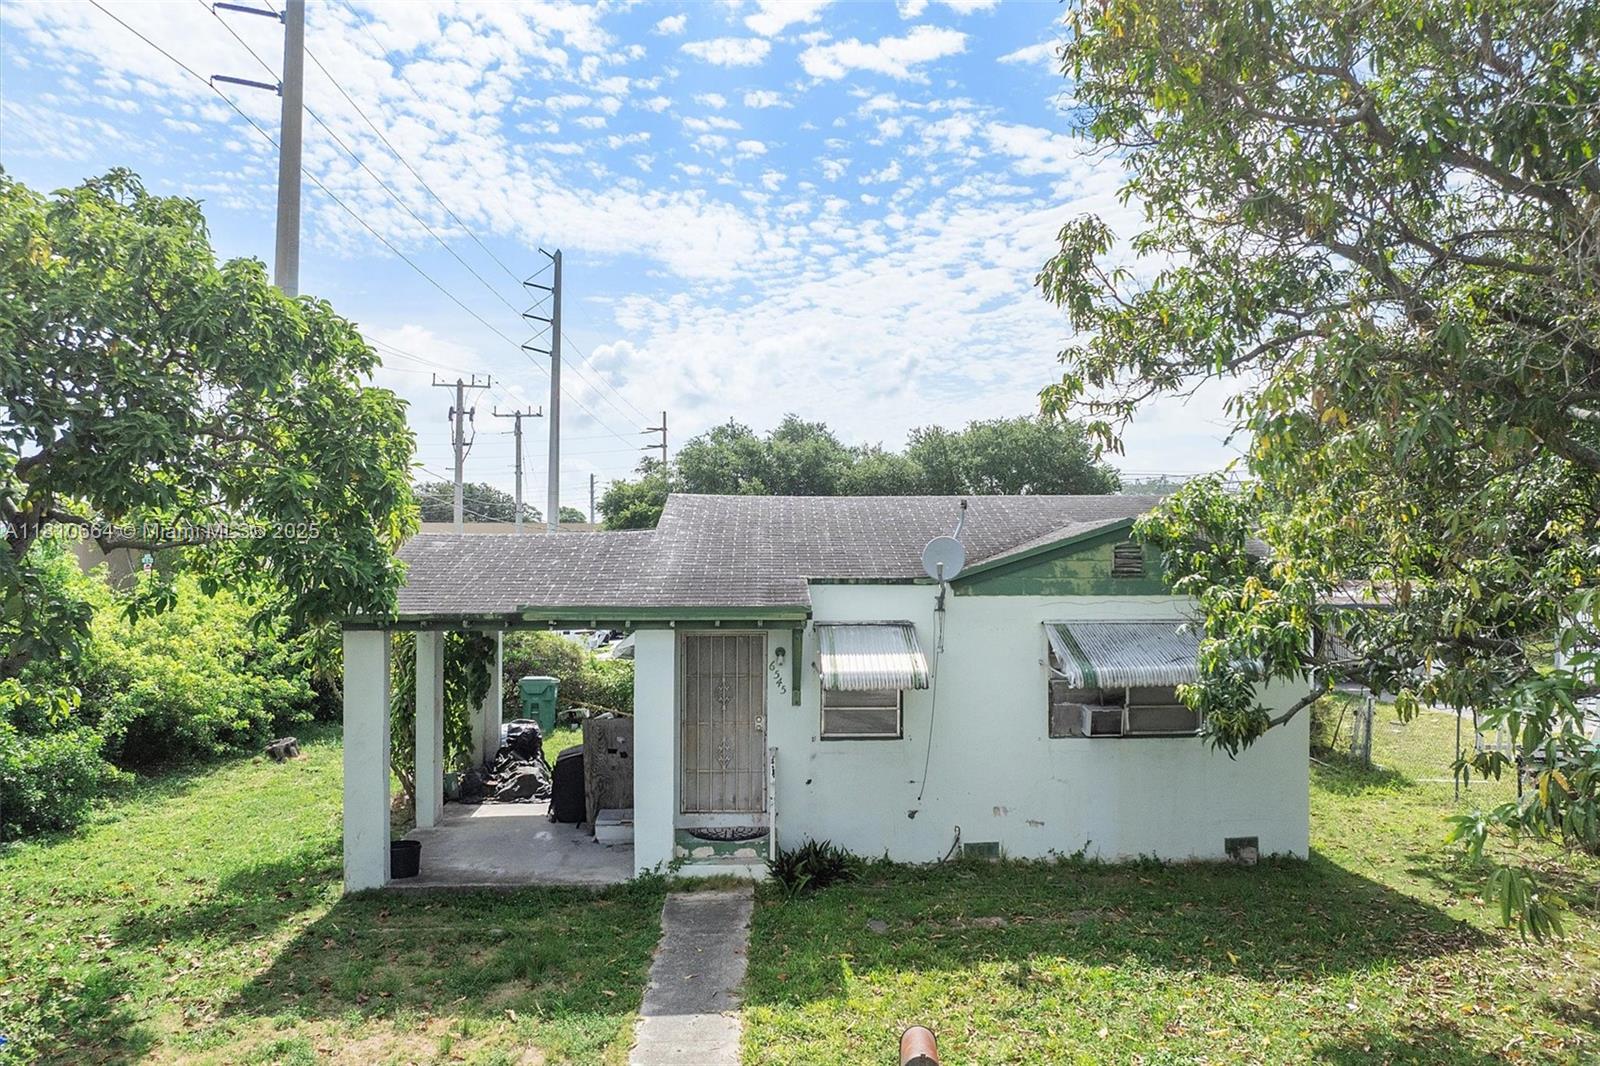
$365,000
2
bds
|
1
ba
|
650
sqft
|
built
1945
6545 NW 6th Ave, Miami, FL 33150
$-403
Cash flow
-5.8%
Cash-on-Cash Return
5.0%
Cap rate
0.6%
Rent to Value Ratio

Active
$190,000
1
bds
|
2
ba
|
861
sqft
|
built
1968
1301 NE Miami Gardens Dr, Miami, FL 33179
$-404
Cash flow
-11.1%
Cash-on-Cash Return
3.7%
Cap rate
0.9%
Rent to Value Ratio
6,231 out of 7,073 properties for sale in Miami, FL
Limited Results Shown
Create a free account, or log in to reveal all property listings and enjoy the complete experience.
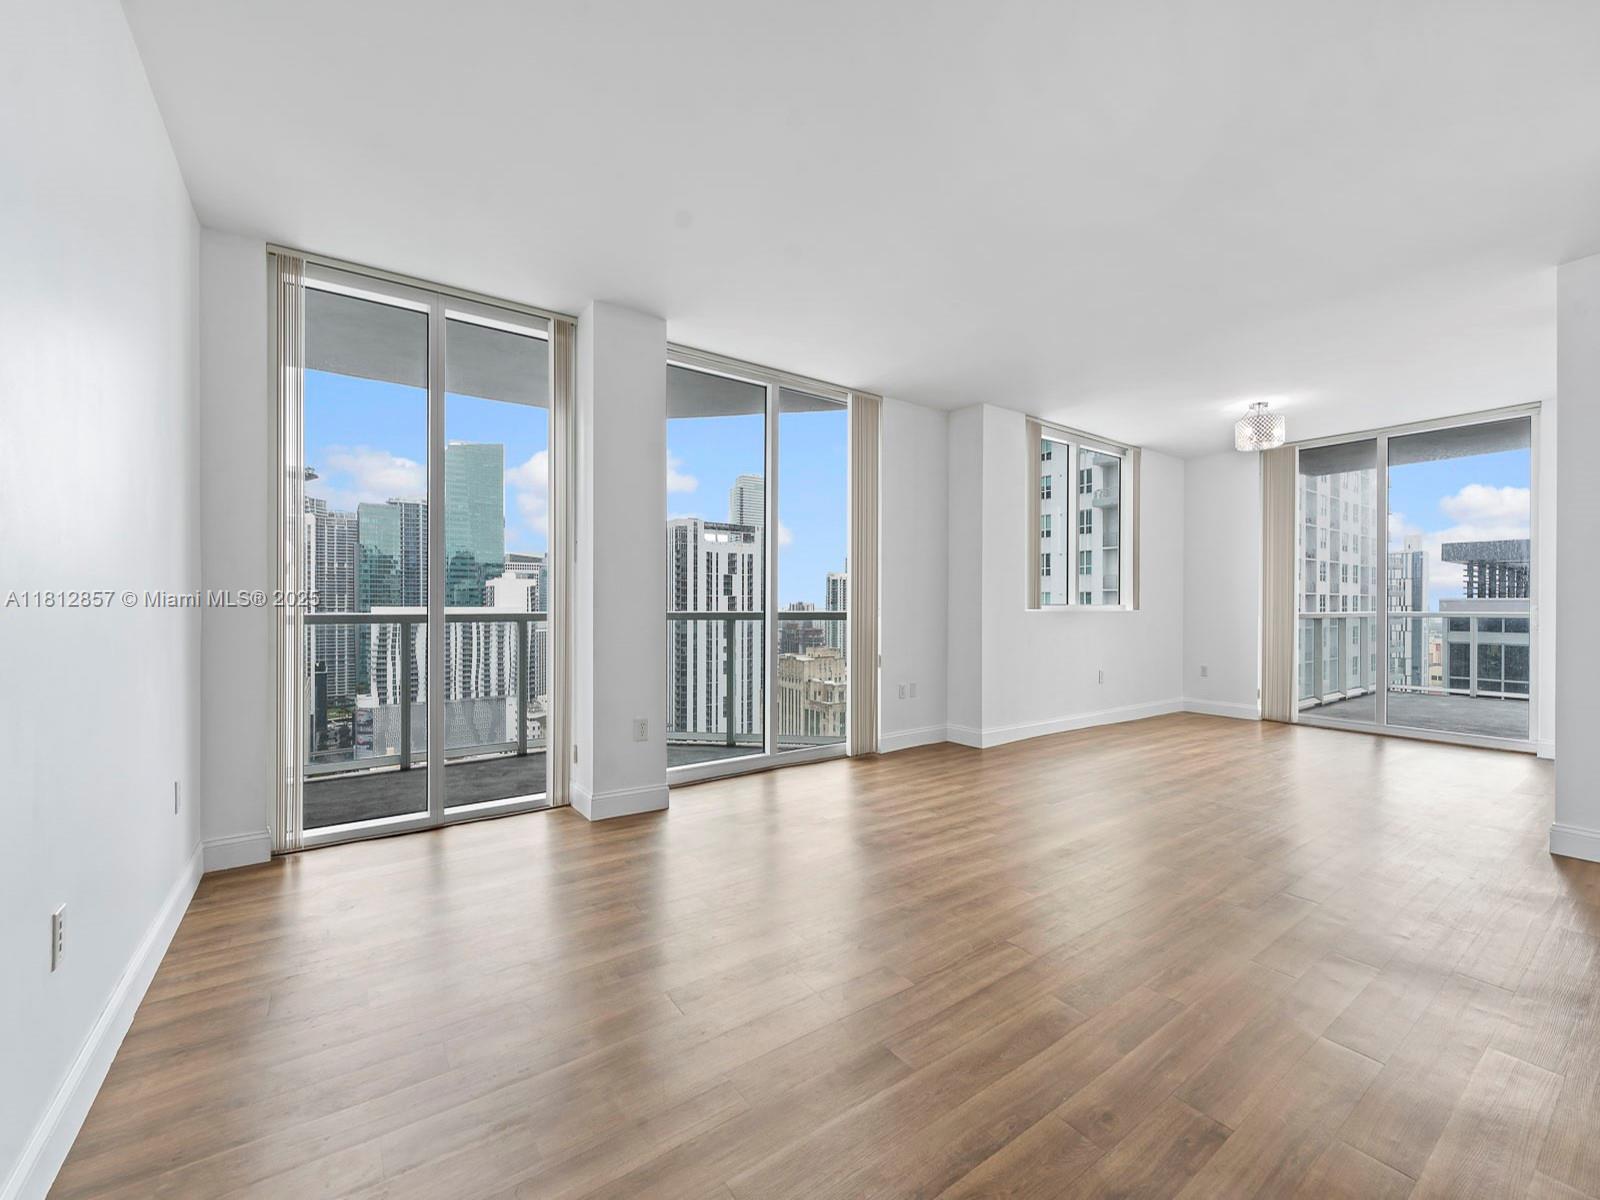
Active
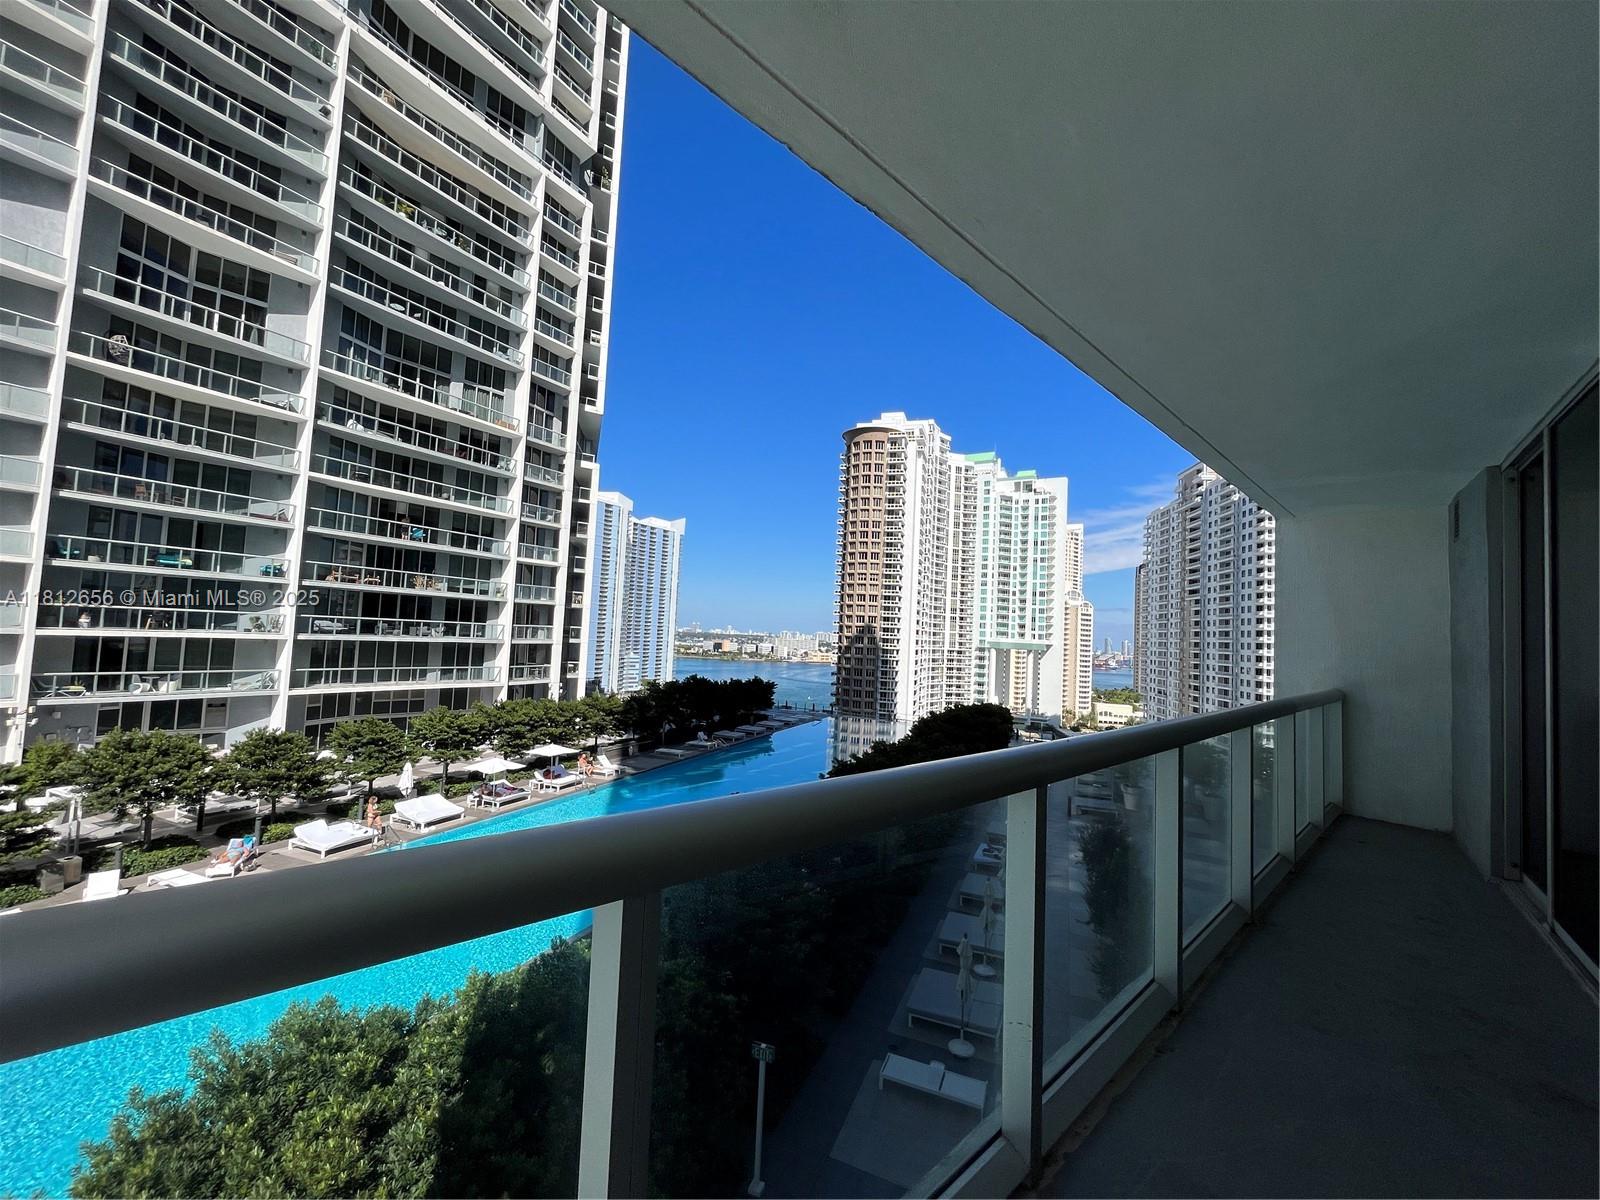
$850,000
2
bds
|
2
ba
|
1,327
sqft
|
built
2009
495 Brickell Ave, Miami, FL 33131
$-3,668
Cash flow
-22.5%
Cash-on-Cash Return
1.1%
Cap rate
0.6%
Rent to Value Ratio
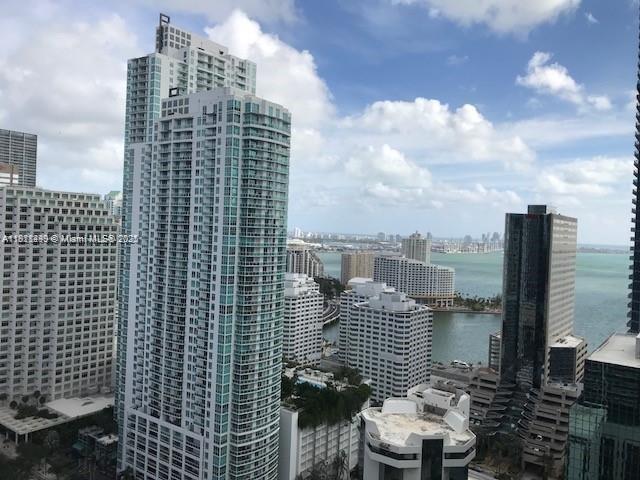
Active
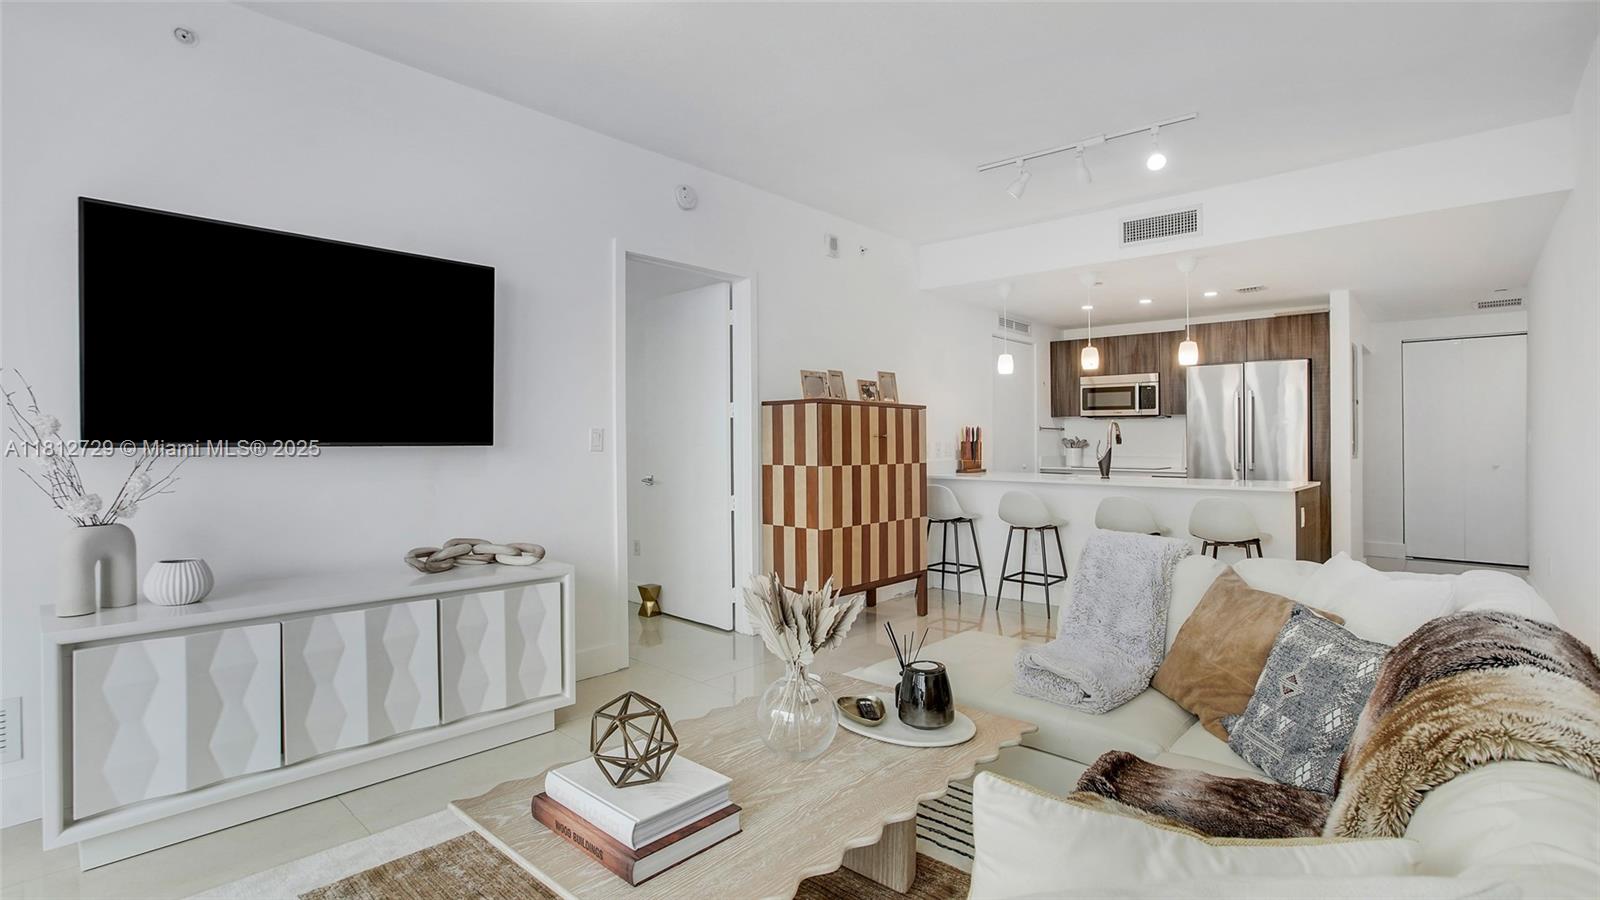
$685,000
1
bds
|
2
ba
|
888
sqft
|
built
2018
488 NE 18th St, Miami, FL 33132
$-2,316
Cash flow
-17.6%
Cash-on-Cash Return
2.2%
Cap rate
0.7%
Rent to Value Ratio
Active
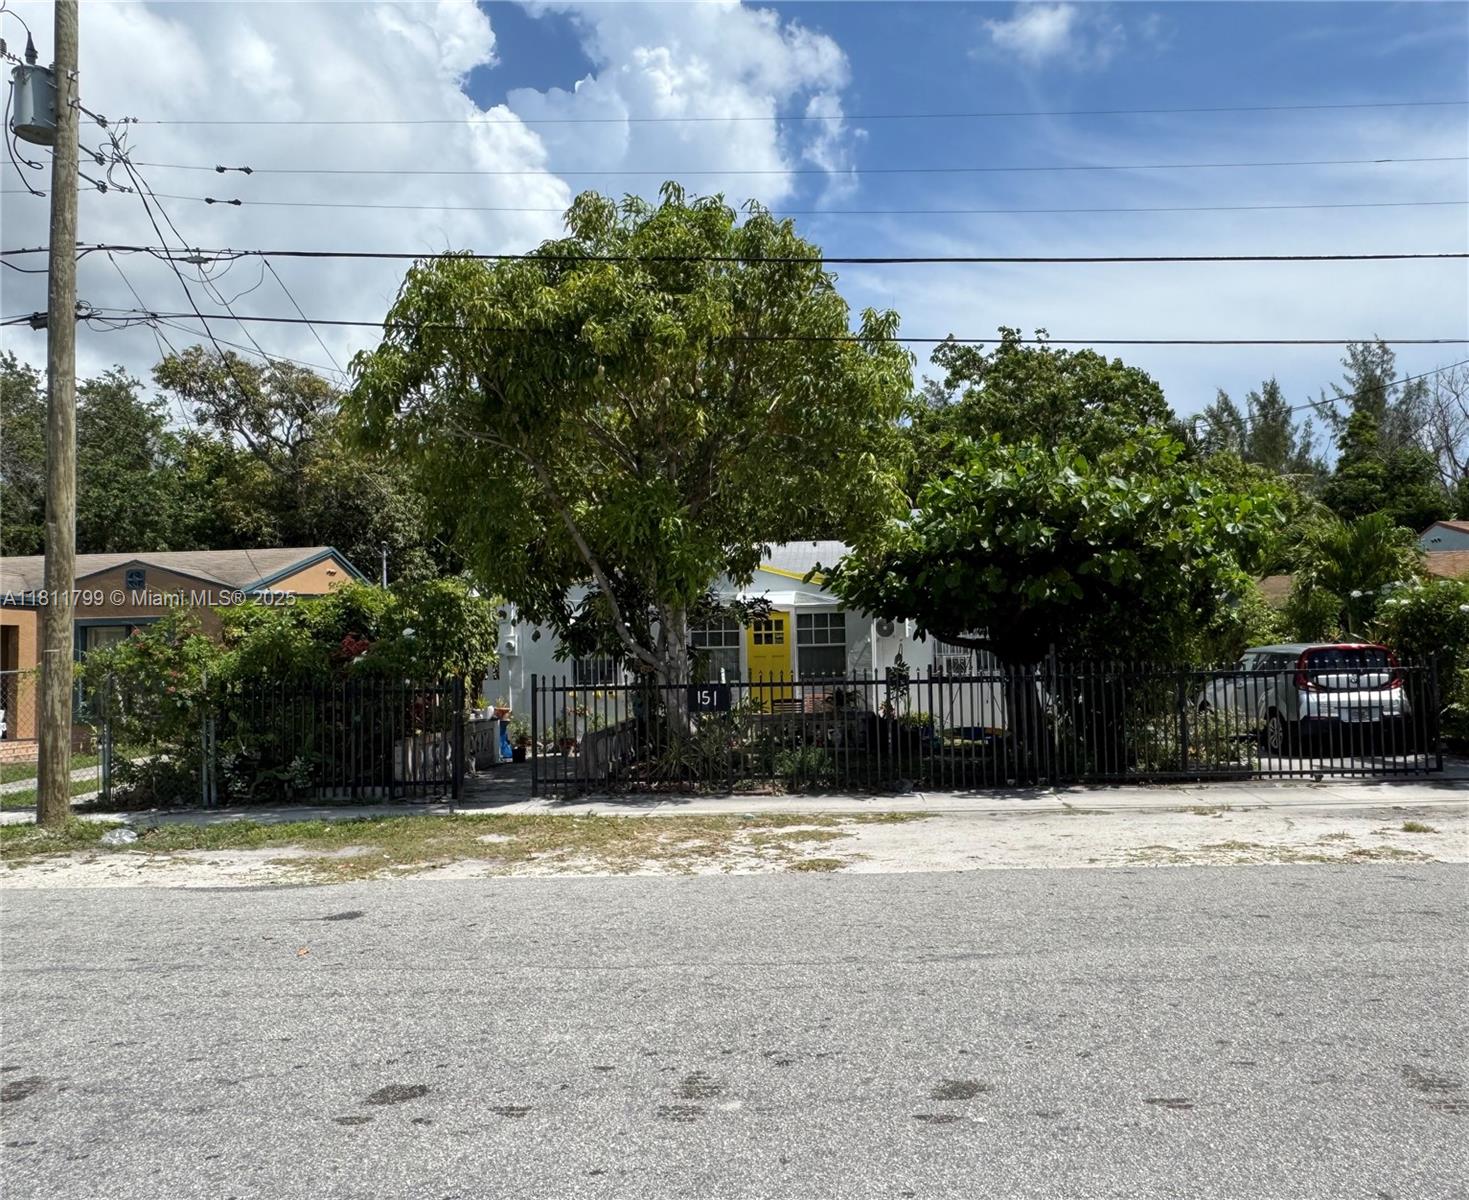
$499,900
3
bds
|
2
ba
|
1,228
sqft
|
built
1940
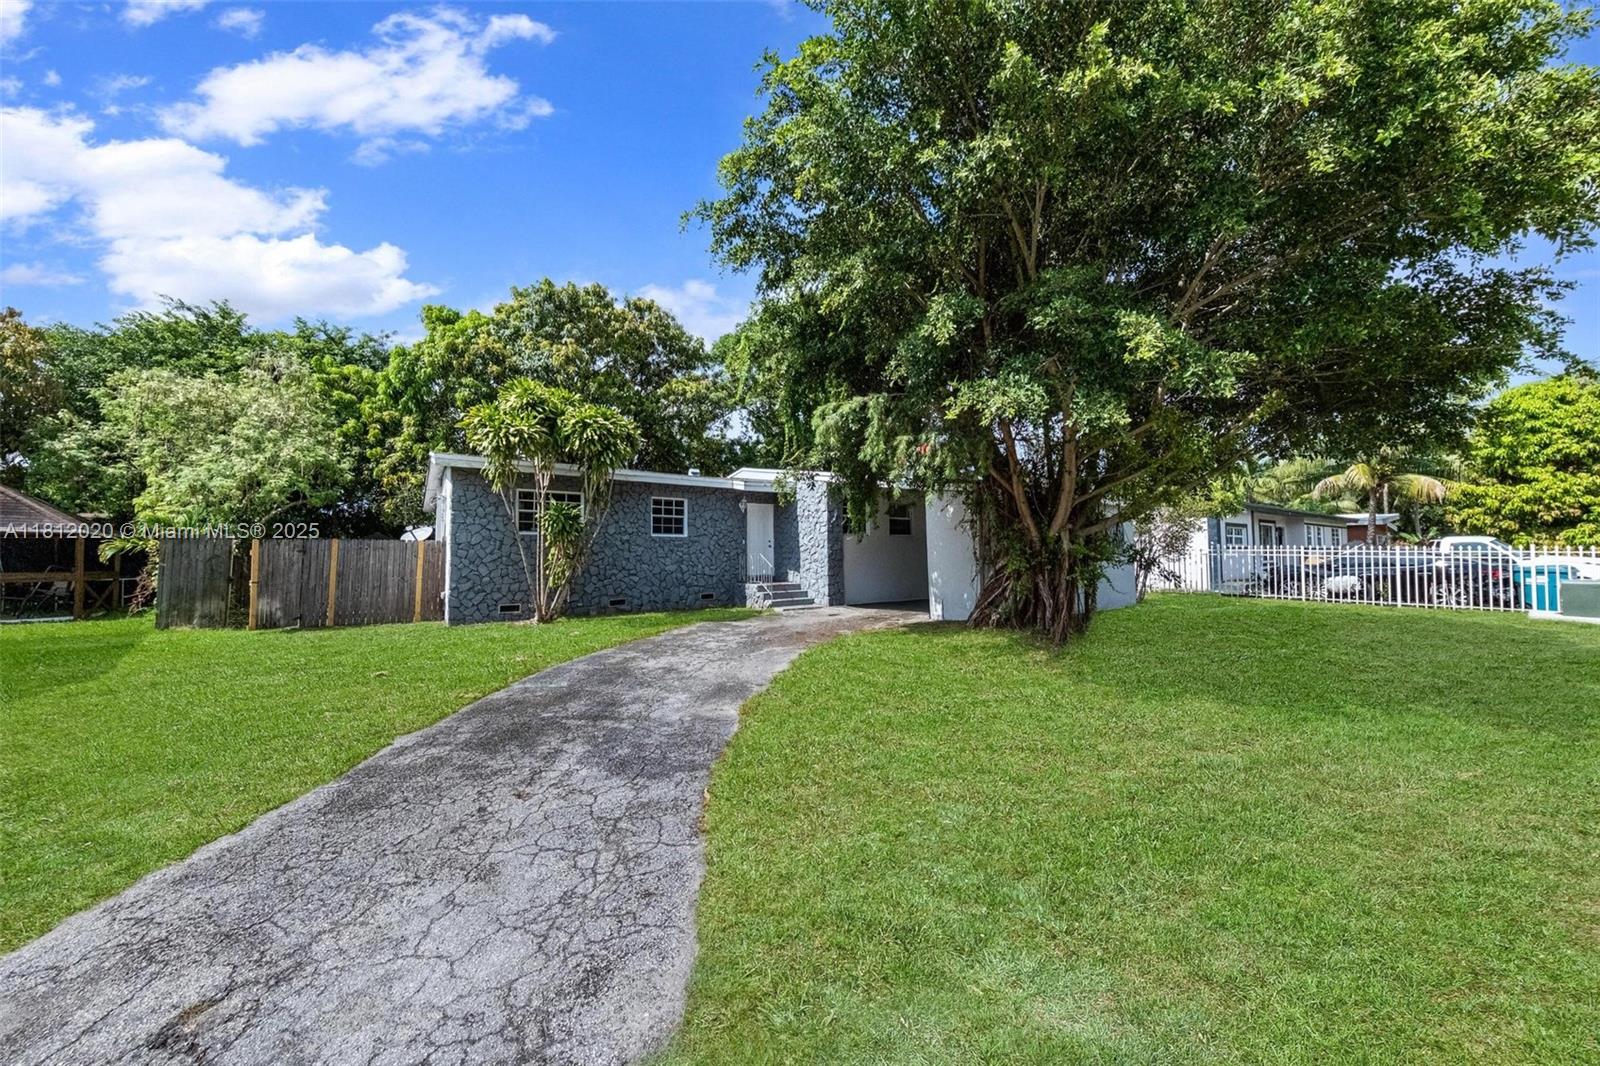
151 NW 64th St, Miami, FL 33150
$-957
Cash flow
-10.0%
Cash-on-Cash Return
4.0%
Cap rate
0.6%
Rent to Value Ratio
Active
$2,650,000
5
bds
|
4
ba
|
0
sqft
|
built
1965
9700 SW 136th St, Miami, FL 33176
$-9,460
Cash flow
-18.6%
Cash-on-Cash Return
2.0%
Cap rate
0.3%
Rent to Value Ratio
Active
$525,000
2
bds
|
2
ba
|
1,048
sqft
|
built
2008
1750 N Bayshore Dr, Miami, FL 33132
$-2,952
Cash flow
-29.3%
Cash-on-Cash Return
-0.5%
Cap rate
0.7%
Rent to Value Ratio

Active
$1,149,999
4
bds
|
2
ba
|
2,198
sqft
|
built
1995
13381 SW 151st Ter, Miami, FL 33186
$-3,996
Cash flow
-18.1%
Cash-on-Cash Return
2.1%
Cap rate
0.3%
Rent to Value Ratio
Active
$784,000
2
bds
|
2
ba
|
1,080
sqft
|
built
1938
703 NE 88th St, Miami, FL 33138
$-1,222
Cash flow
-8.1%
Cash-on-Cash Return
4.4%
Cap rate
0.6%
Rent to Value Ratio
Active
$2,750,000
5
bds
|
3
ba
|
3,425
sqft
|
built
1987
10600 SW 140th St, Miami, FL 33176
$-8,998
Cash flow
-17.1%
Cash-on-Cash Return
2.4%
Cap rate
0.3%
Rent to Value Ratio
Active
$795,000
4
bds
|
3
ba
|
2,358
sqft
|
built
1996
11715 SW 142nd Pl, Miami, FL 33186
$-1,805
Cash flow
-11.8%
Cash-on-Cash Return
3.6%
Cap rate
0.5%
Rent to Value Ratio
Active
$319,900
bds
|
1
ba
|
594
sqft
|
built
2007
1900 N Bayshore Dr, Miami, FL 33132
$-1,142
Cash flow
-18.6%
Cash-on-Cash Return
2.0%
Cap rate
0.7%
Rent to Value Ratio
Active
$399,000
2
bds
|
3
ba
|
1,330
sqft
|
built
1978
6934 SW 114th Pl, Miami, FL 33173
$-1,246
Cash flow
-16.3%
Cash-on-Cash Return
2.5%
Cap rate
0.7%
Rent to Value Ratio
Active
$1,550,000
4
bds
|
5
ba
|
2,594
sqft
|
built
2022
2320 SW 14th St, Miami, FL 33145
$-4,612
Cash flow
-15.5%
Cash-on-Cash Return
2.7%
Cap rate
0.5%
Rent to Value Ratio
Active
$643,000
3
bds
|
2
ba
|
1,354
sqft
|
built
1956
725 NE 178th St, Miami, FL 33162
$-1,538
Cash flow
-12.5%
Cash-on-Cash Return
3.4%
Cap rate
0.6%
Rent to Value Ratio
Active
$659,900
2
bds
|
2
ba
|
1,203
sqft
|
built
2008
253 NE 2nd St, Miami, FL 33132
$-3,865
Cash flow
-30.6%
Cash-on-Cash Return
-0.7%
Cap rate
0.6%
Rent to Value Ratio
Active
$510,000
1
bds
|
1
ba
|
843
sqft
|
built
2008
1050 Brickell Ave, Miami, FL 33131
$-1,911
Cash flow
-19.5%
Cash-on-Cash Return
1.8%
Cap rate
0.7%
Rent to Value Ratio
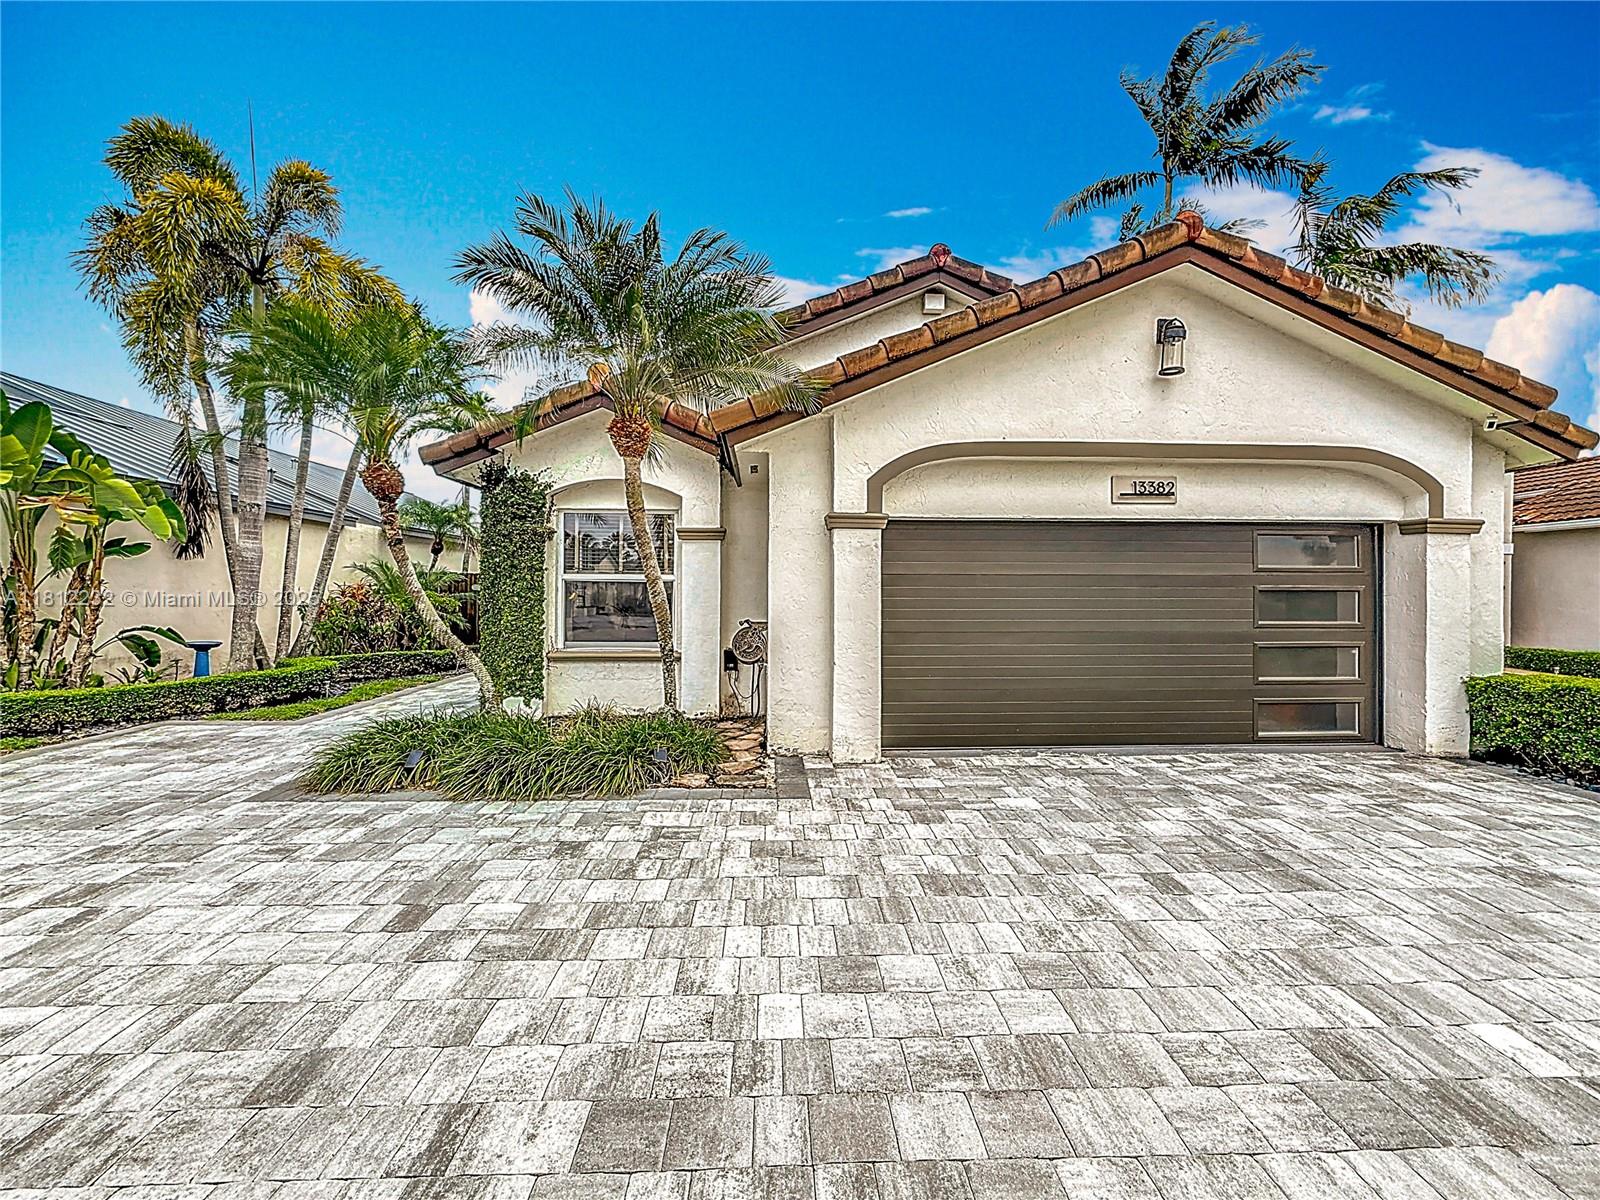
Active
$774,500
3
bds
|
2
ba
|
1,725
sqft
|
built
1991
13382 NW 8th St, Miami, FL 33182
$-1,665
Cash flow
-11.2%
Cash-on-Cash Return
3.7%
Cap rate
0.5%
Rent to Value Ratio
Active
$3,950,000
4
bds
|
5
ba
|
2,421
sqft
|
built
1940
621 NE 55th St, Miami, FL 33137
$-20,277
Cash flow
-26.8%
Cash-on-Cash Return
0.1%
Cap rate
0.2%
Rent to Value Ratio
Active
$490,000
3
bds
|
3
ba
|
1,246
sqft
|
built
1964
1858 NW 47th Ter, Miami, FL 33142
$-920
Cash flow
-9.8%
Cash-on-Cash Return
4.0%
Cap rate
0.7%
Rent to Value Ratio
Active
$599,000
3
bds
|
1
ba
|
828
sqft
|
built
1955
11412 SW 42nd St, Miami, FL 33165
$-1,617
Cash flow
-14.1%
Cash-on-Cash Return
3.0%
Cap rate
0.5%
Rent to Value Ratio
Active
$620,000
3
bds
|
2
ba
|
1,502
sqft
|
built
2005
10814 SW 228th Ter, Miami, FL 33170
$-1,830
Cash flow
-15.4%
Cash-on-Cash Return
2.7%
Cap rate
0.5%
Rent to Value Ratio
Active
$355,000
1
bds
|
2
ba
|
1,125
sqft
|
built
1972
9351 Fontainebleau Blvd, Miami, FL 33172
$-814
Cash flow
-12.0%
Cash-on-Cash Return
3.5%
Cap rate
0.6%
Rent to Value Ratio
Active
$190,000
1
bds
|
2
ba
|
861
sqft
|
built
1968
1301 NE Miami Gardens Dr, Miami, FL 33179
$-404
Cash flow
-11.1%
Cash-on-Cash Return
3.7%
Cap rate
0.9%
Rent to Value Ratio

Active
$499,000
2
bds
|
2
ba
|
0
sqft
|
built
1954
5890 NW 18th Ave, Miami, FL 33142
$-776
Cash flow
-8.1%
Cash-on-Cash Return
4.4%
Cap rate
0.6%
Rent to Value Ratio

Active
$229,000
2
bds
|
1
ba
|
930
sqft
|
built
1968
9972 N Kendall Dr, Miami, FL 33176
$-424
Cash flow
-9.7%
Cash-on-Cash Return
4.1%
Cap rate
1.0%
Rent to Value Ratio
Active
$799,500
2
bds
|
2
ba
|
1,155
sqft
|
built
2016
1300 S Miami Ave, Miami, FL 33130
$-2,533
Cash flow
-16.5%
Cash-on-Cash Return
2.5%
Cap rate
0.8%
Rent to Value Ratio
Active
$619,000
2
bds
|
2
ba
|
1,048
sqft
|
built
2008
1750 N Bayshore Dr, Miami, FL 33132
$-3,374
Cash flow
-28.4%
Cash-on-Cash Return
-0.3%
Cap rate
0.6%
Rent to Value Ratio
Active
$750,000
4
bds
|
2
ba
|
1,790
sqft
|
built
1962
9821 SW 157th Ter, Miami, FL 33157
$-1,656
Cash flow
-11.5%
Cash-on-Cash Return
3.6%
Cap rate
0.5%
Rent to Value Ratio
Active
$920,000
2
bds
|
0
ba
|
1,840
sqft
|
built
1970
5091 NW 2nd Ave, Miami, FL 33127
$-4,379
Cash flow
-24.8%
Cash-on-Cash Return
0.6%
Cap rate
0.4%
Rent to Value Ratio

Active
$675,000
1
bds
|
2
ba
|
706
sqft
|
built
2018
650 NE 32nd St, Miami, FL 33137
$-2,213
Cash flow
-17.1%
Cash-on-Cash Return
2.4%
Cap rate
0.7%
Rent to Value Ratio
Active
$899,999
4
bds
|
3
ba
|
1,991
sqft
|
built
1955
6242 SW 28th St, Miami, FL 33155
$-2,643
Cash flow
-15.3%
Cash-on-Cash Return
2.8%
Cap rate
0.5%
Rent to Value Ratio
Active
$770,000
3
bds
|
2
ba
|
1,309
sqft
|
built
1965
12531 SW 37th Ter, Miami, FL 33175
$-2,333
Cash flow
-15.8%
Cash-on-Cash Return
2.6%
Cap rate
0.5%
Rent to Value Ratio
Active
$1,850,000
4
bds
|
4
ba
|
4,083
sqft
|
built
2017
20120 SW 133rd Ave, Miami, FL 33177
$-5,022
Cash flow
-14.2%
Cash-on-Cash Return
3.0%
Cap rate
0.5%
Rent to Value Ratio
Active
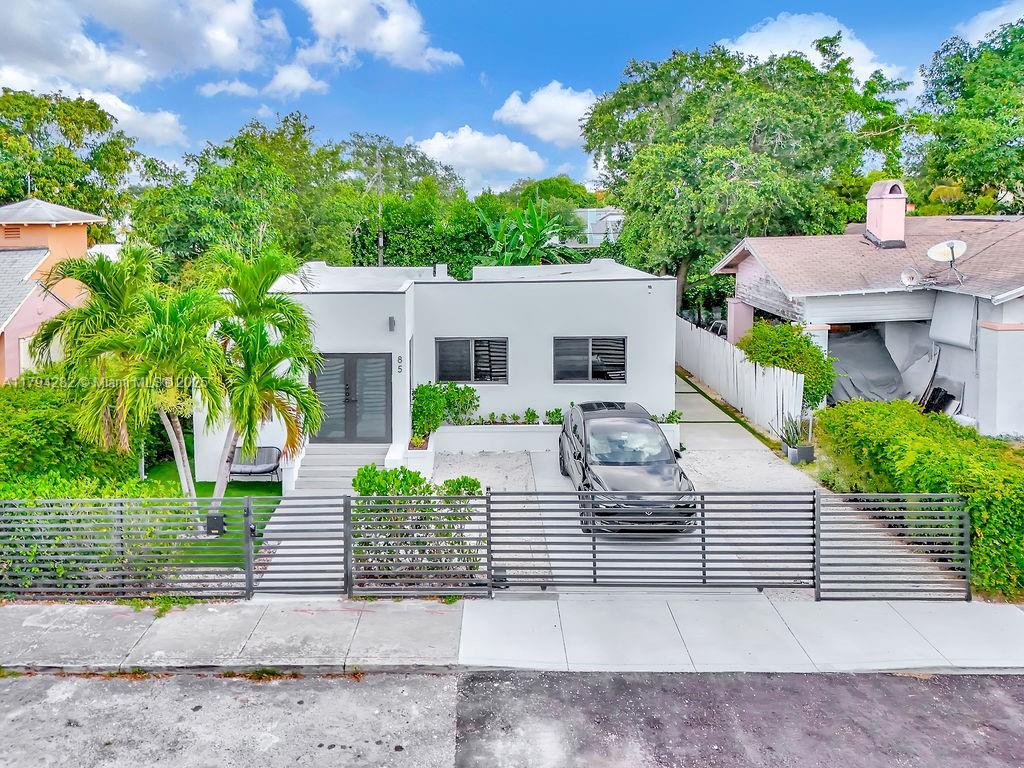
$999,000
4
bds
|
3
ba
|
1,144
sqft
|
built
2018
85 NW 47th St, Miami, FL 33127
$-1,585
Cash flow
-8.3%
Cash-on-Cash Return
4.4%
Cap rate
0.6%
Rent to Value Ratio
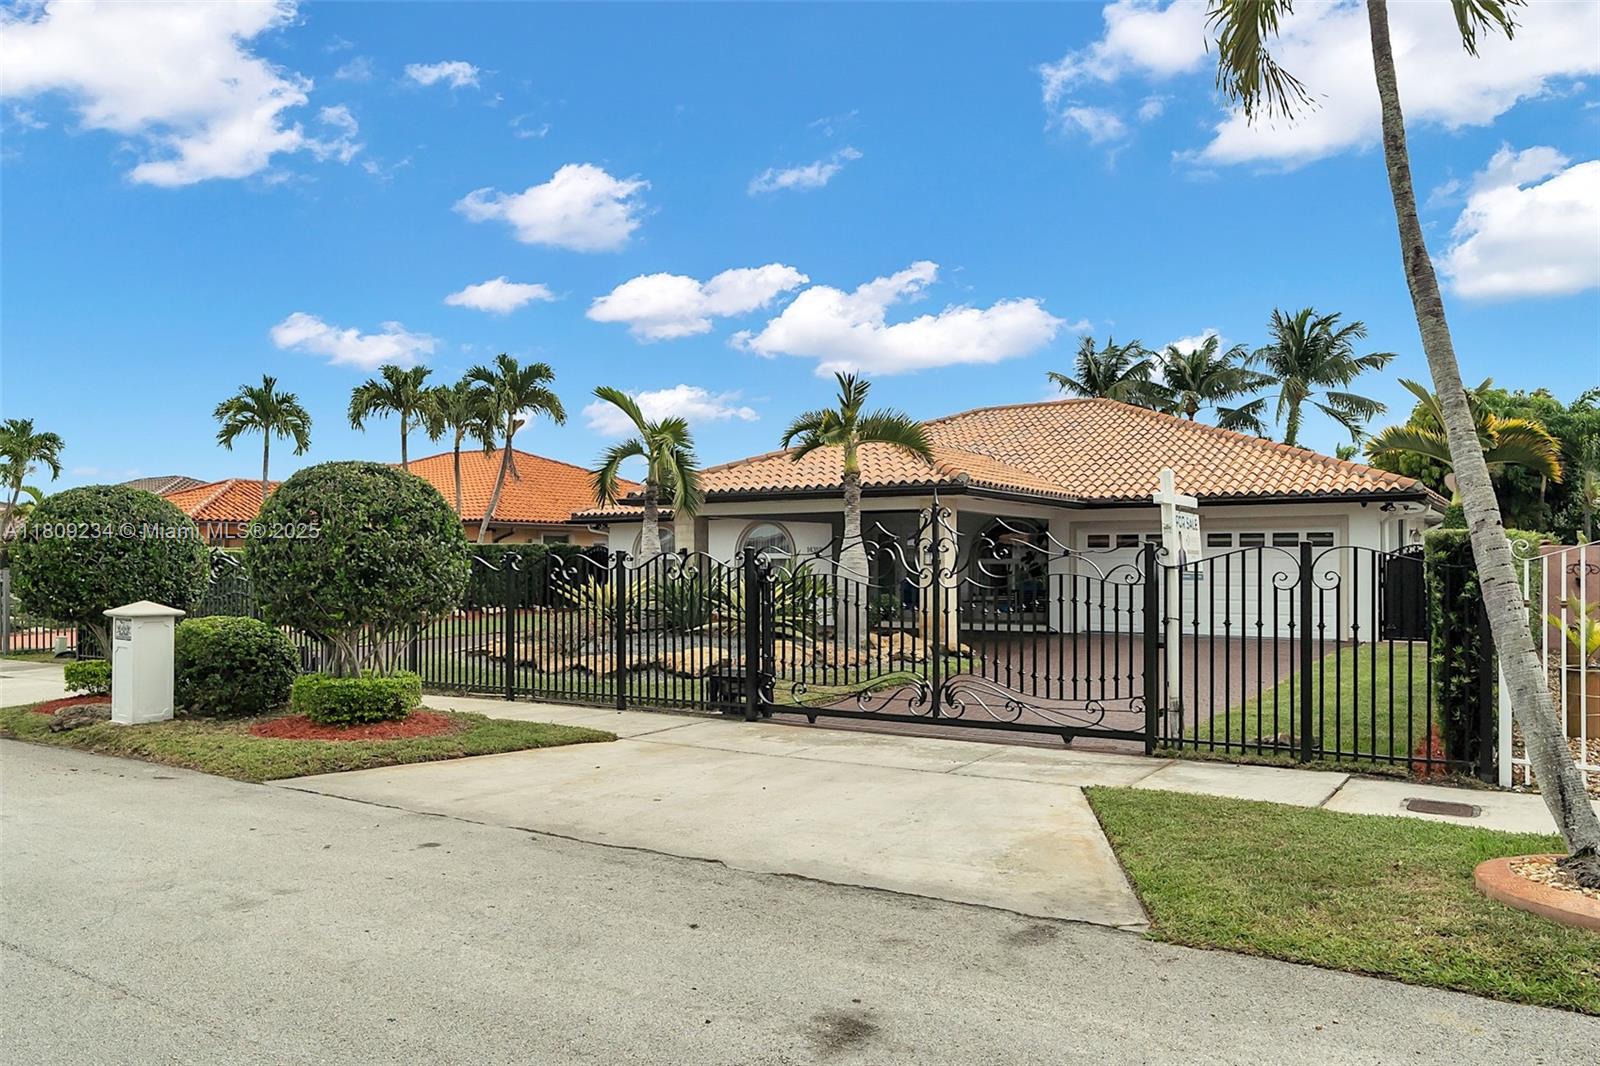
Active under contract
$1,299,000
4
bds
|
3
ba
|
2,348
sqft
|
built
1992
14318 SW 17th St, Miami, FL 33175
$-3,968
Cash flow
-15.9%
Cash-on-Cash Return
2.6%
Cap rate
0.4%
Rent to Value Ratio
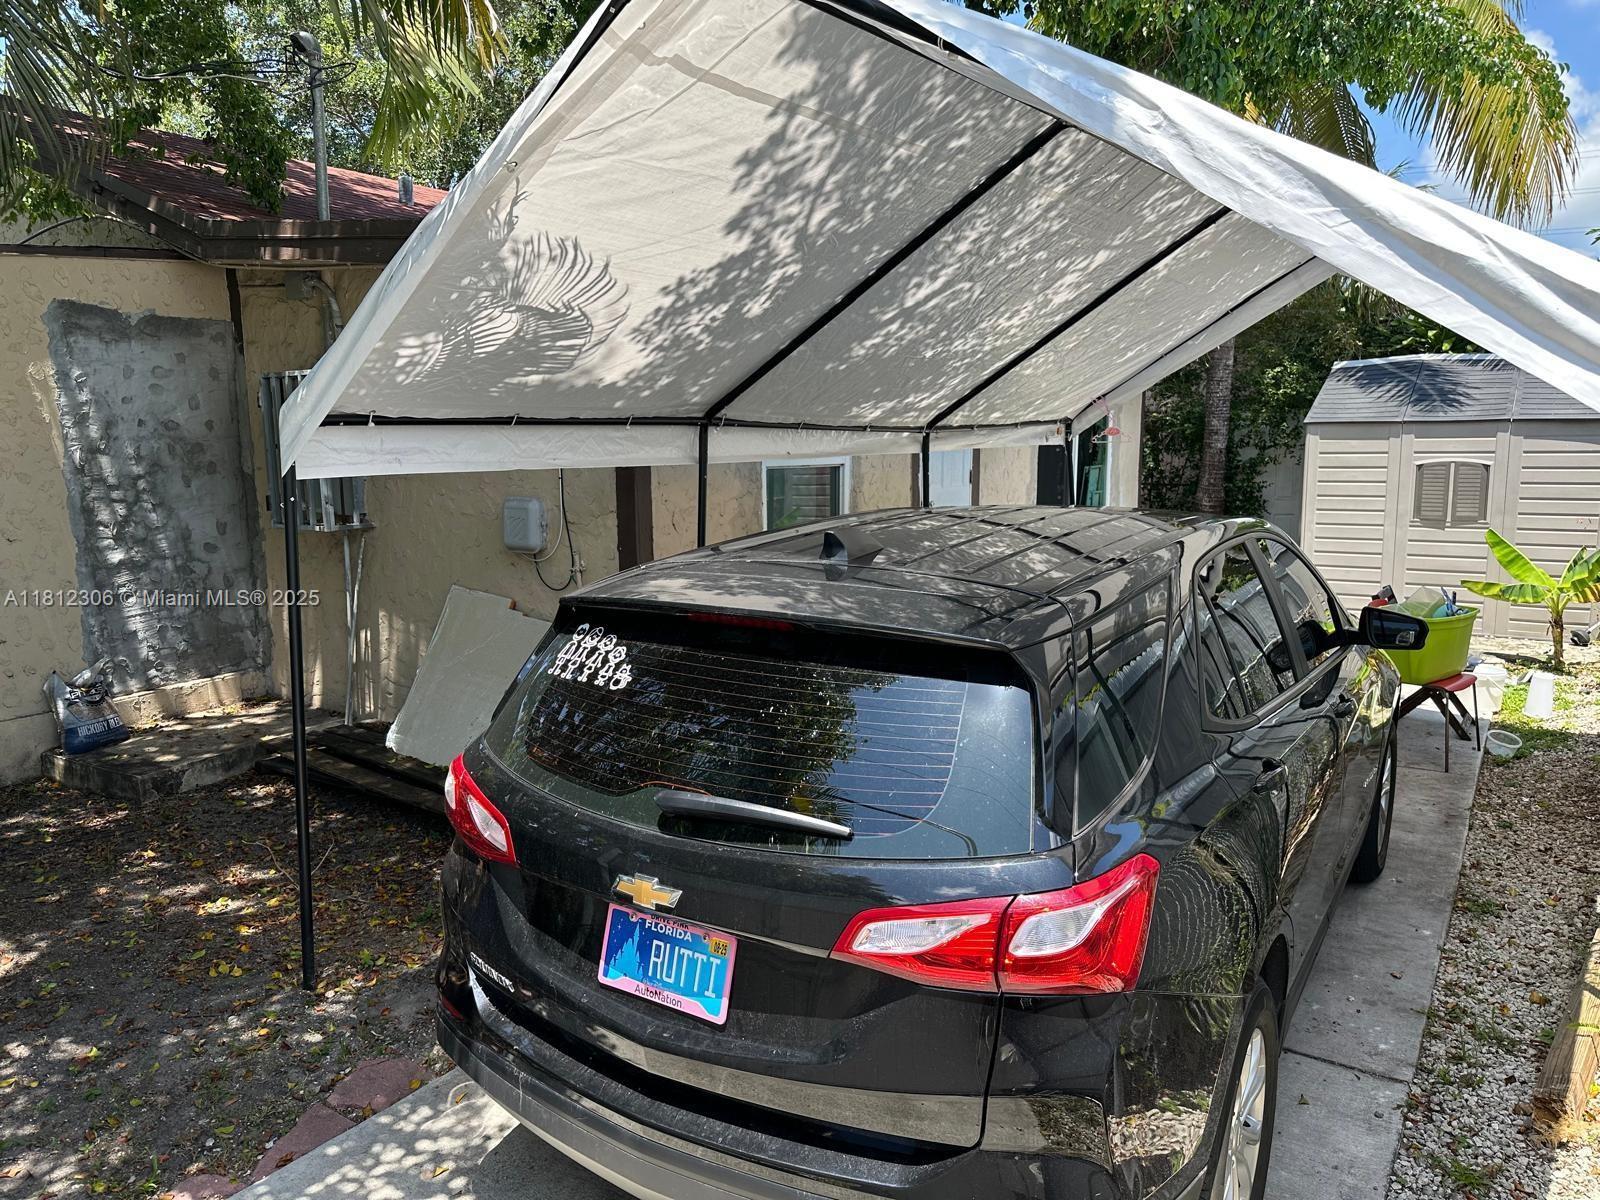
Active
$450,000
3
bds
|
1
ba
|
792
sqft
|
built
1937
544 NW 96th St, Miami, FL 33150
$-576
Cash flow
-6.7%
Cash-on-Cash Return
4.7%
Cap rate
0.7%
Rent to Value Ratio

Active
$400,000
1
bds
|
2
ba
|
978
sqft
|
built
2008
244 Biscayne Blvd, Miami, FL 33132
$-1,936
Cash flow
-25.3%
Cash-on-Cash Return
0.5%
Cap rate
0.7%
Rent to Value Ratio
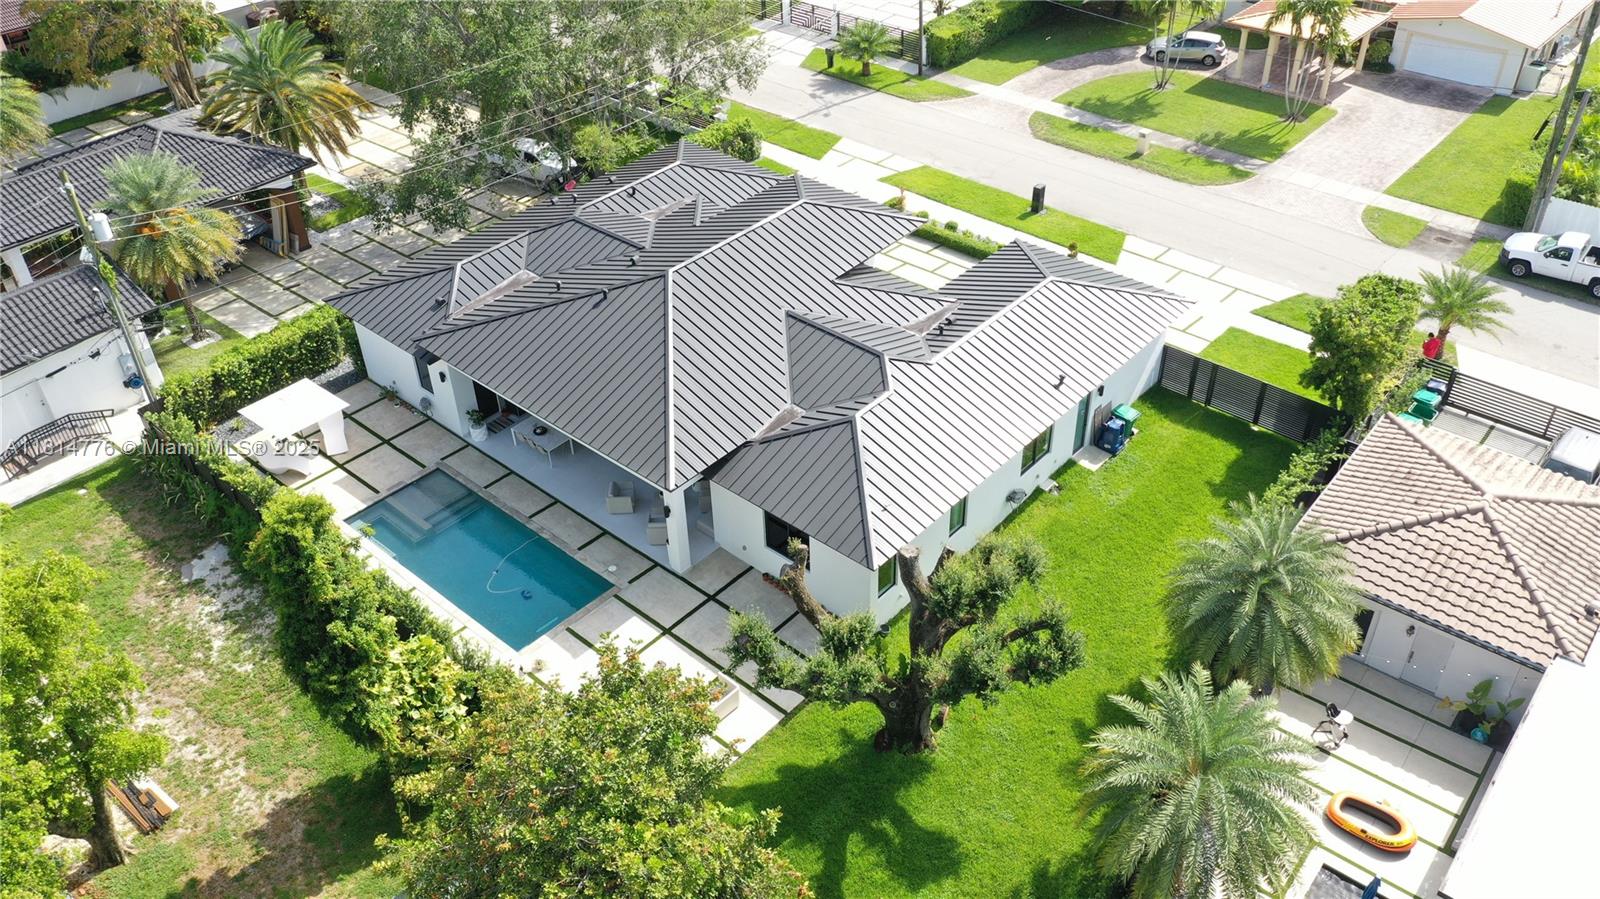
Active
$2,380,000
4
bds
|
3
ba
|
2,915
sqft
|
built
2022
3237 SW 99th Ave, Miami, FL 33165
$-9,573
Cash flow
-21.0%
Cash-on-Cash Return
1.5%
Cap rate
0.3%
Rent to Value Ratio
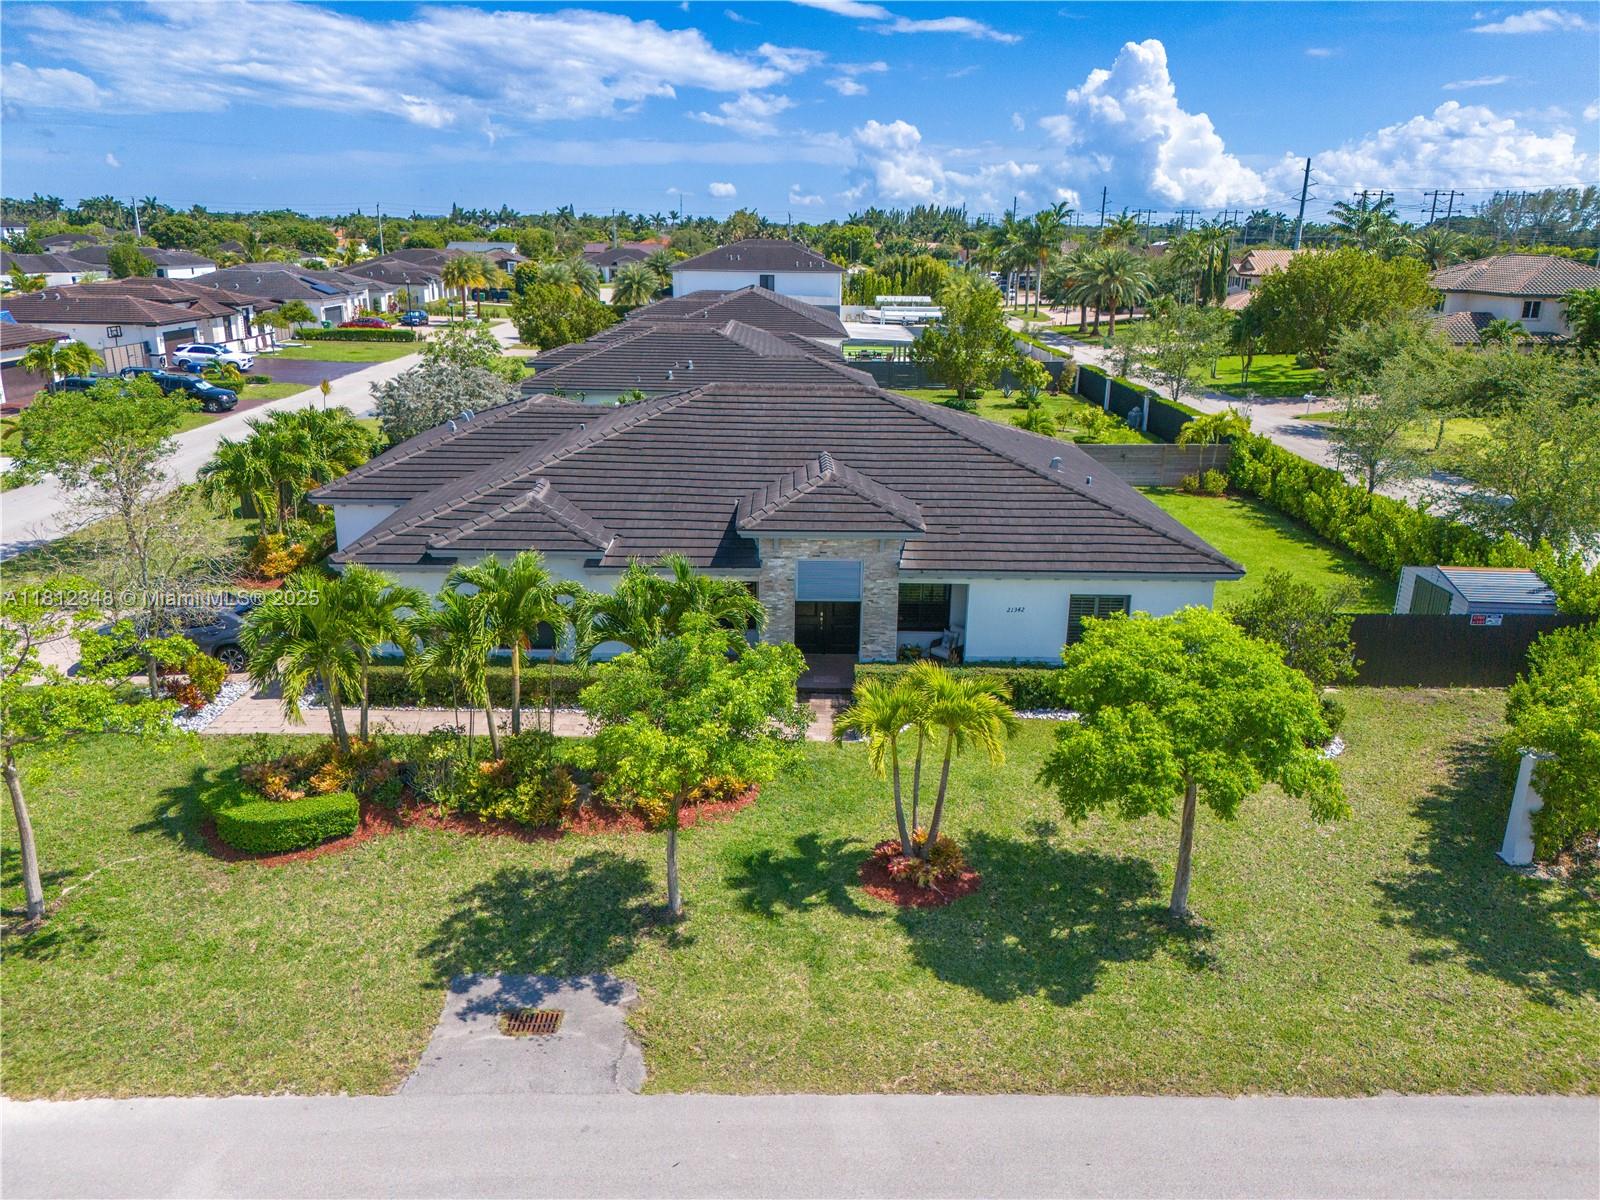
Active
$949,000
4
bds
|
4
ba
|
2,804
sqft
|
built
2018
21342 SW 132nd Pl, Miami, FL 33177
$-1,612
Cash flow
-8.9%
Cash-on-Cash Return
4.2%
Cap rate
0.5%
Rent to Value Ratio
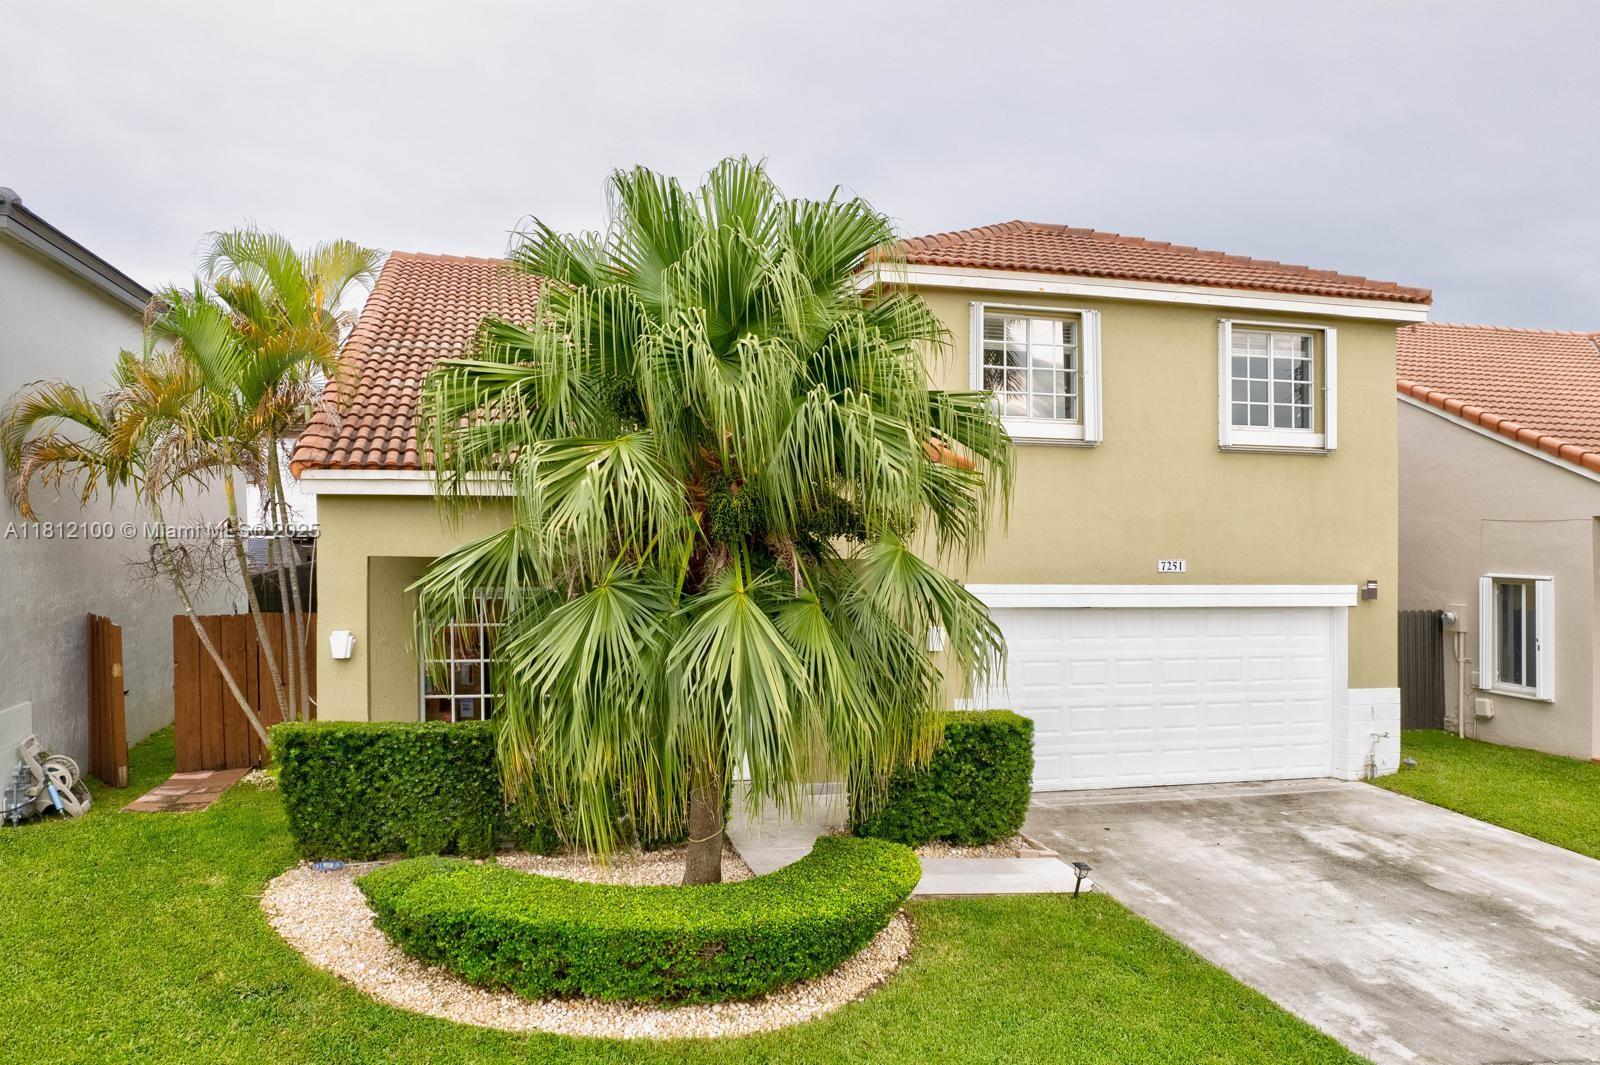
Active
$679,000
4
bds
|
3
ba
|
2,135
sqft
|
built
1995
7251 SW 158th Pl, Miami, FL 33193
$-1,646
Cash flow
-12.6%
Cash-on-Cash Return
3.4%
Cap rate
0.6%
Rent to Value Ratio
Active
$365,000
2
bds
|
1
ba
|
650
sqft
|
built
1945
6545 NW 6th Ave, Miami, FL 33150
$-403
Cash flow
-5.8%
Cash-on-Cash Return
5.0%
Cap rate
0.6%
Rent to Value Ratio