Miami, FL Investment Properties for Sale
Browse homes for sale and investment properties in Miami, FL. Refine your search by price, property type, or more.
Best cash flowing properties in Miami, FL
Active
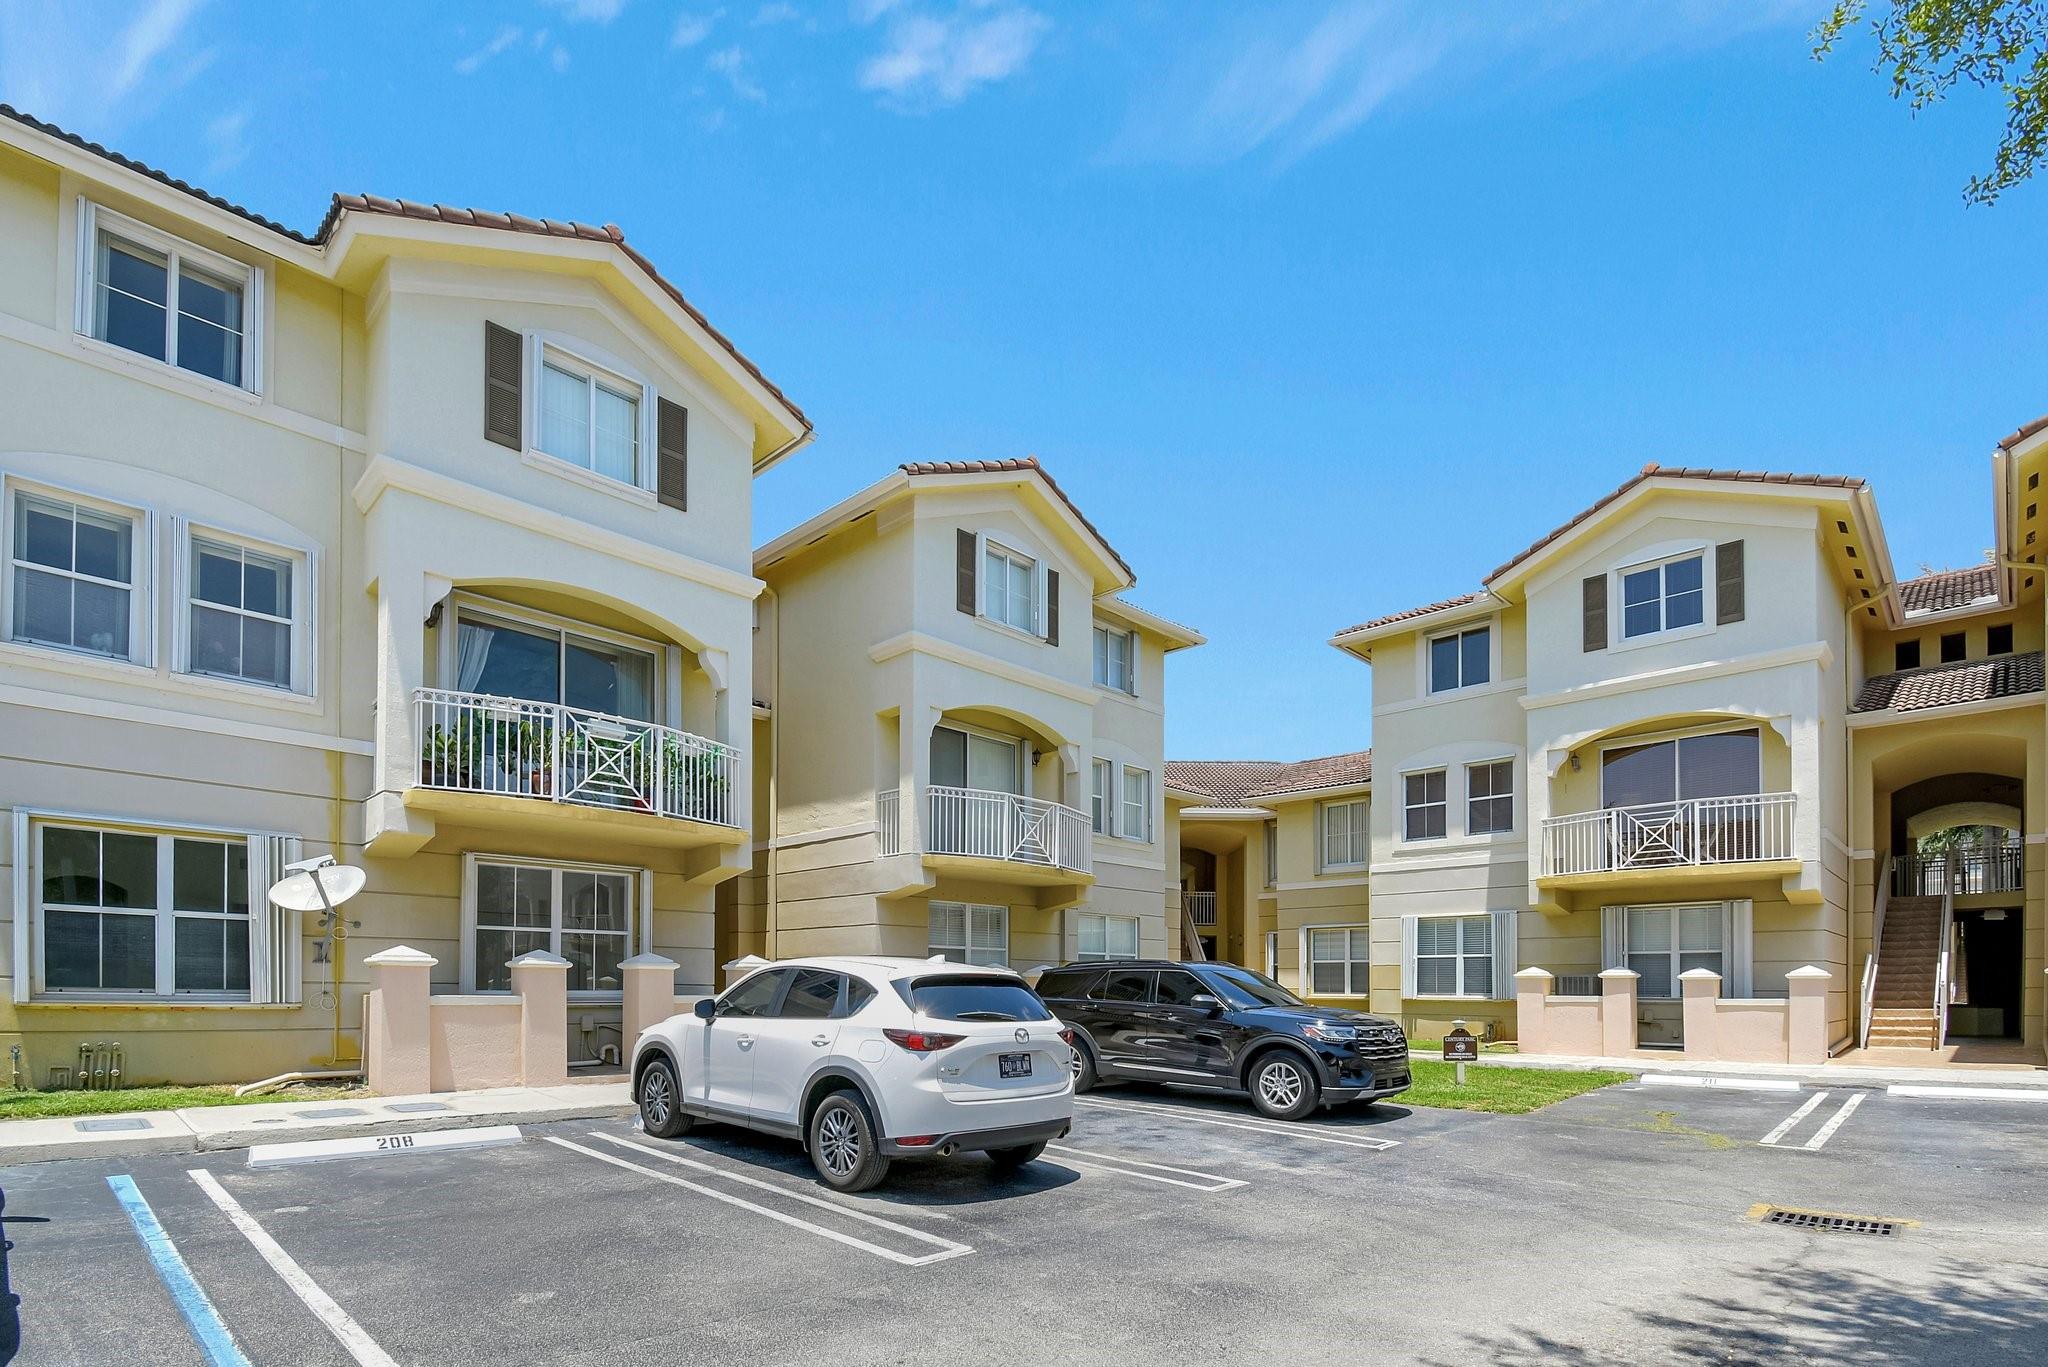
$165,000
1
bds
|
1
ba
|
801
sqft
|
built
1969
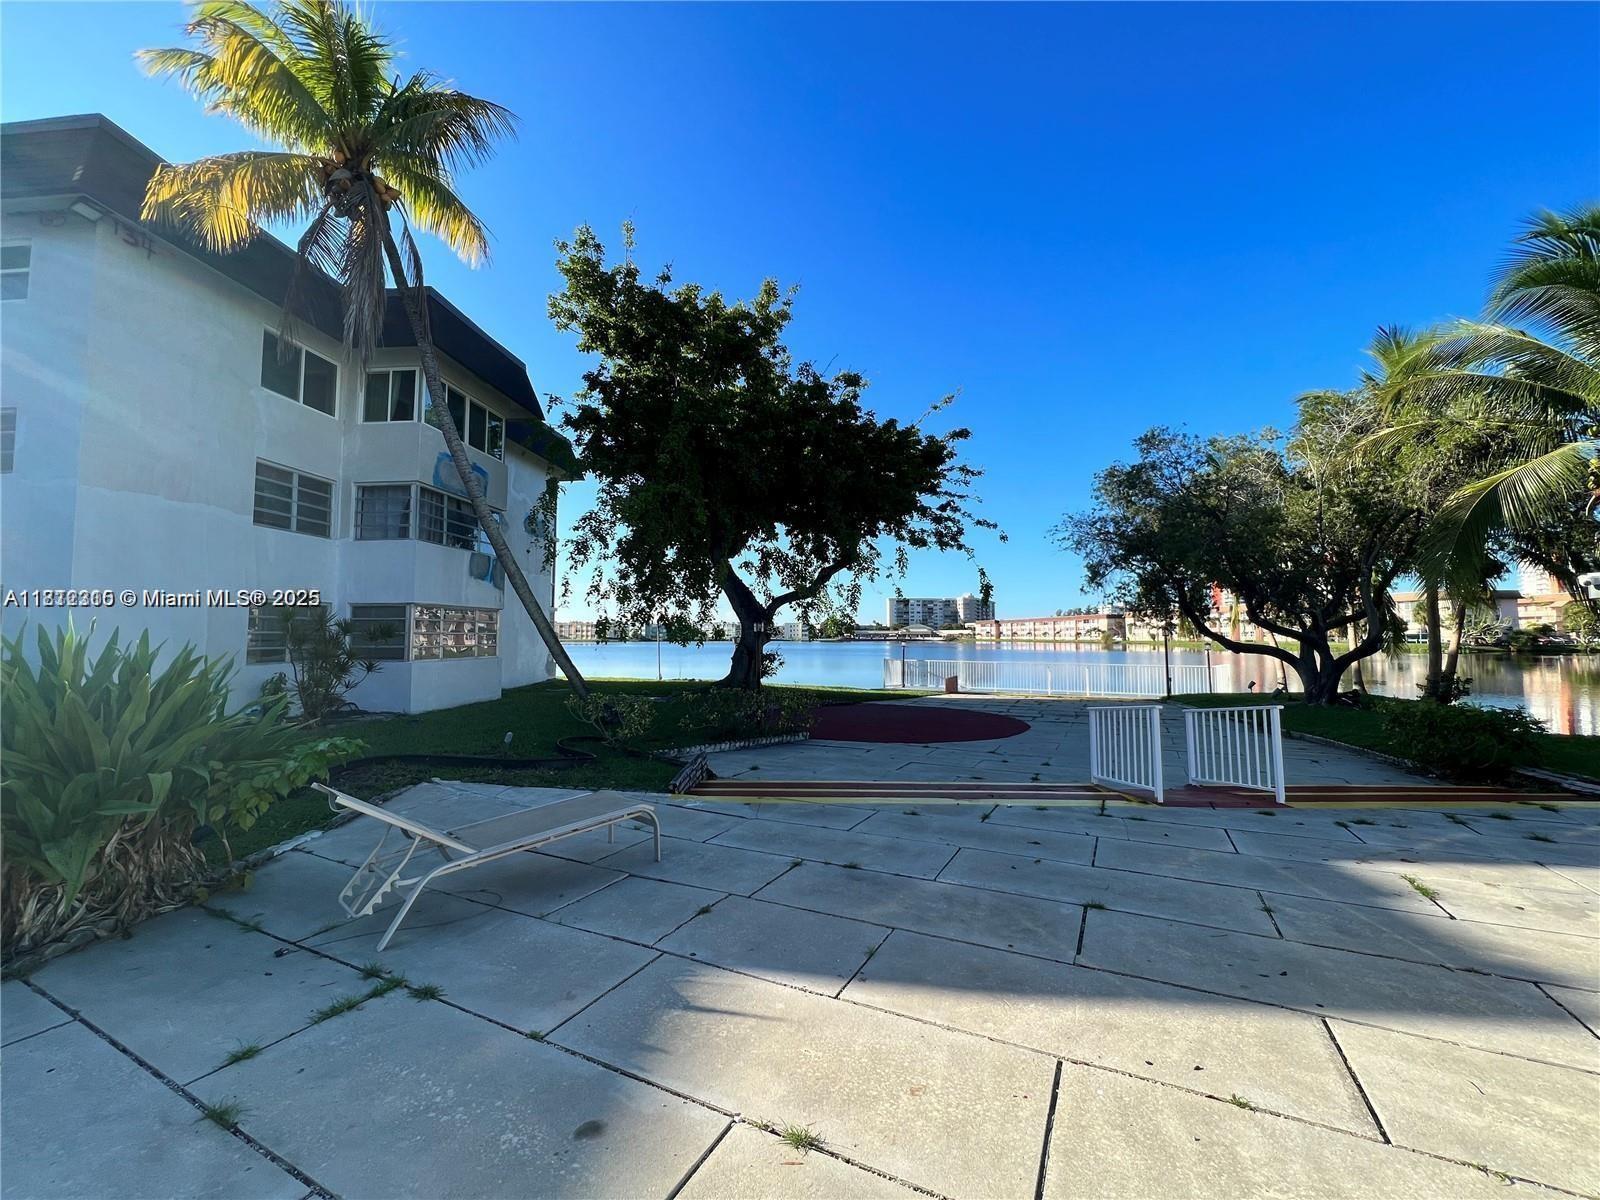
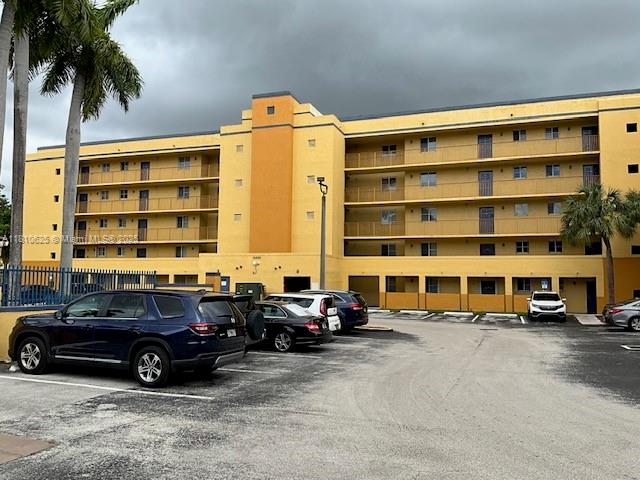
1351 NE Miami Gardens Dr, Miami, FL 33179
$97
Cash flow
3.1%
Cash-on-Cash Return
7.0%
Cap rate
1.3%
Rent to Value Ratio
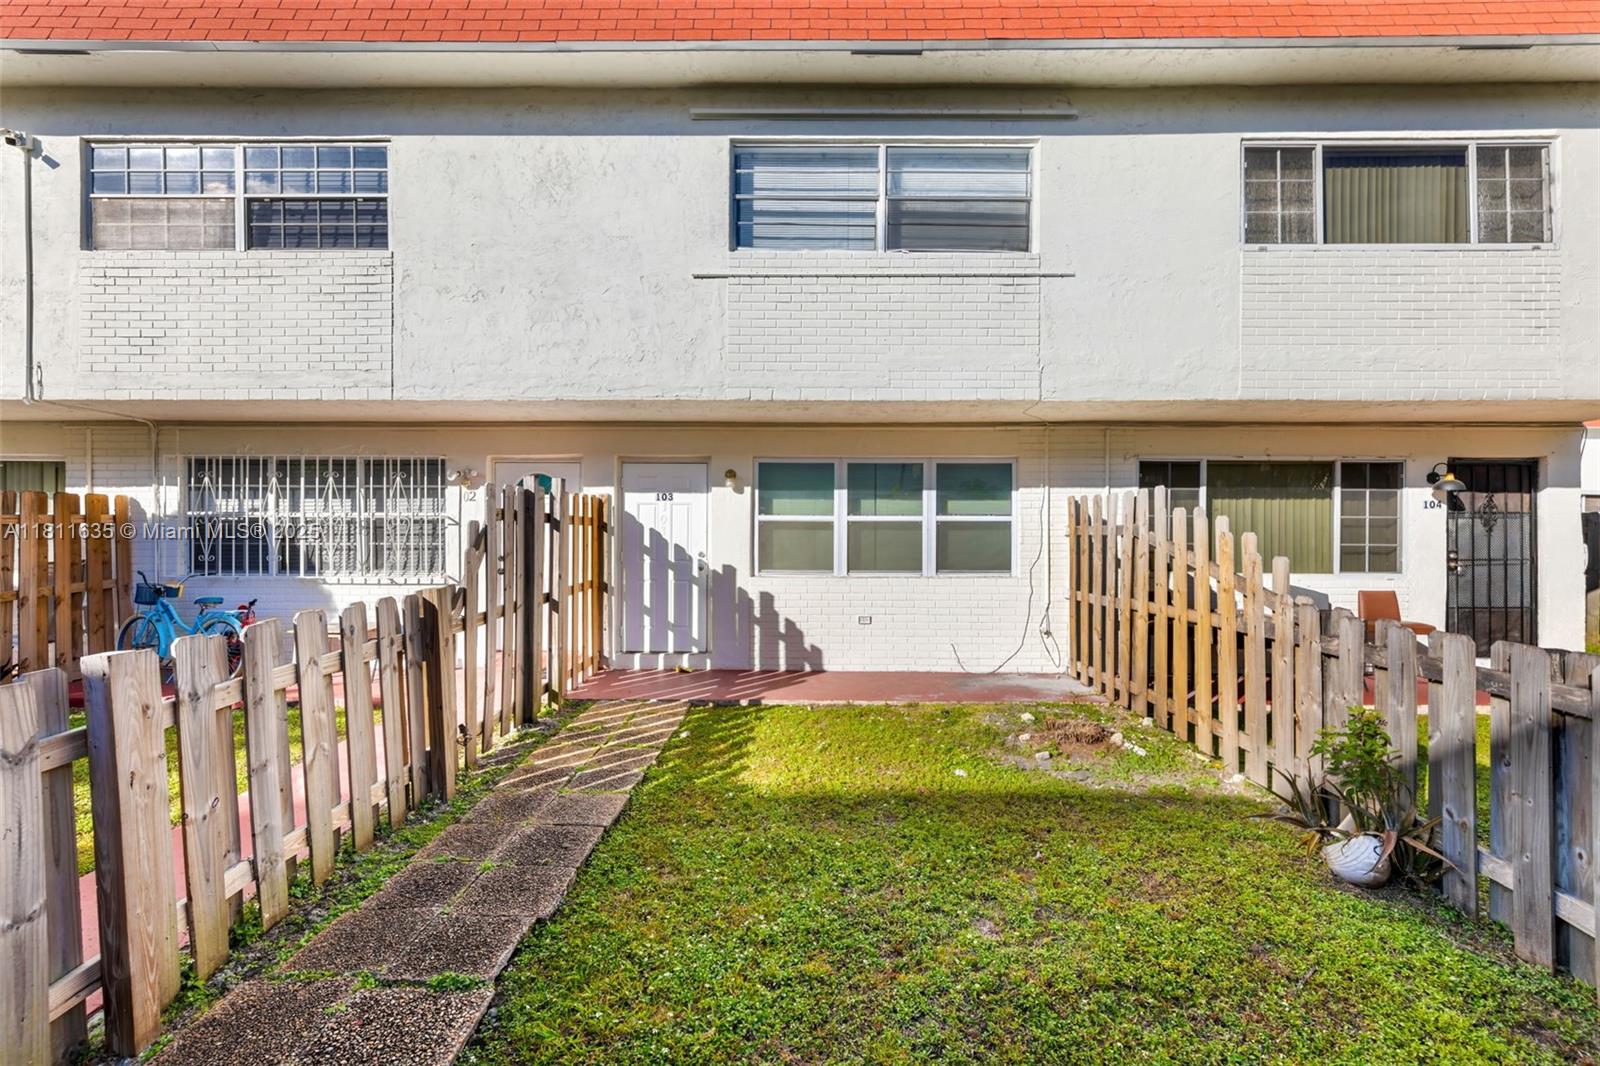
Active
$190,000
2
bds
|
2
ba
|
1,075
sqft
|
built
1972
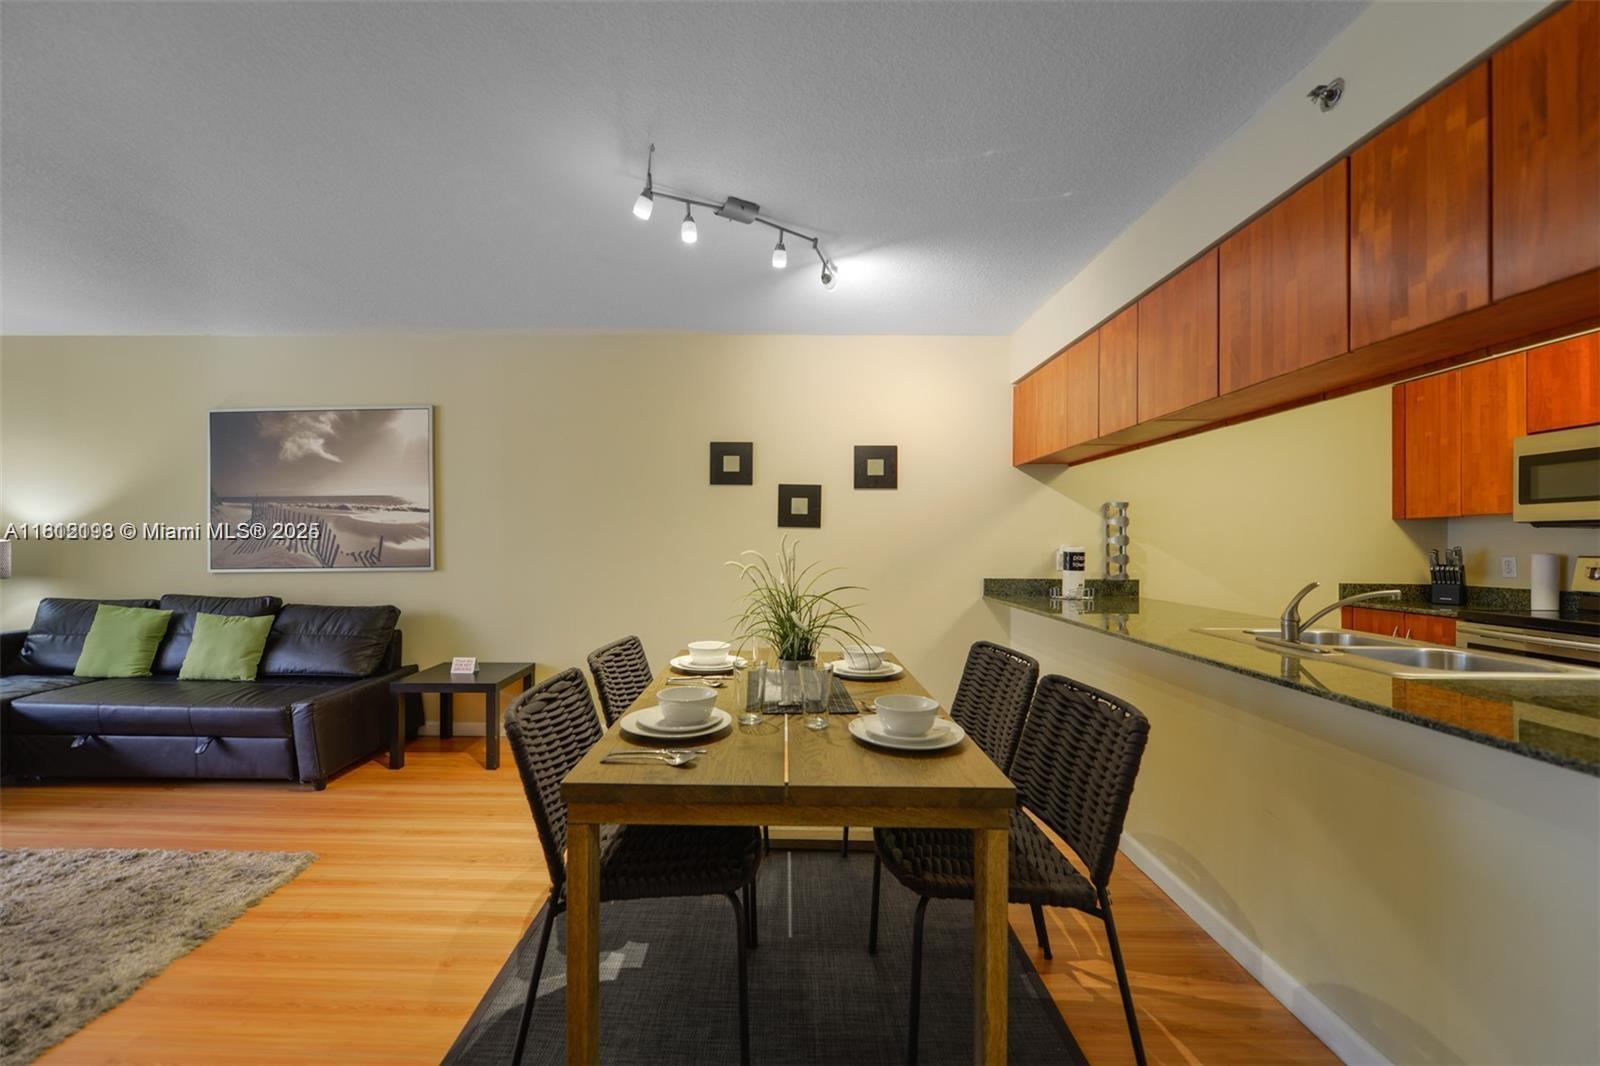
1461 NE 150th St, Miami, FL 33161
$-169
Cash flow
-4.6%
Cash-on-Cash Return
5.2%
Cap rate
1.1%
Rent to Value Ratio
6,172 out of 7,007 properties for sale in Miami, FL
Limited Results Shown
Create a free account, or log in to reveal all property listings and enjoy the complete experience.
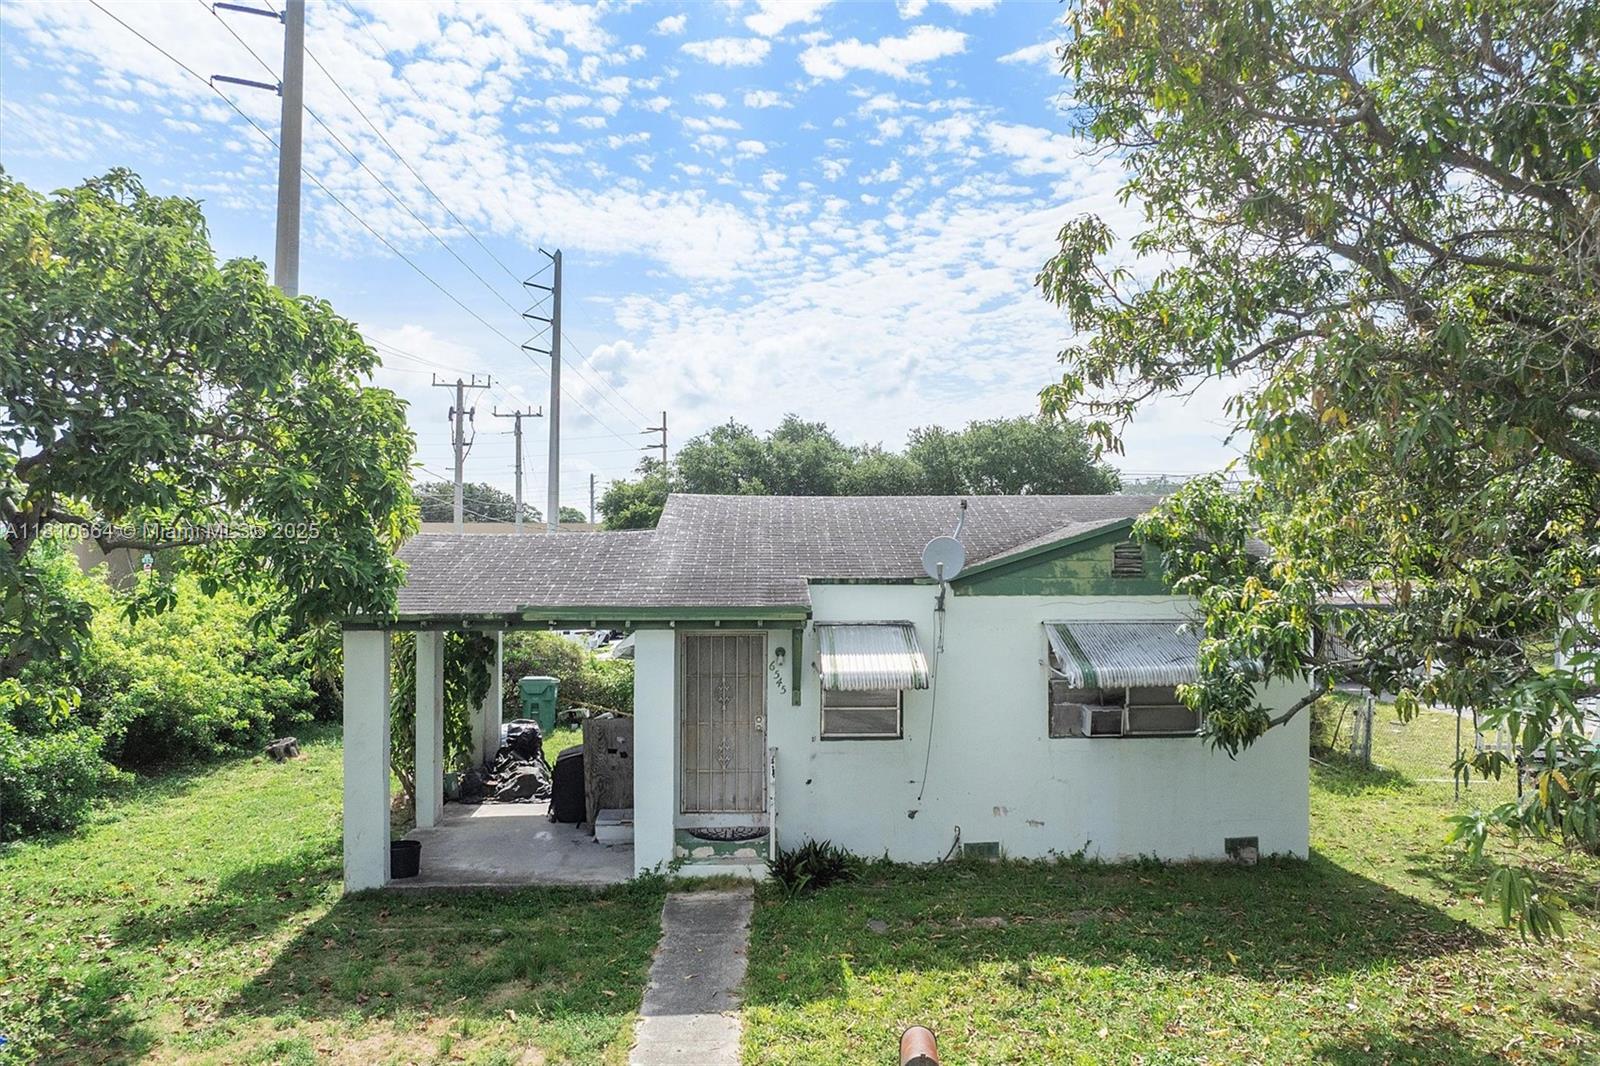
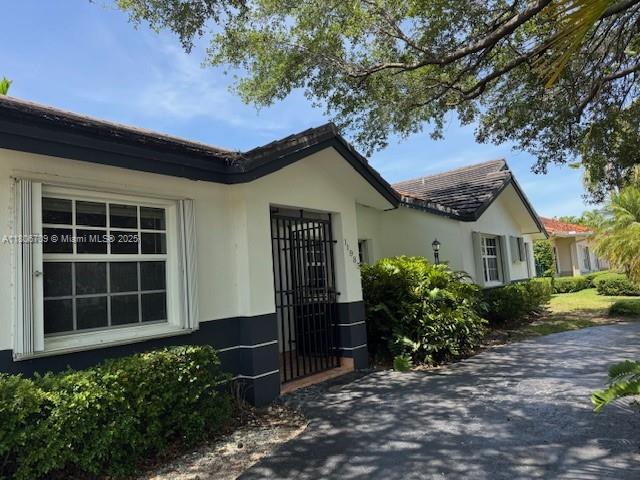
Active
$365,000
2
bds
|
1
ba
|
650
sqft
|
built
1945
6545 NW 6th Ave, Miami, FL 33150
$-403
Cash flow
-5.8%
Cash-on-Cash Return
5.0%
Cap rate
0.6%
Rent to Value Ratio
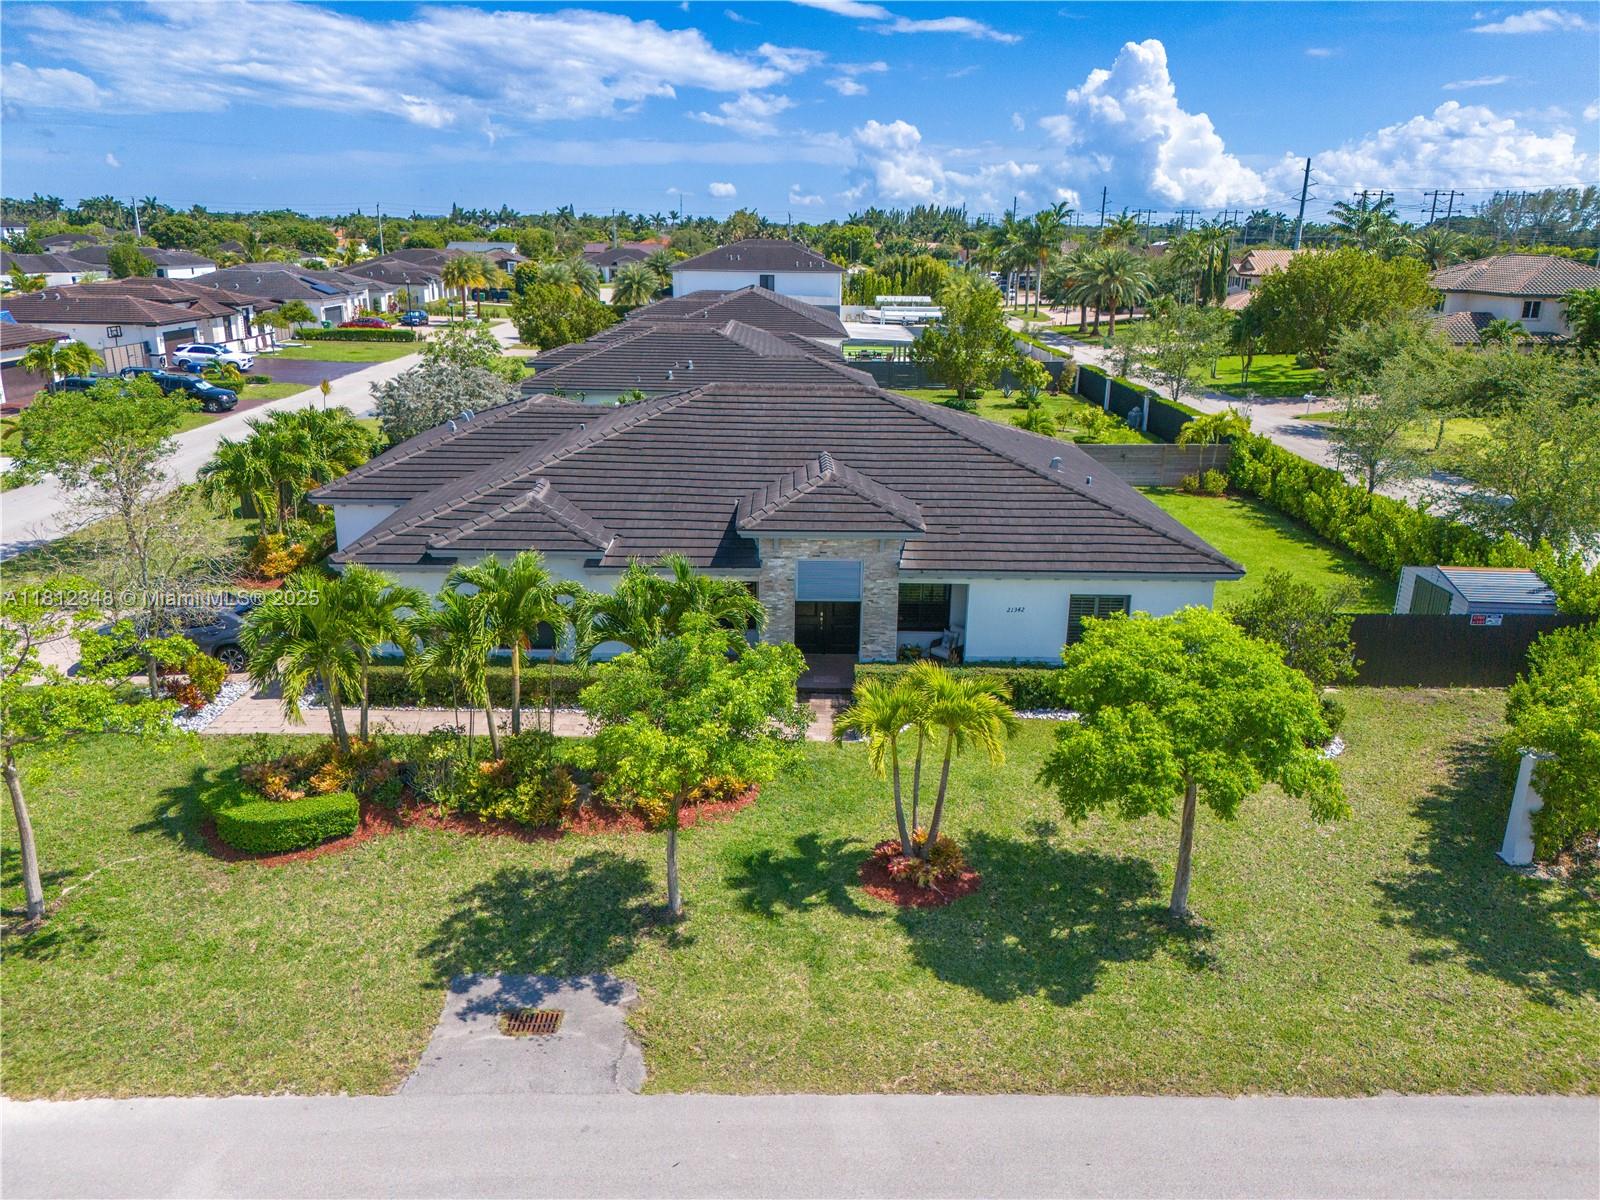
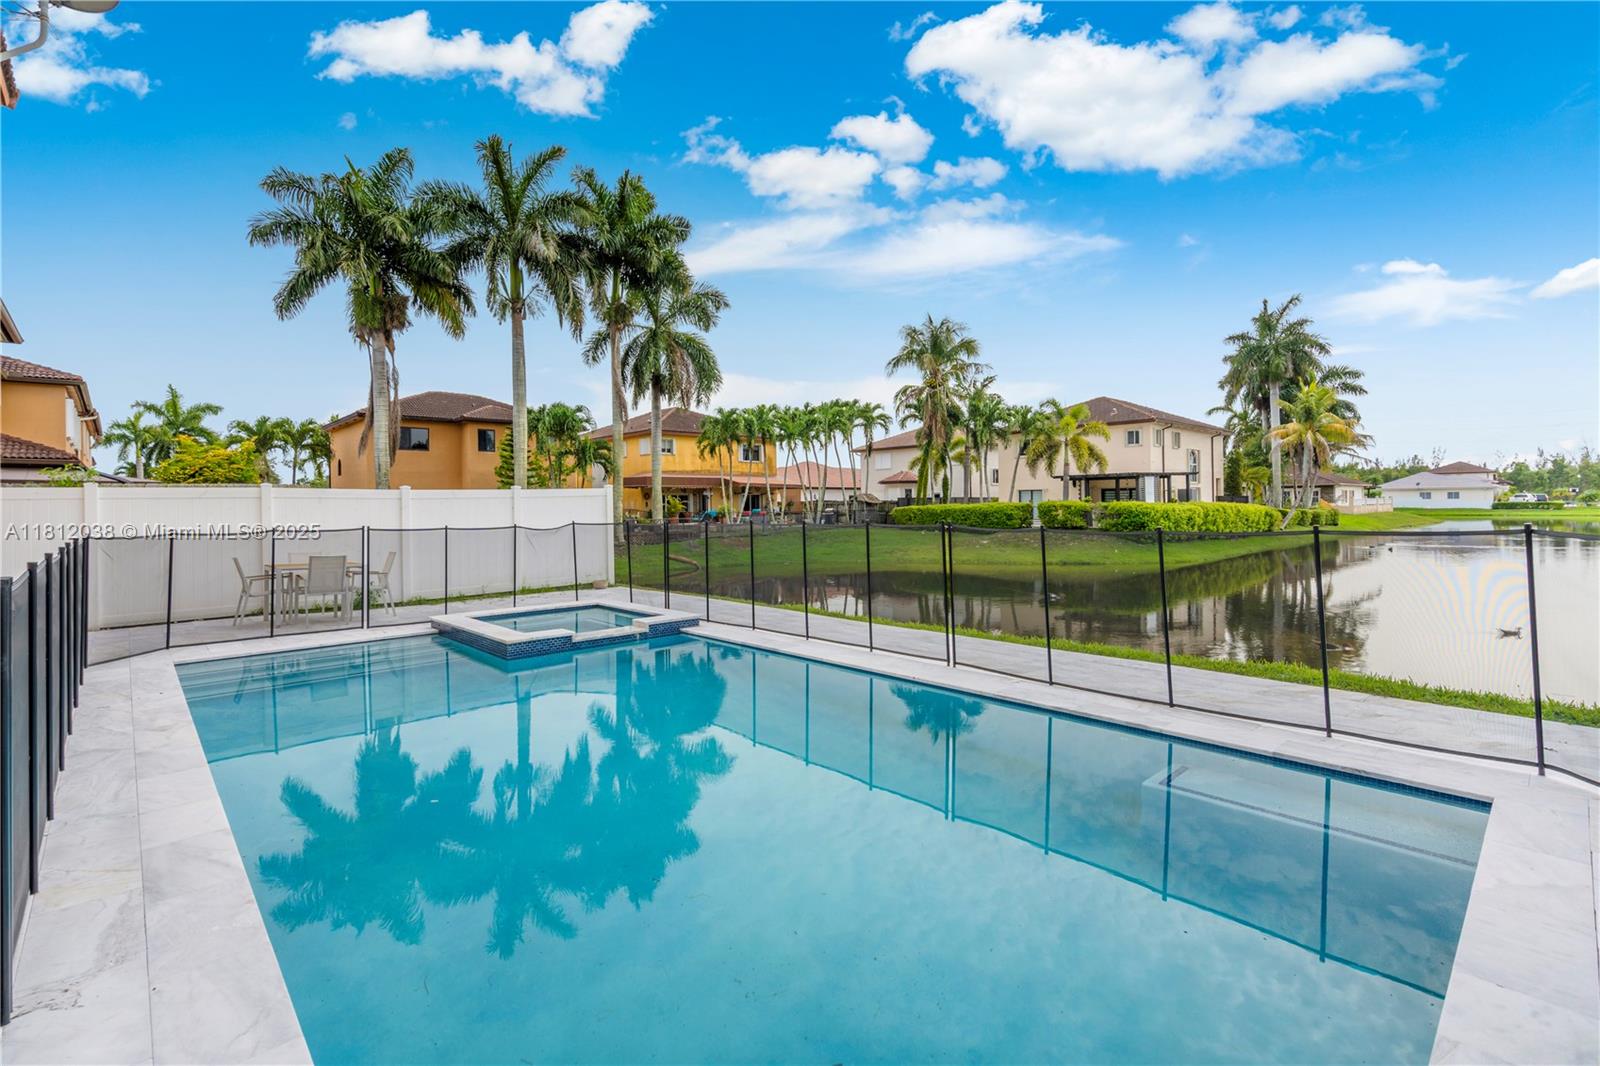
Active
$949,000
4
bds
|
4
ba
|
2,804
sqft
|
built
2018
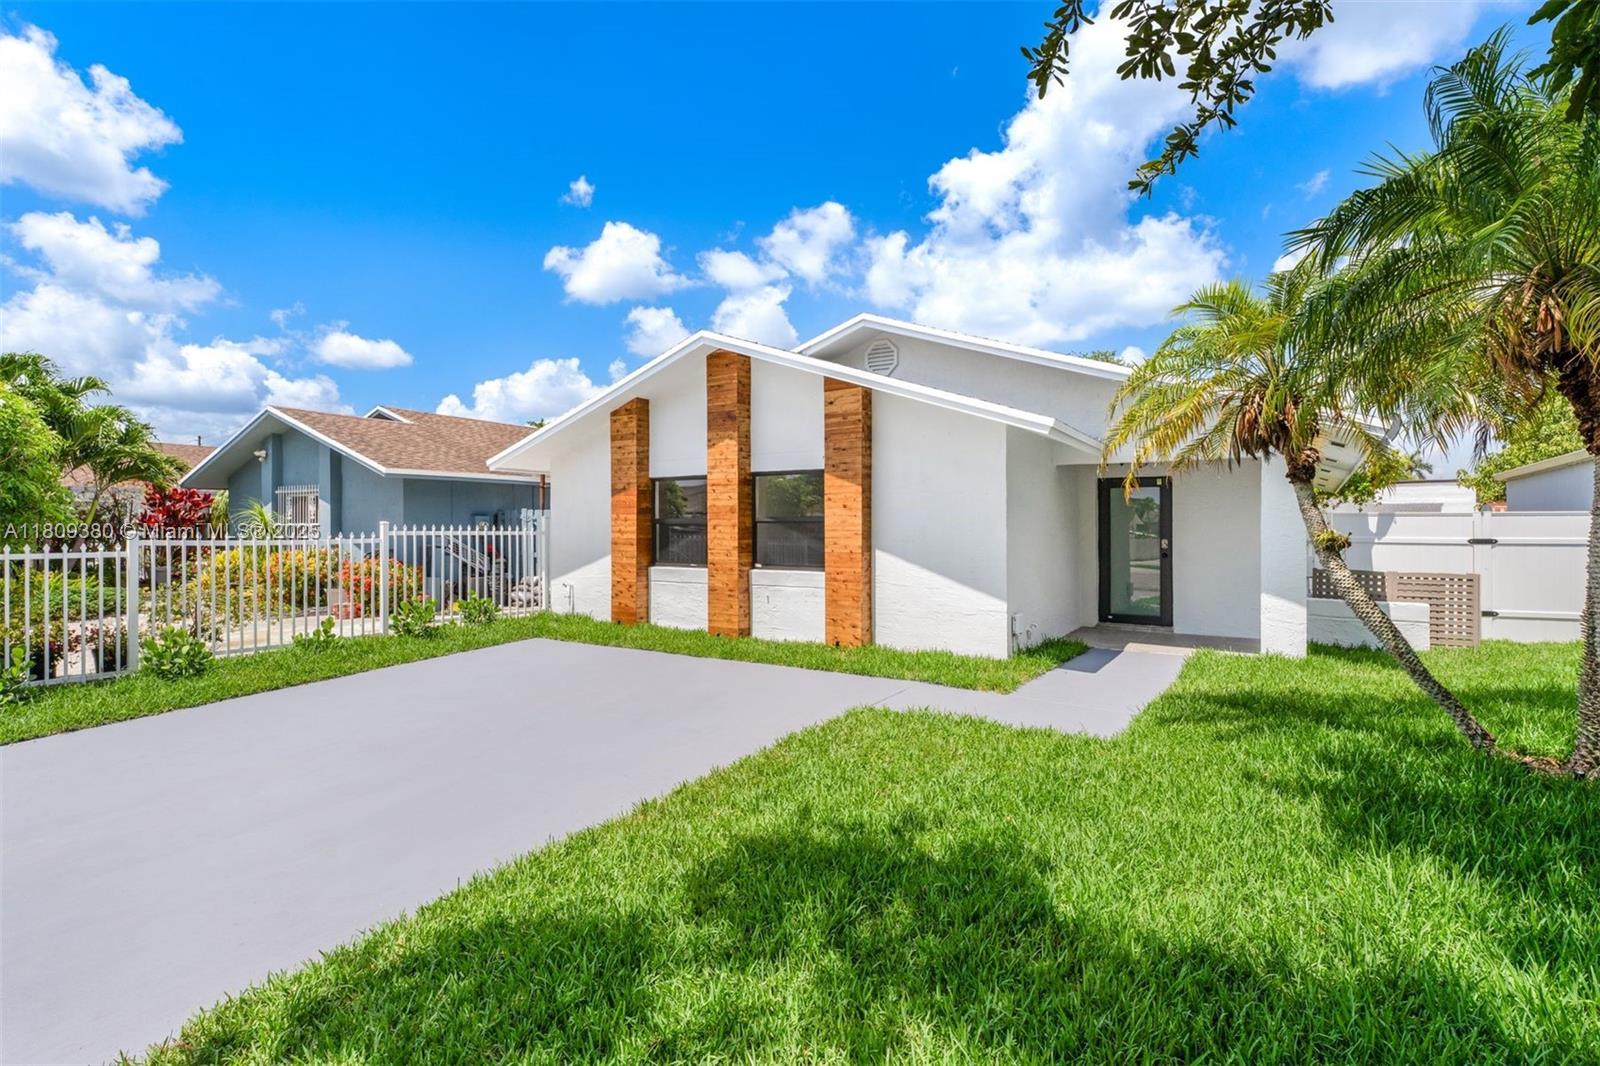
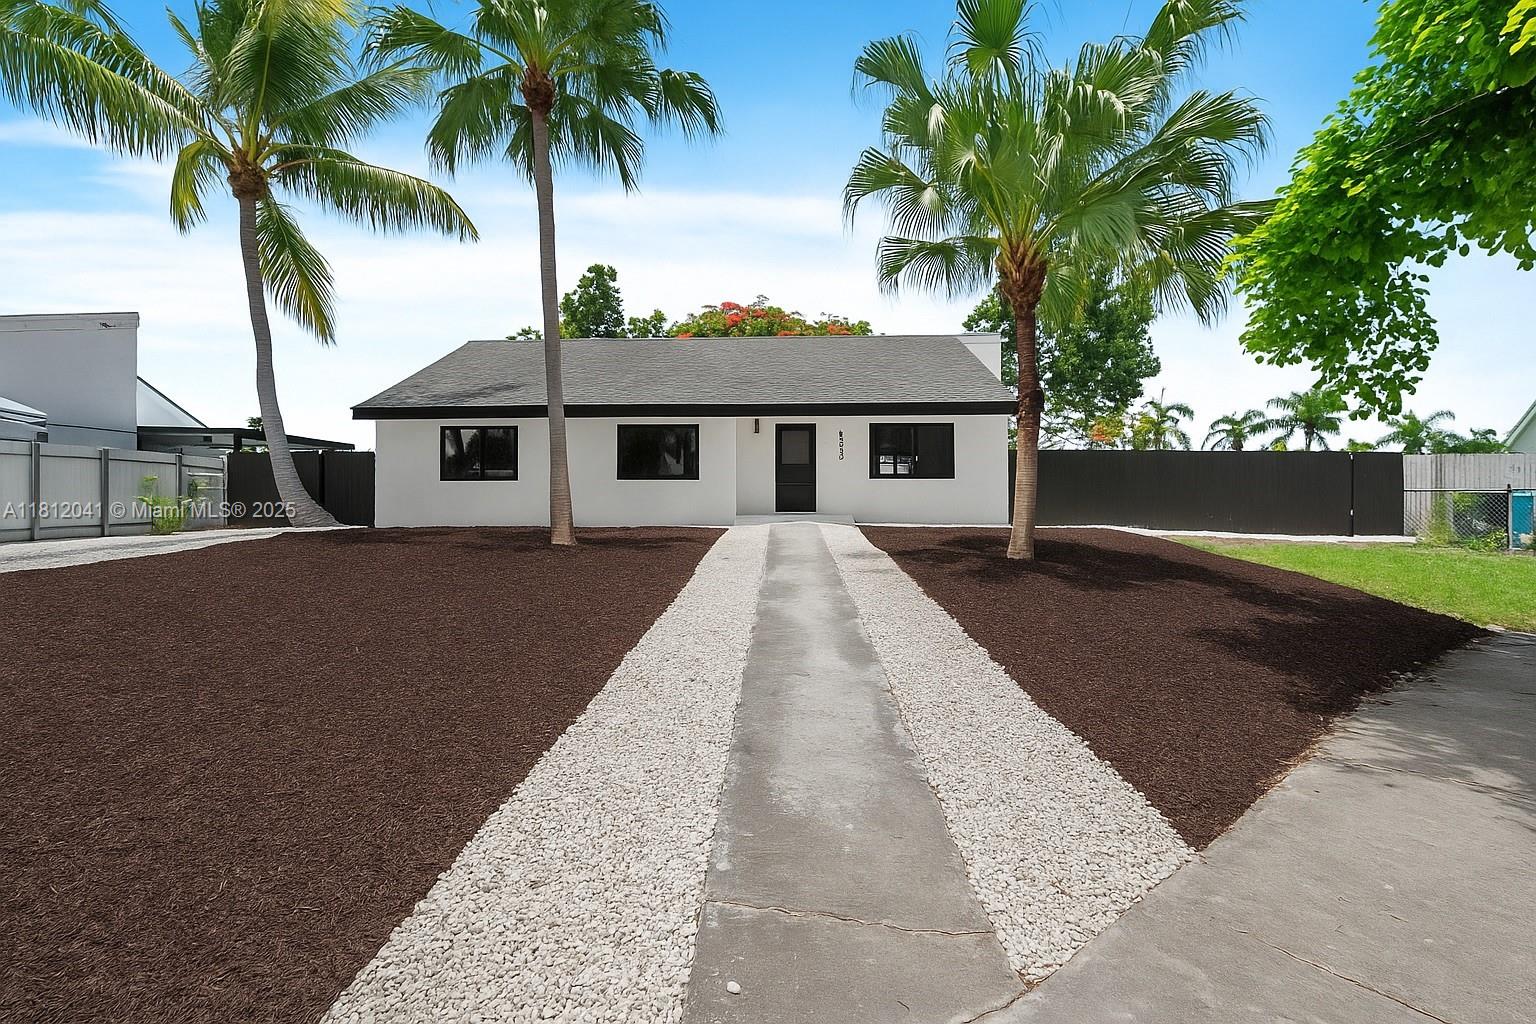
21342 SW 132nd Pl, Miami, FL 33177
$-1,612
Cash flow
-8.9%
Cash-on-Cash Return
4.2%
Cap rate
0.5%
Rent to Value Ratio
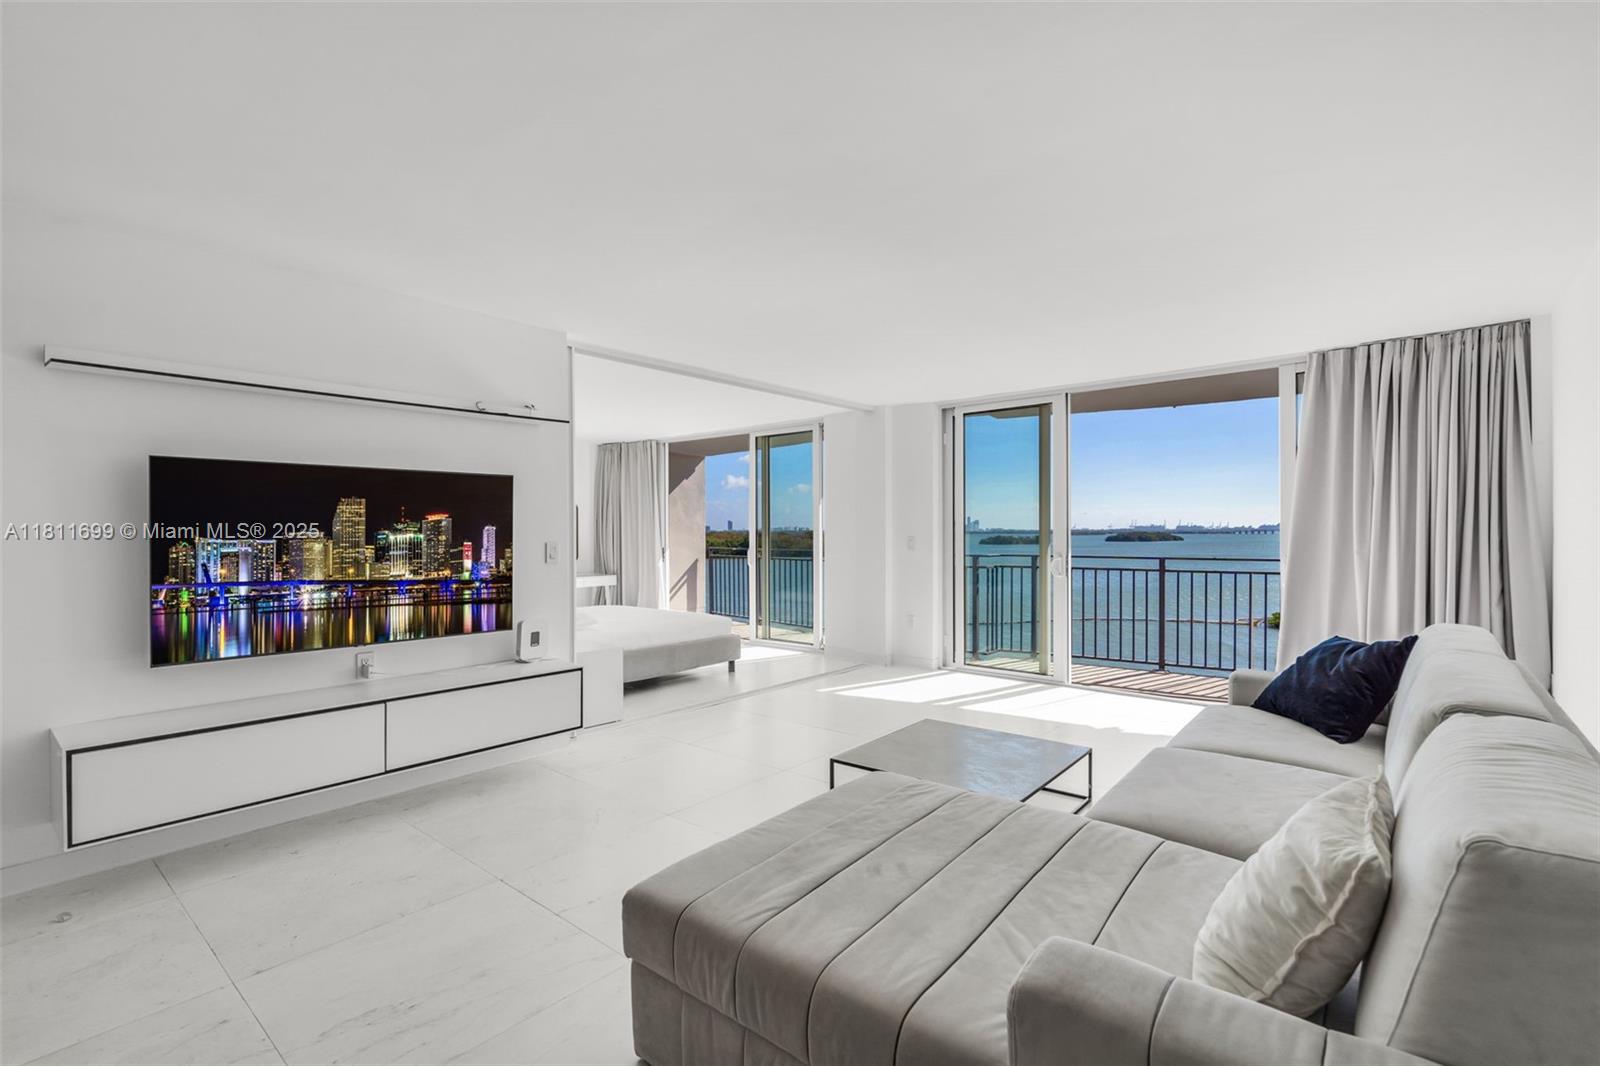
Active
$519,000
2
bds
|
2
ba
|
881
sqft
|
built
2007
1723 SW 2nd Ave, Miami, FL 33129
$-1,926
Cash flow
-19.4%
Cash-on-Cash Return
1.8%
Cap rate
0.7%
Rent to Value Ratio

Active
$480,000
2
bds
|
2
ba
|
1,153
sqft
|
built
2007
133 NE 2nd Ave, Miami, FL 33132
$-1,779
Cash flow
-19.3%
Cash-on-Cash Return
1.8%
Cap rate
0.7%
Rent to Value Ratio
Active
$1,499,000
2
bds
|
3
ba
|
1,634
sqft
|
built
1983
151 SE 15th Rd, Miami, FL 33129
$-6,157
Cash flow
-21.4%
Cash-on-Cash Return
1.4%
Cap rate
0.5%
Rent to Value Ratio
Active
$347,500
2
bds
|
2
ba
|
1,358
sqft
|
built
1968
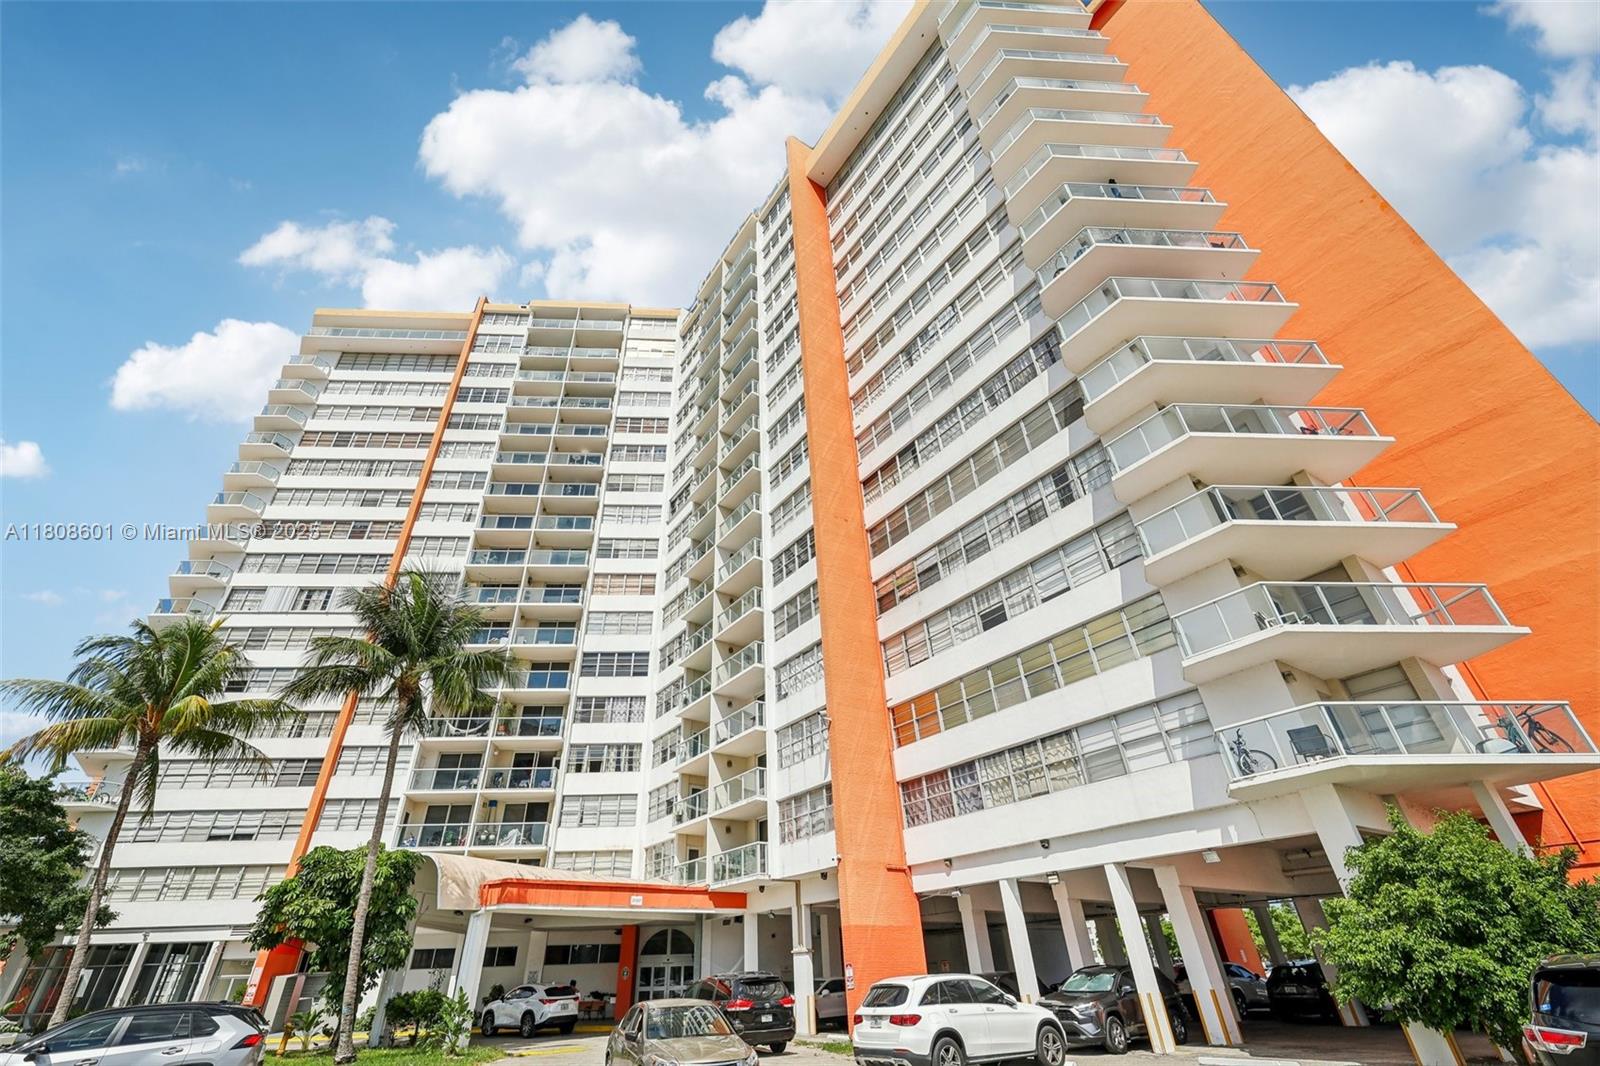
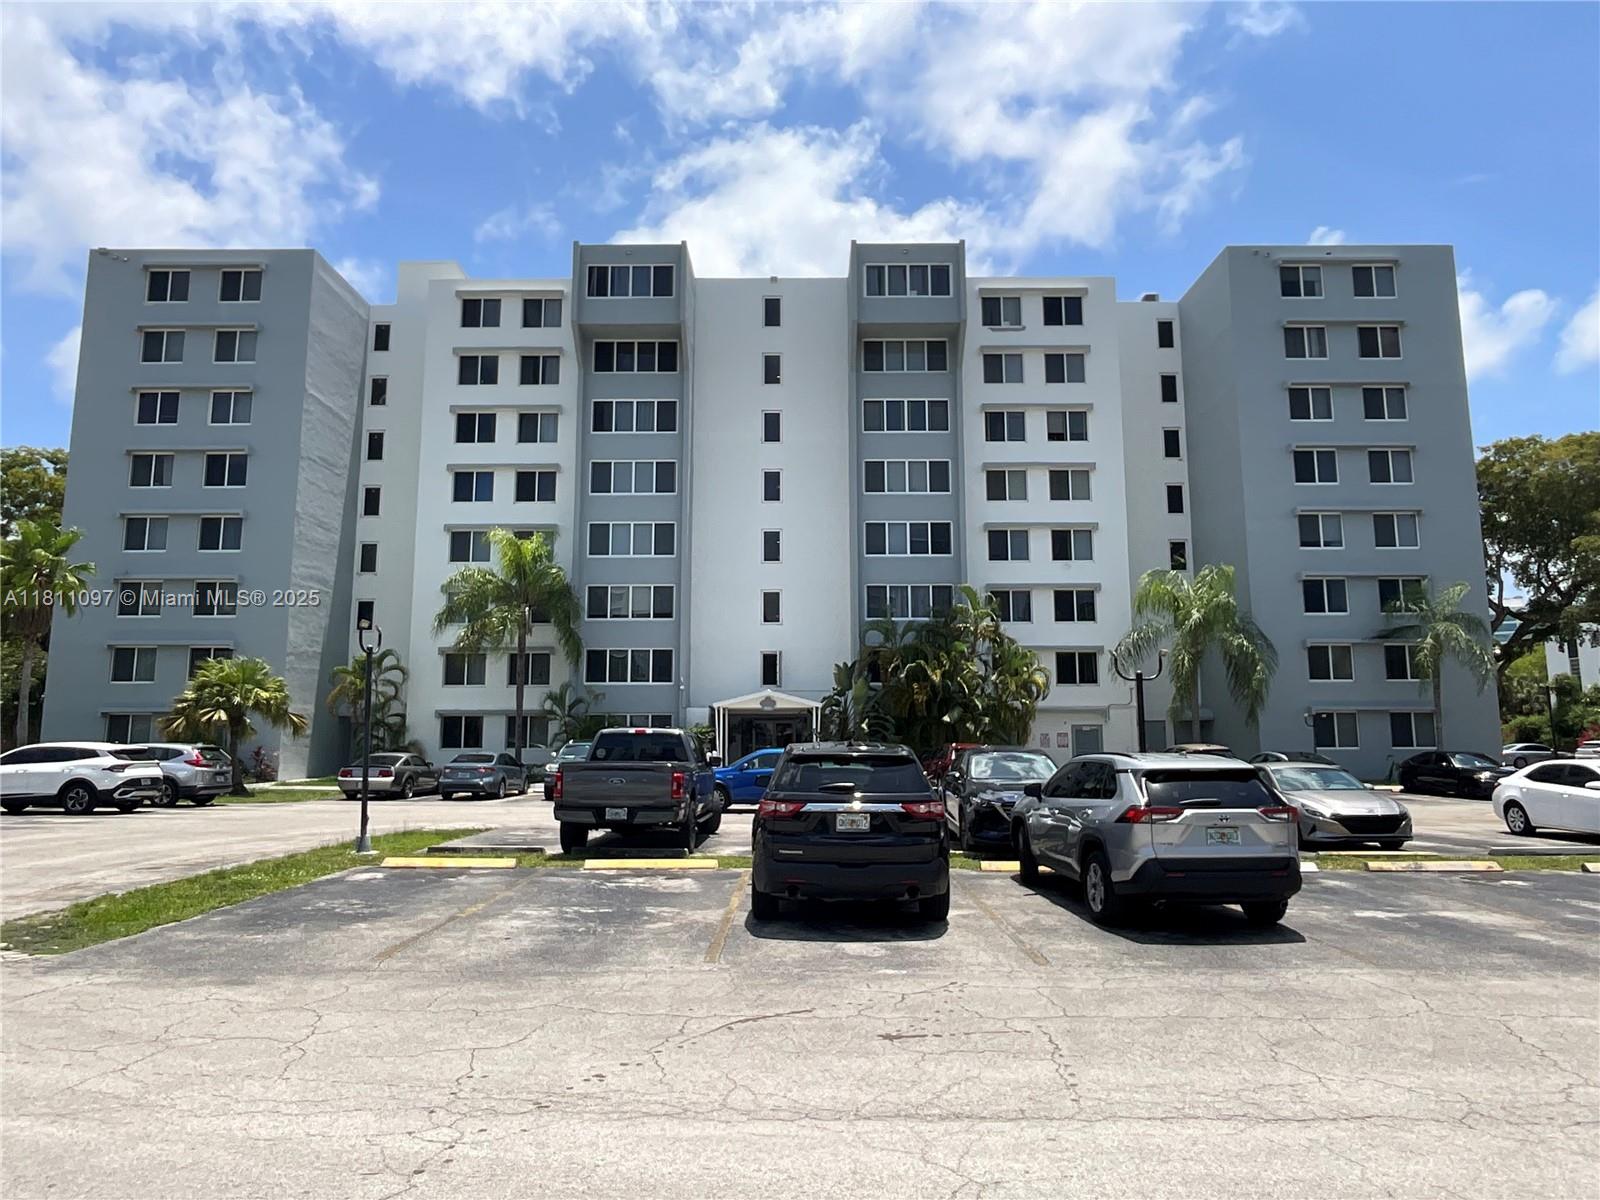
11111 Biscayne Blvd, Miami, FL 33181
$-1,426
Cash flow
-21.4%
Cash-on-Cash Return
1.4%
Cap rate
1.0%
Rent to Value Ratio
Active
$165,000
1
bds
|
1
ba
|
801
sqft
|
built
1969
1351 NE Miami Gardens Dr, Miami, FL 33179
$97
Cash flow
3.1%
Cash-on-Cash Return
7.0%
Cap rate
1.3%
Rent to Value Ratio
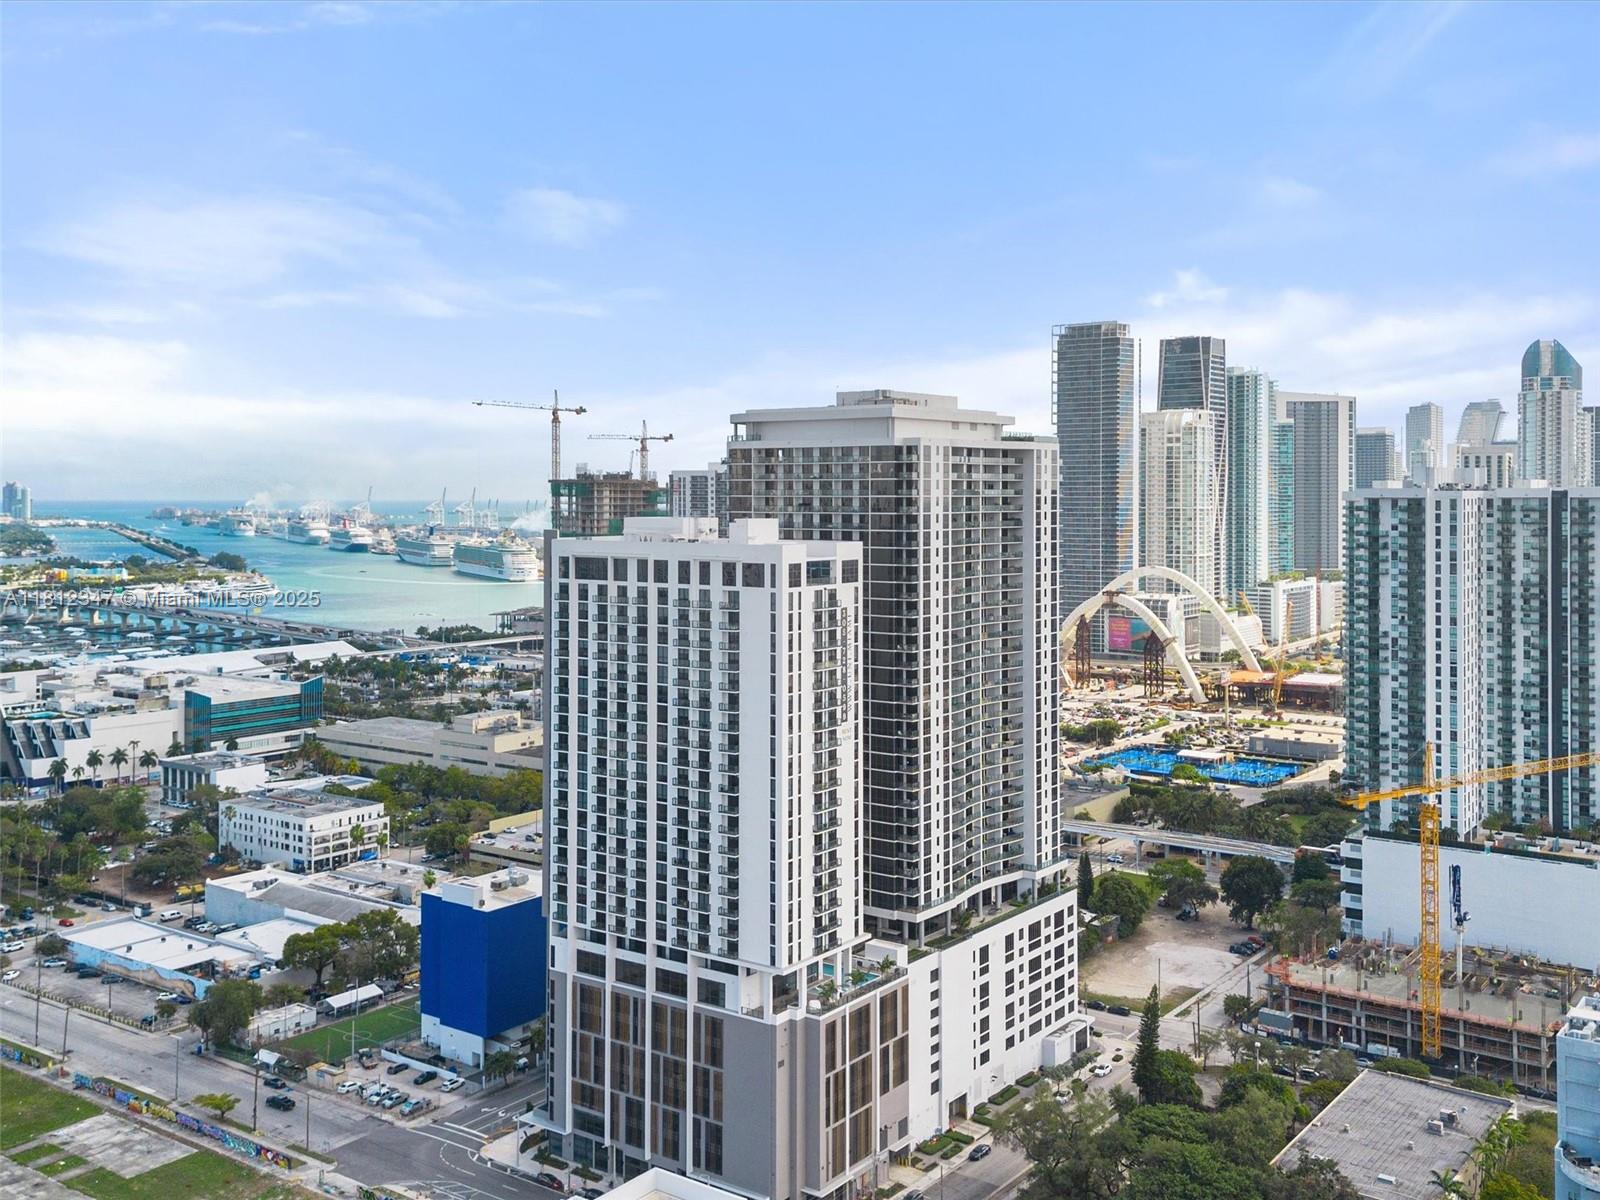
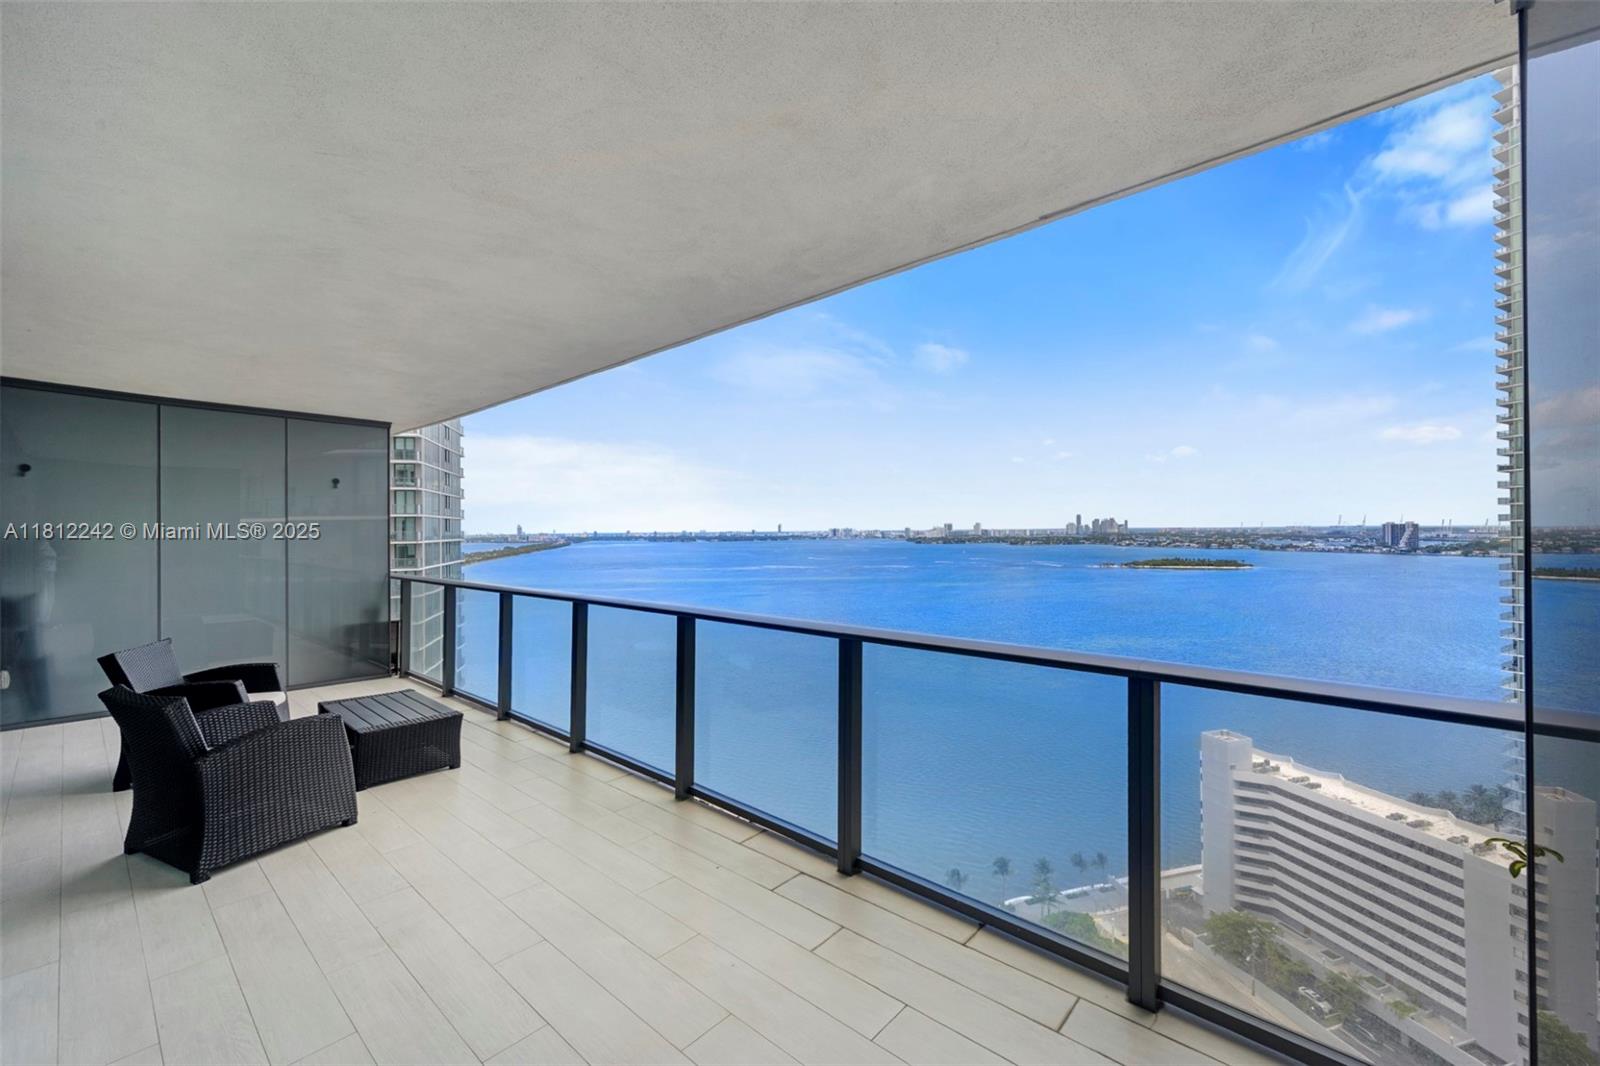
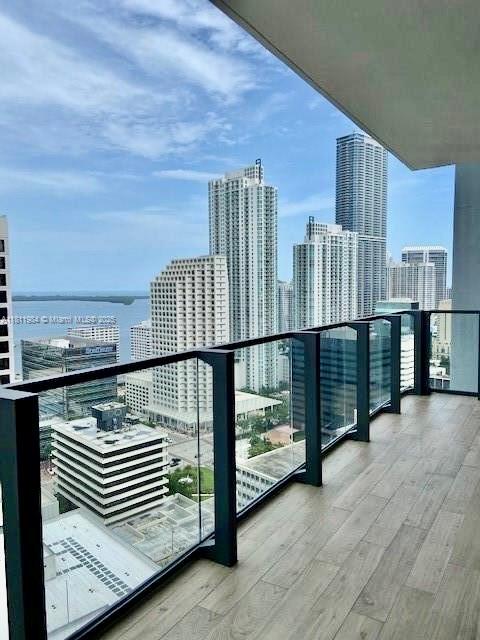
Active
$1,120,000
2
bds
|
3
ba
|
1,278
sqft
|
built
2008
950 Brickell Bay Dr, Miami, FL 33131
$-3,866
Cash flow
-18.0%
Cash-on-Cash Return
2.1%
Cap rate
0.6%
Rent to Value Ratio
Active
$879,000
3
bds
|
3
ba
|
2,446
sqft
|
built
1991
11985 SW 98th Ln, Miami, FL 33186
$-2,193
Cash flow
-13.0%
Cash-on-Cash Return
3.3%
Cap rate
0.5%
Rent to Value Ratio
Active
$440,000
1
bds
|
1
ba
|
752
sqft
|
built
2018
1600 NE 1st Ave, Miami, FL 33132
$-1,532
Cash flow
-18.2%
Cash-on-Cash Return
2.1%
Cap rate
0.7%
Rent to Value Ratio
Active
$895,000
5
bds
|
3
ba
|
2,765
sqft
|
built
2004
1724 SW 154th Path, Miami, FL 33185
$-1,884
Cash flow
-11.0%
Cash-on-Cash Return
3.8%
Cap rate
0.5%
Rent to Value Ratio
Active
$470,000
2
bds
|
2
ba
|
1,042
sqft
|
built
1965
770 NE 69th St, Miami, FL 33138
$-1,251
Cash flow
-13.9%
Cash-on-Cash Return
3.1%
Cap rate
0.9%
Rent to Value Ratio
Active
$1,077,000
2
bds
|
3
ba
|
1,175
sqft
|
built
2018
650 NE 32nd St, Miami, FL 33137
$-4,075
Cash flow
-19.7%
Cash-on-Cash Return
1.7%
Cap rate
0.6%
Rent to Value Ratio
Active
$525,000
1
bds
|
2
ba
|
804
sqft
|
built
1969
150 SE 25th Rd, Miami, FL 33129
$-1,658
Cash flow
-16.5%
Cash-on-Cash Return
2.5%
Cap rate
0.6%
Rent to Value Ratio

Active
$450,000
1
bds
|
2
ba
|
868
sqft
|
built
1975
1865 Brickell Ave, Miami, FL 33129
$-1,798
Cash flow
-20.8%
Cash-on-Cash Return
1.5%
Cap rate
0.6%
Rent to Value Ratio
Active
$475,000
4
bds
|
2
ba
|
2,286
sqft
|
built
1959
13930 Van Buren St, Miami, FL 33176
$-718
Cash flow
-7.9%
Cash-on-Cash Return
4.5%
Cap rate
0.8%
Rent to Value Ratio
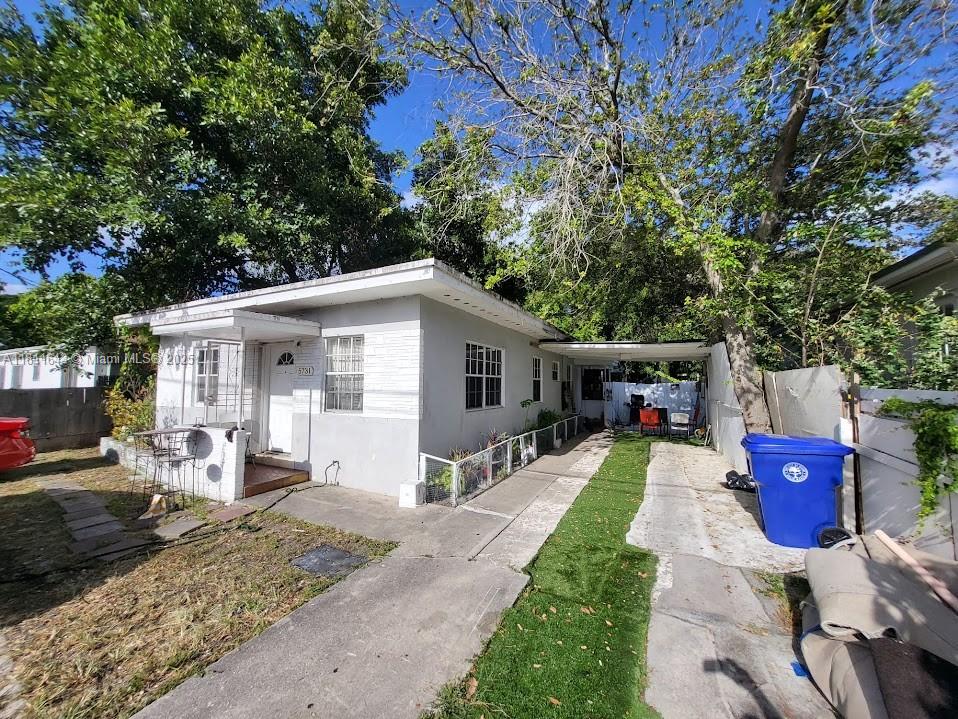
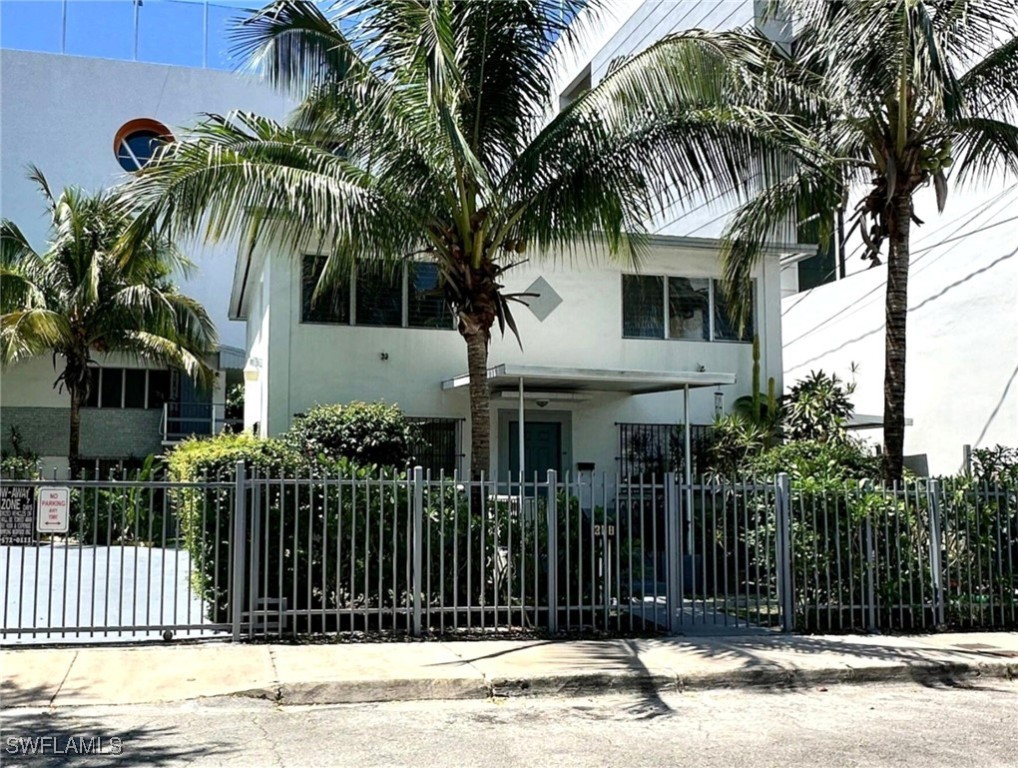
Active
$559,000
4
bds
|
0
ba
|
1,236
sqft
|
built
1954
5731 NW 6th Ave, Miami, FL 33127
$-1,768
Cash flow
-16.5%
Cash-on-Cash Return
2.5%
Cap rate
0.4%
Rent to Value Ratio
Active
$640,000
3
bds
|
2
ba
|
1,287
sqft
|
built
1989
21032 SW 121st Ave, Miami, FL 33177
$-1,523
Cash flow
-12.4%
Cash-on-Cash Return
3.4%
Cap rate
0.4%
Rent to Value Ratio
Active
$425,600
2
bds
|
3
ba
|
1,206
sqft
|
built
2002
8980 W Flagler St, Miami, FL 33174
$-675
Cash flow
-8.3%
Cash-on-Cash Return
4.4%
Cap rate
0.7%
Rent to Value Ratio
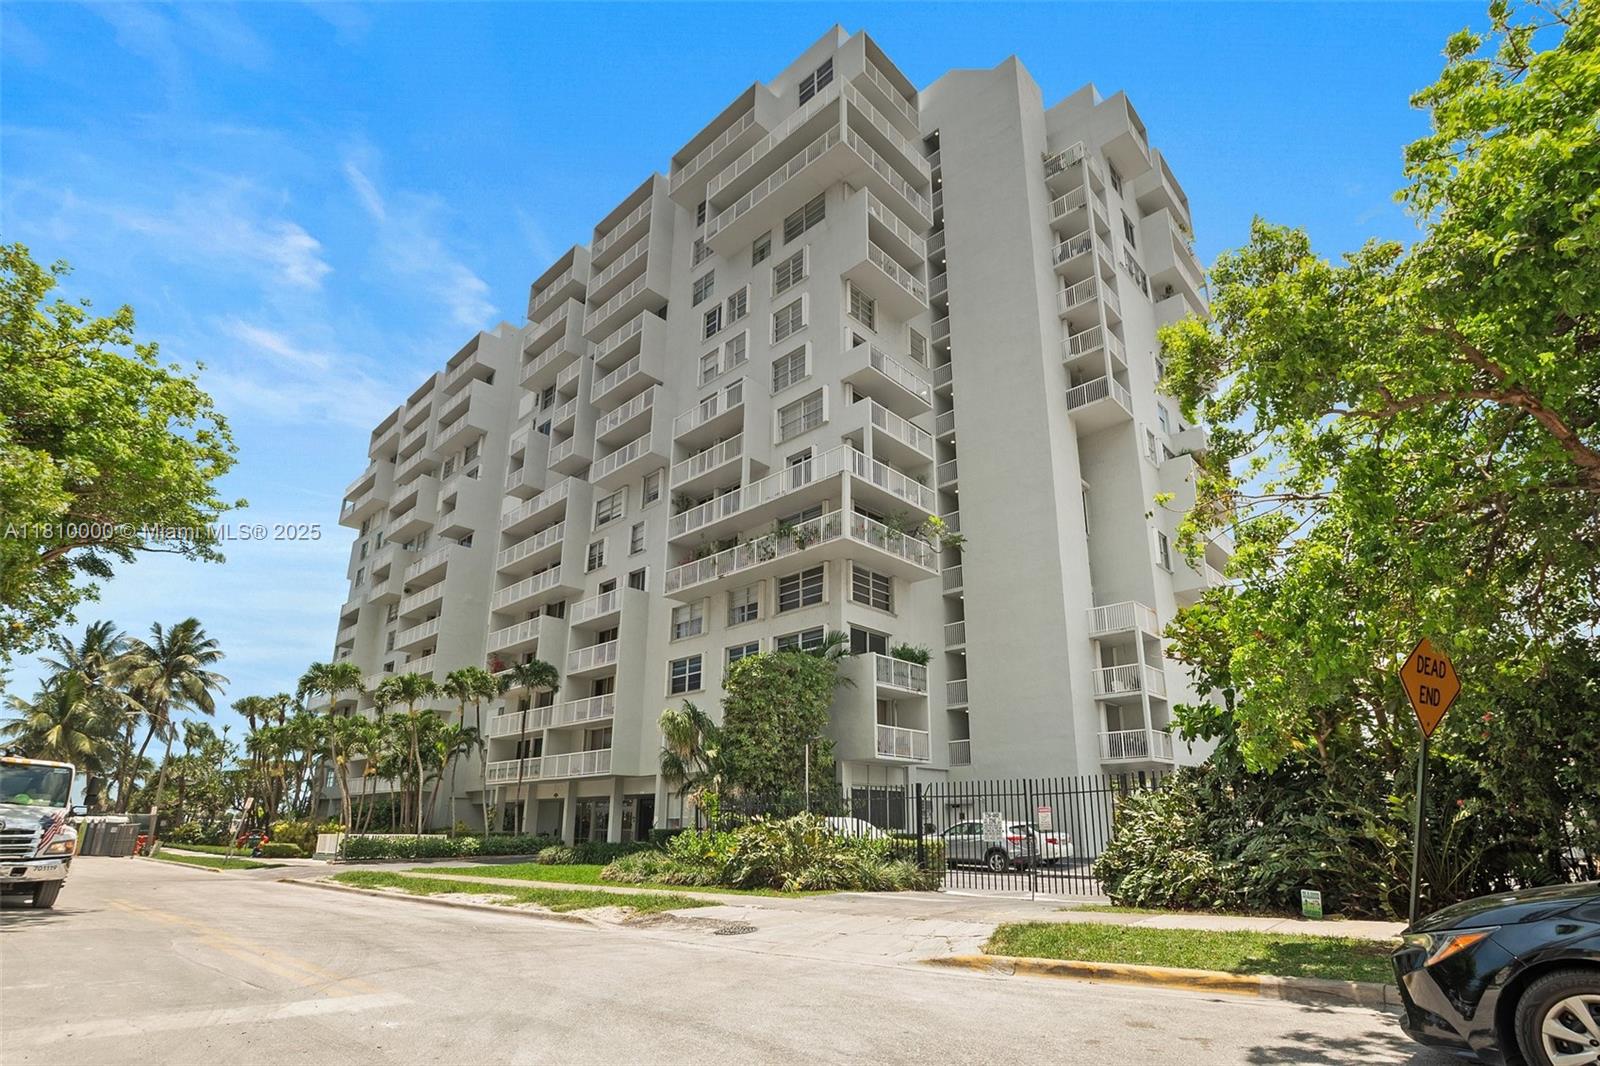
Active
$189,900
1
bds
|
2
ba
|
954
sqft
|
built
1966
1530 NE 191st St, Miami, FL 33179
$-388
Cash flow
-10.7%
Cash-on-Cash Return
3.8%
Cap rate
0.9%
Rent to Value Ratio
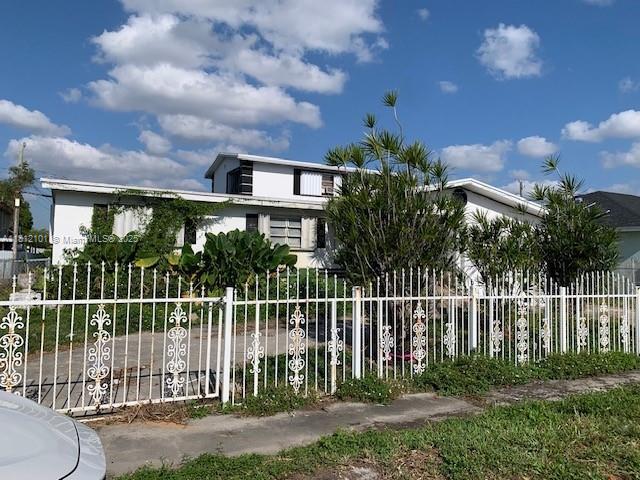
Active
$1,350,000
4
bds
|
0
ba
|
2,241
sqft
|
built
1962
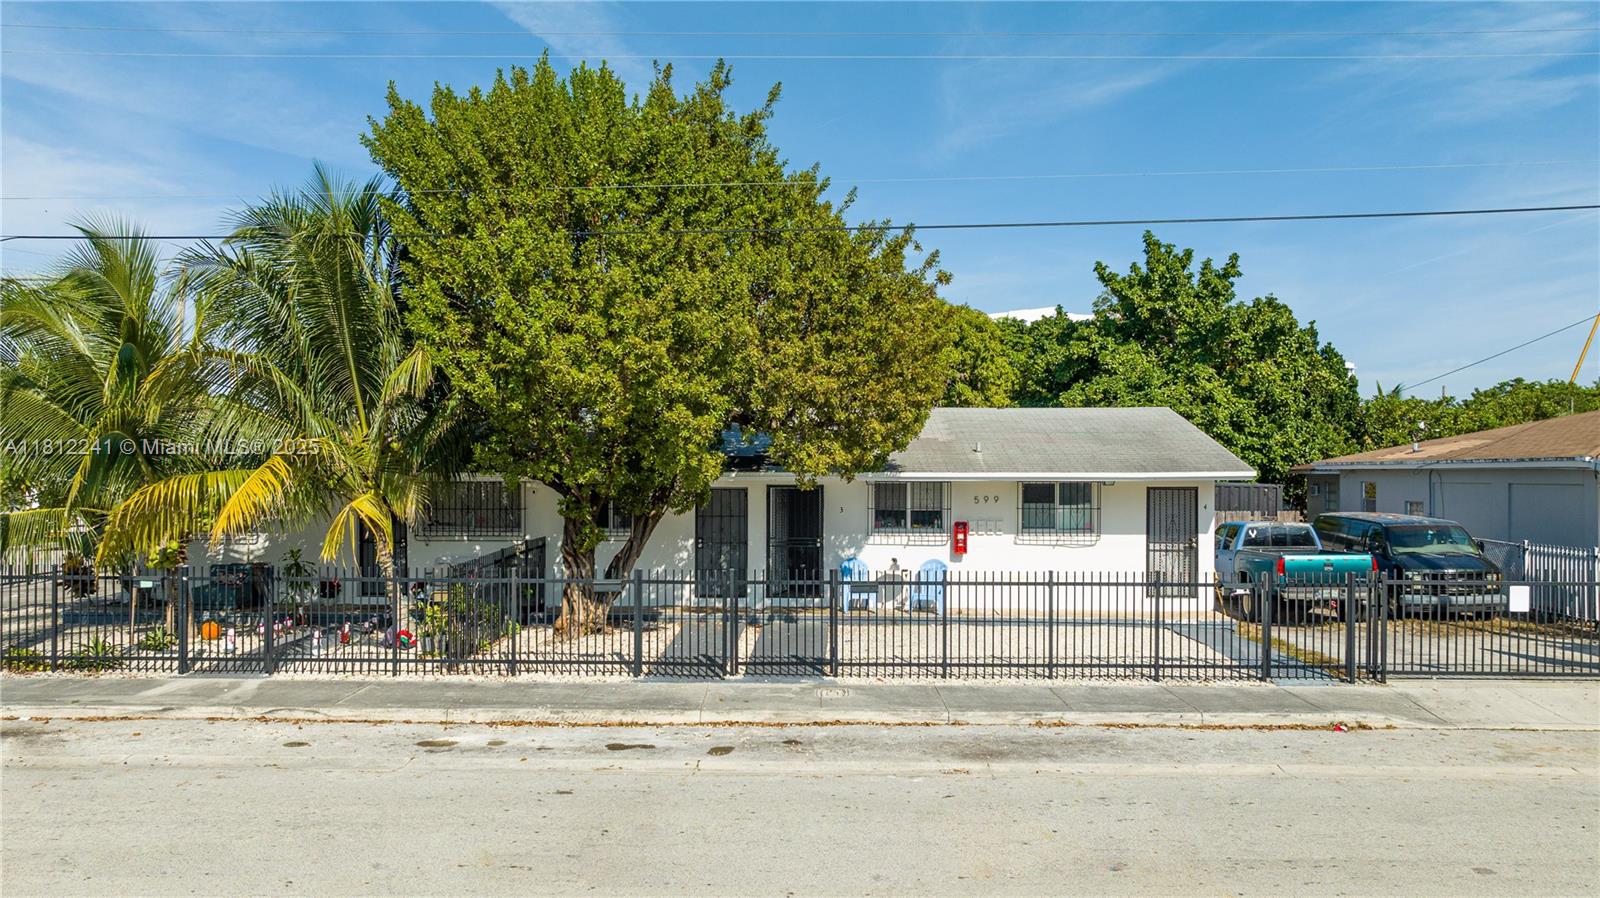
599 NW 33rd St, Miami, FL 33127
$-4,426
Cash flow
-17.1%
Cash-on-Cash Return
2.4%
Cap rate
0.4%
Rent to Value Ratio
Active
$270,000
2
bds
|
2
ba
|
912
sqft
|
built
1991
14931 SW 82nd Ln, Miami, FL 33193
$-590
Cash flow
-11.4%
Cash-on-Cash Return
3.7%
Cap rate
0.7%
Rent to Value Ratio
Active
$470,000
1
bds
|
1
ba
|
825
sqft
|
built
2004
1200 Brickell Bay Dr, Miami, FL 33131
$-1,641
Cash flow
-18.2%
Cash-on-Cash Return
2.1%
Cap rate
0.7%
Rent to Value Ratio
Active
$325,000
2
bds
|
2
ba
|
914
sqft
|
built
1989
850 N Miami Ave, Miami, FL 33136
$-1,146
Cash flow
-18.4%
Cash-on-Cash Return
2.1%
Cap rate
0.9%
Rent to Value Ratio
Active
$1,950,000
3
bds
|
3
ba
|
2,438
sqft
|
built
1993
19700 SW 184th St, Miami, FL 33187
$-9,180
Cash flow
-24.6%
Cash-on-Cash Return
0.6%
Cap rate
0.1%
Rent to Value Ratio
Active
$415,000
3
bds
|
2
ba
|
1,260
sqft
|
built
2001
8964 W Flagler St, Miami, FL 33174
$-809
Cash flow
-10.2%
Cash-on-Cash Return
3.9%
Cap rate
0.7%
Rent to Value Ratio
Active
$190,000
2
bds
|
2
ba
|
1,075
sqft
|
built
1972
1461 NE 150th St, Miami, FL 33161
$-169
Cash flow
-4.6%
Cash-on-Cash Return
5.2%
Cap rate
1.1%
Rent to Value Ratio
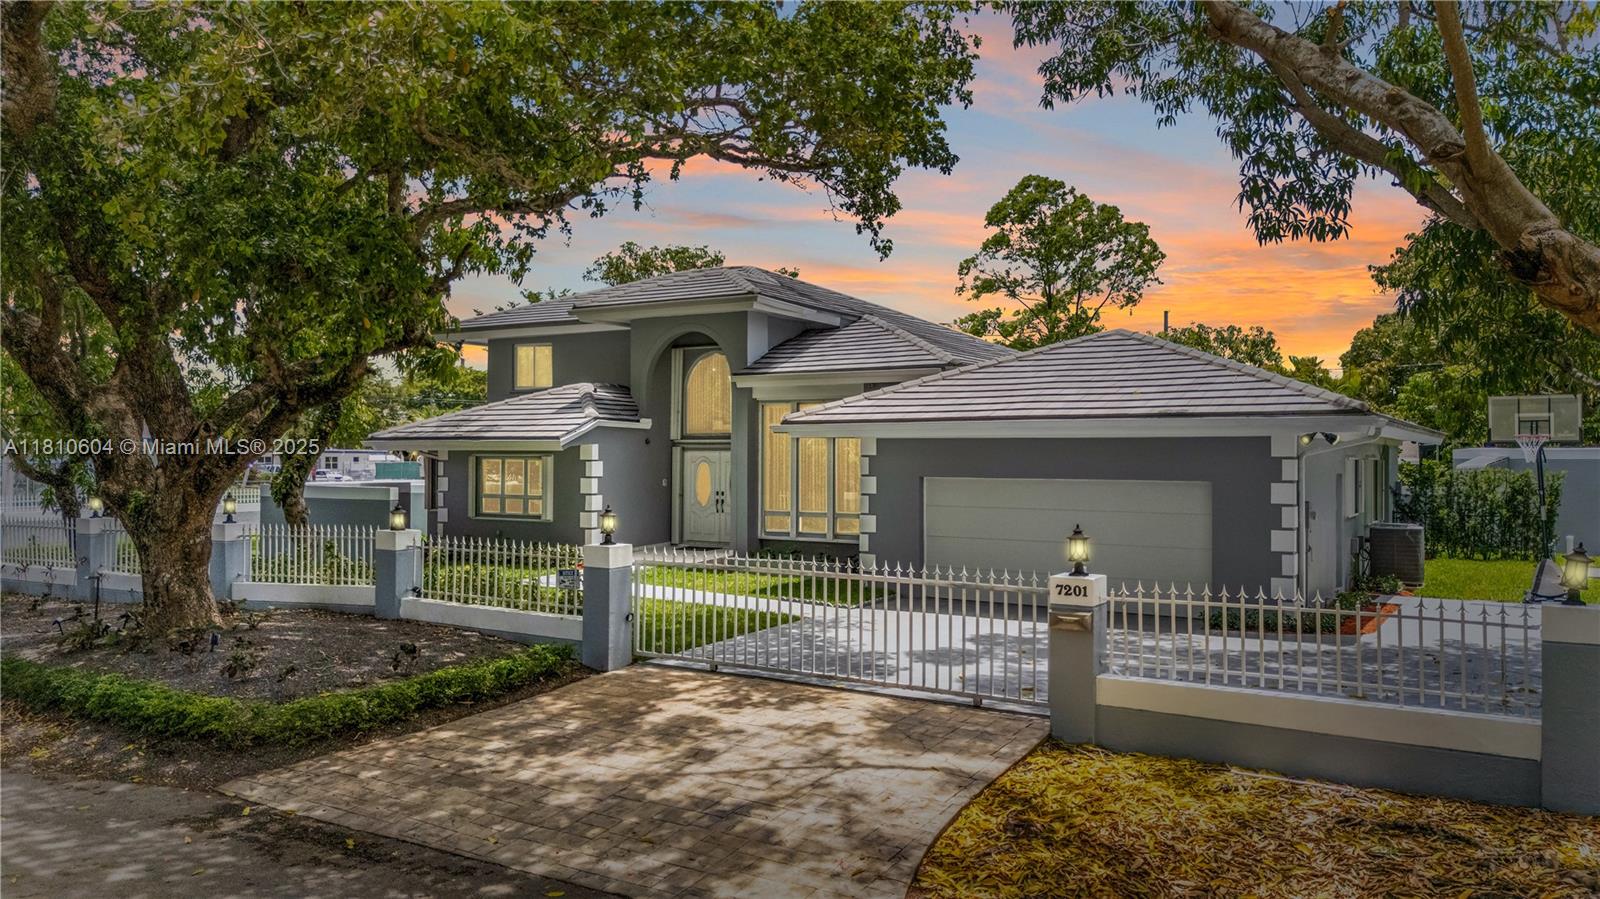
Active
$1,500,000
4
bds
|
3
ba
|
3,390
sqft
|
built
1990
7201 SW 84th Pl, Miami, FL 33143
$-4,936
Cash flow
-17.2%
Cash-on-Cash Return
2.3%
Cap rate
0.4%
Rent to Value Ratio
Active
$2,995,000
5
bds
|
6
ba
|
4,269
sqft
|
built
2023
13221 SW 220th St, Miami, FL 33170
$-11,790
Cash flow
-20.5%
Cash-on-Cash Return
1.6%
Cap rate
0.3%
Rent to Value Ratio
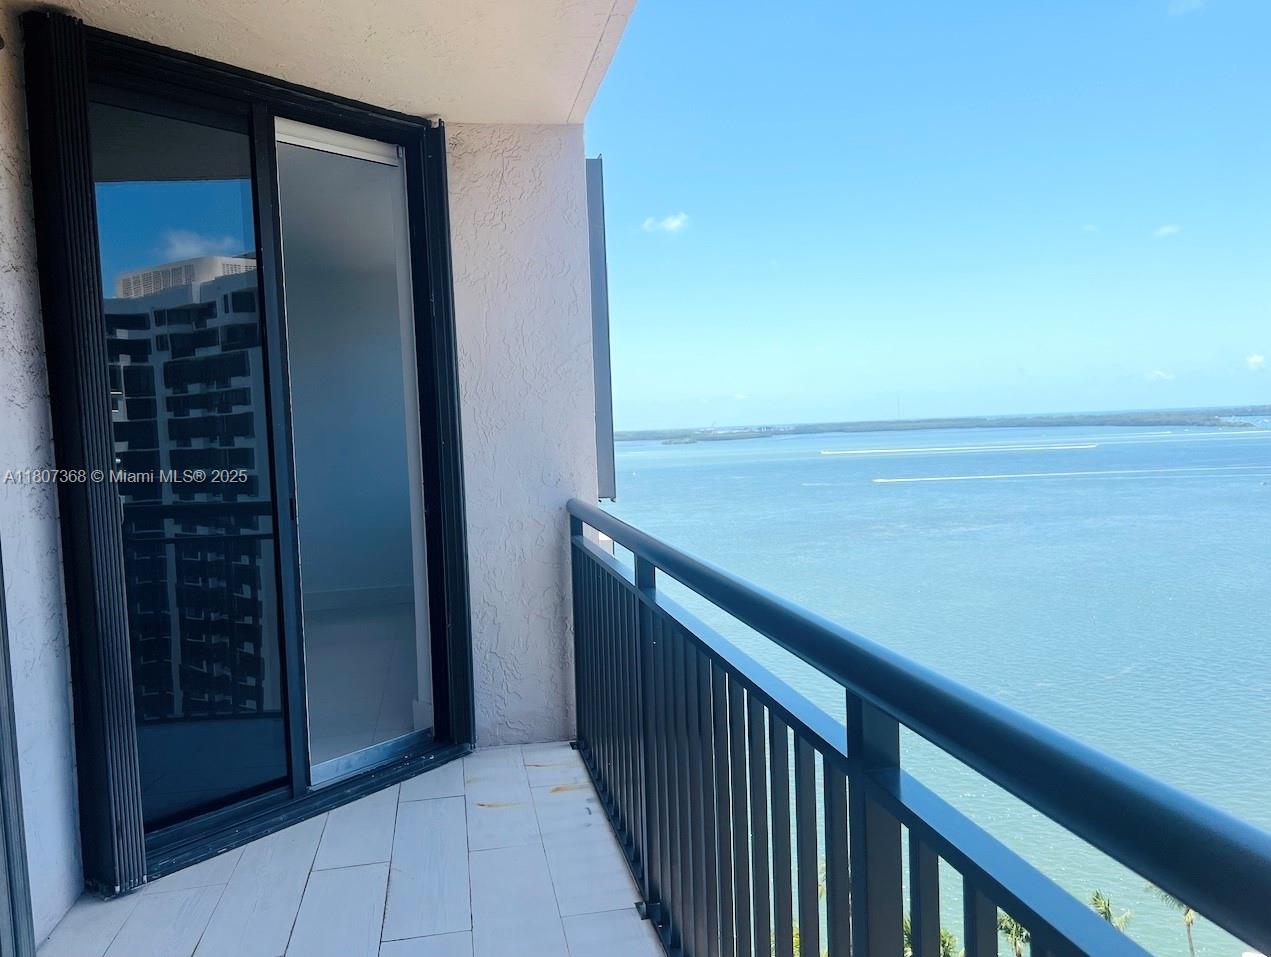
Active
$655,000
2
bds
|
2
ba
|
1,030
sqft
|
built
1991
540 Brickell Key Dr, Miami, FL 33131
$-2,616
Cash flow
-20.8%
Cash-on-Cash Return
1.5%
Cap rate
0.7%
Rent to Value Ratio
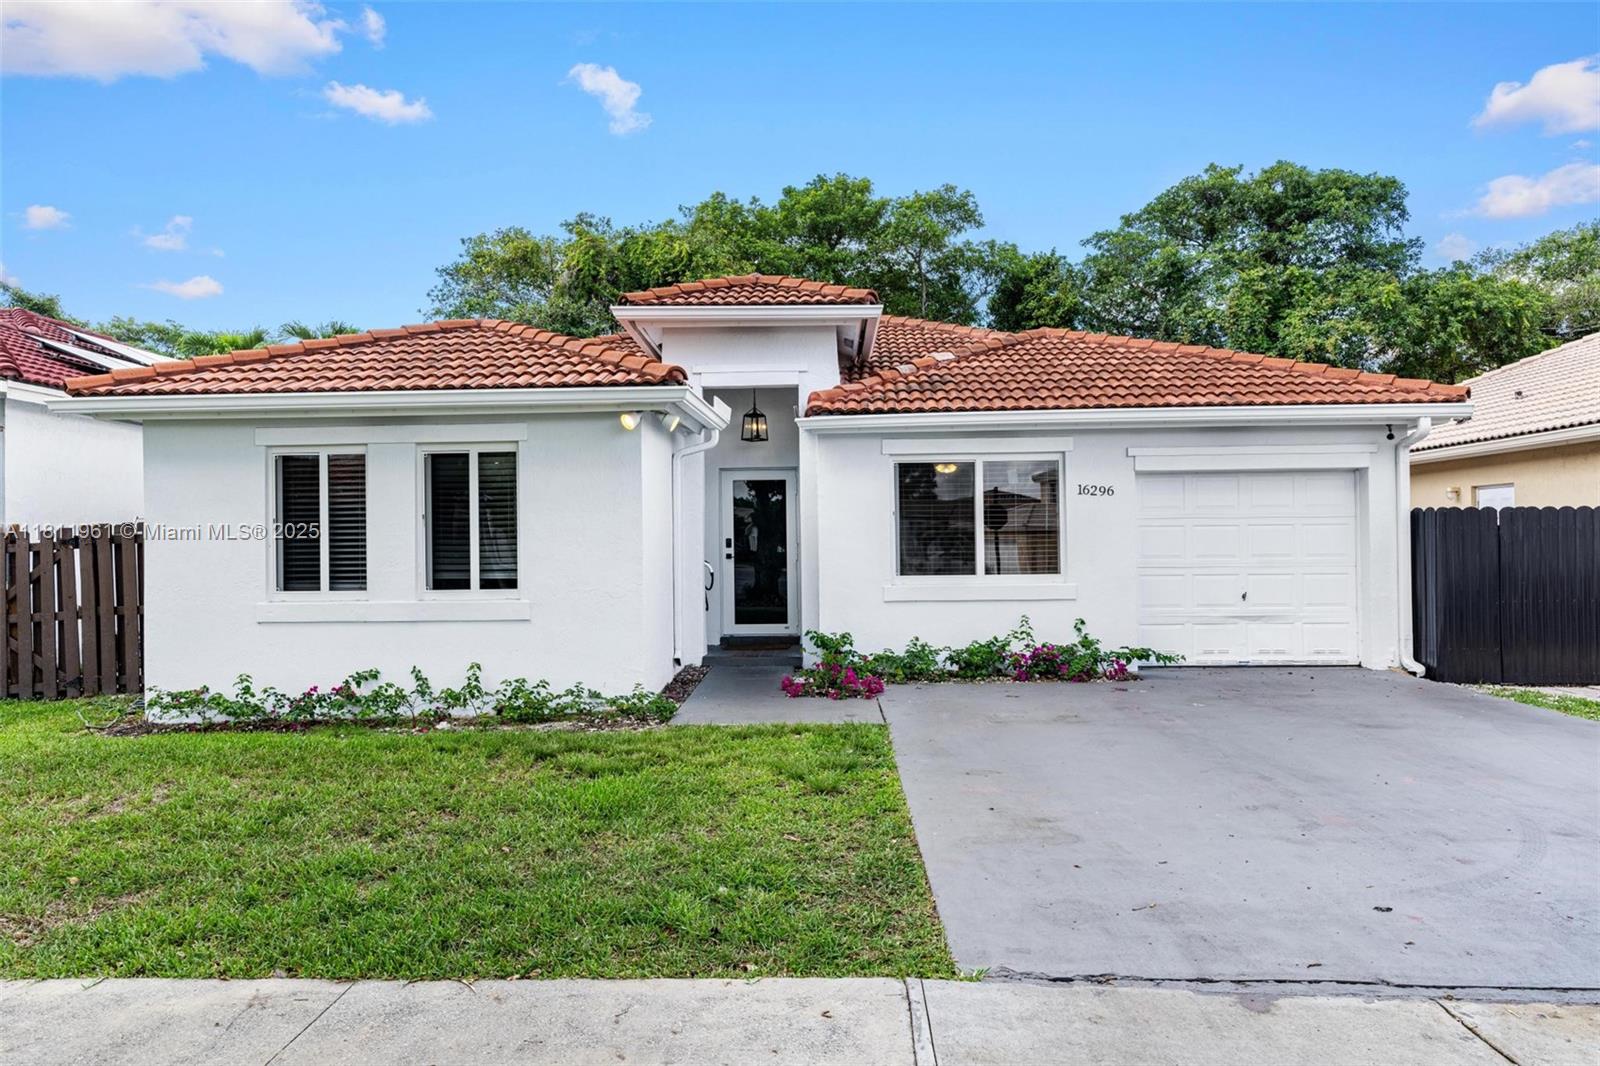
Active
$715,000
4
bds
|
3
ba
|
1,986
sqft
|
built
1995
16296 SW 83rd Ln, Miami, FL 33193
$-1,244
Cash flow
-9.1%
Cash-on-Cash Return
4.2%
Cap rate
0.6%
Rent to Value Ratio
Active under contract
$2,575,000
4
bds
|
4
ba
|
3,009
sqft
|
built
1937
148 SW 22nd Rd, Miami, FL 33129
$-9,520
Cash flow
-19.3%
Cash-on-Cash Return
1.8%
Cap rate
0.3%
Rent to Value Ratio
Active
$1,060,000
4
bds
|
4
ba
|
2,409
sqft
|
built
2002
15760 SW 45th St, Miami, FL 33185
$-3,176
Cash flow
-15.6%
Cash-on-Cash Return
2.7%
Cap rate
0.4%
Rent to Value Ratio
Active
$775,000
2
bds
|
3
ba
|
1,435
sqft
|
built
2008
950 Brickell Bay Dr, Miami, FL 33131
$-2,953
Cash flow
-19.9%
Cash-on-Cash Return
1.7%
Cap rate
0.7%
Rent to Value Ratio
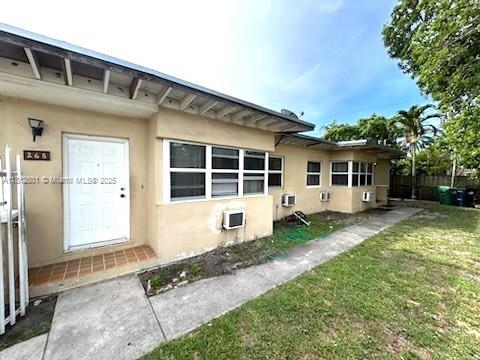
Active
$640,000
2
bds
|
0
ba
|
1,724
sqft
|
built
1947
266 NE 111th St, Miami, FL 33161
$-2,226
Cash flow
-18.1%
Cash-on-Cash Return
2.1%
Cap rate
0.4%
Rent to Value Ratio
Active
$1,200,000
2
bds
|
3
ba
|
1,542
sqft
|
built
2016
68 SE 6th St, Miami, FL 33131
$-5,715
Cash flow
-24.8%
Cash-on-Cash Return
0.6%
Cap rate
0.5%
Rent to Value Ratio
Active
$3,800,000
6
bds
|
0
ba
|
0
sqft
|
built
1948
364 SW 11th St, Miami, FL 33130
$-18,168
Cash flow
-24.9%
Cash-on-Cash Return
0.5%
Cap rate
0.1%
Rent to Value Ratio
Active
$525,000
2
bds
|
2
ba
|
1,201
sqft
|
built
1988
6151 SW 115th Ave, Miami, FL 33173
$-1,378
Cash flow
-13.7%
Cash-on-Cash Return
3.1%
Cap rate
0.6%
Rent to Value Ratio
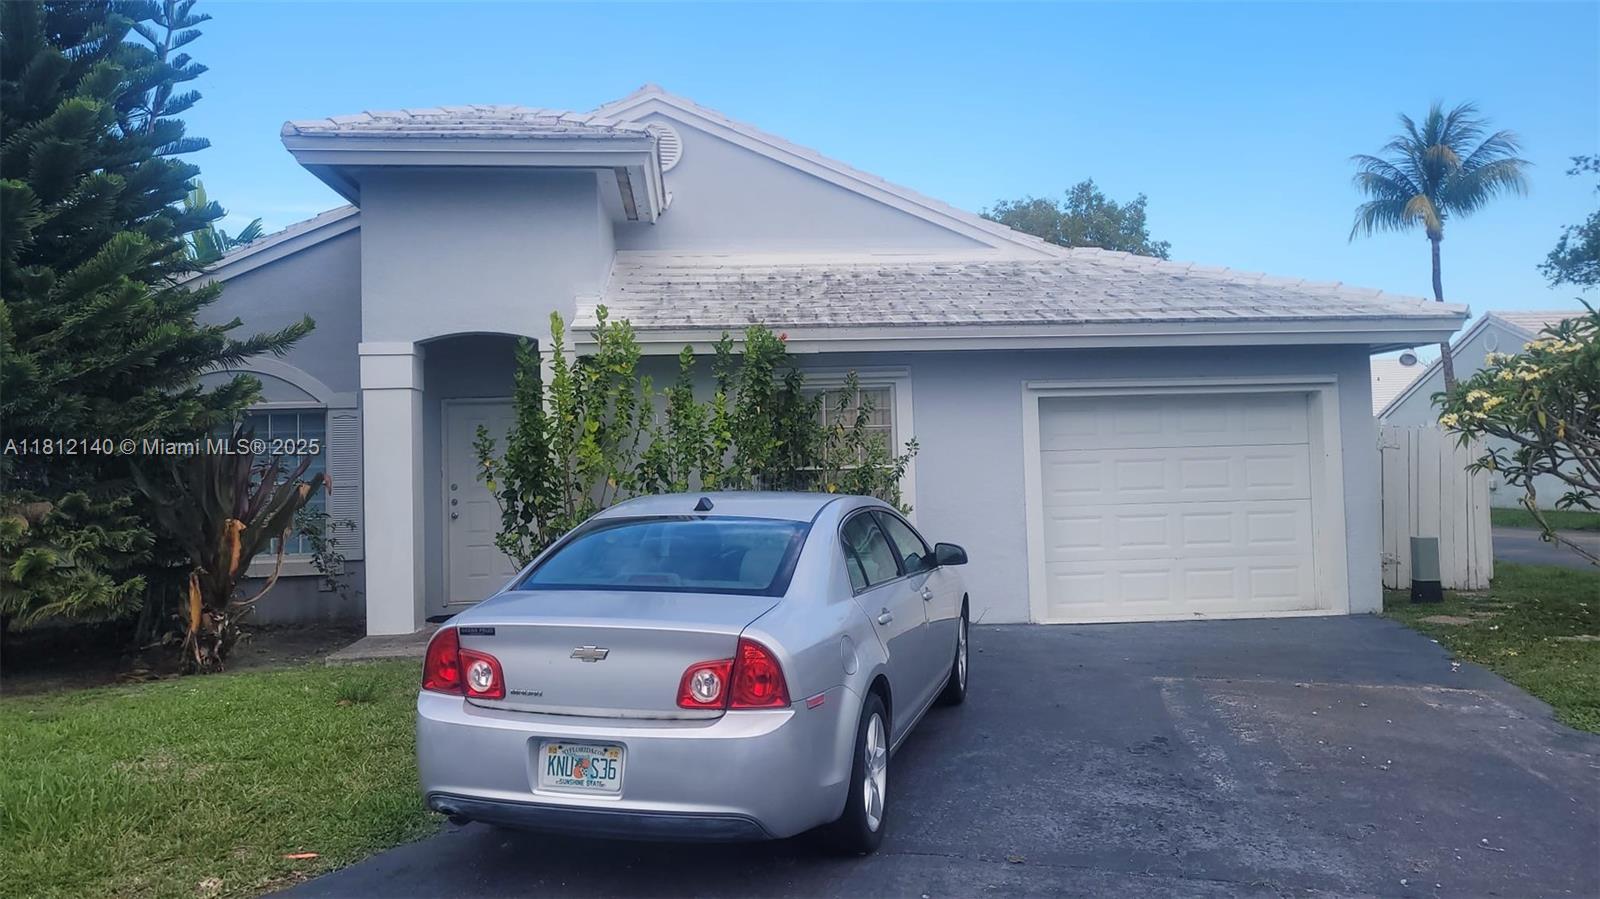
Active
$625,000
3
bds
|
2
ba
|
1,367
sqft
|
built
1980
20620 SW 120th Pl, Miami, FL 33177
$-1,160
Cash flow
-9.7%
Cash-on-Cash Return
4.1%
Cap rate
0.5%
Rent to Value Ratio
Active
$240,000
1
bds
|
1
ba
|
699
sqft
|
built
1971
9143 SW 77th Ave, Miami, FL 33156
$-800
Cash flow
-17.4%
Cash-on-Cash Return
2.3%
Cap rate
0.8%
Rent to Value Ratio