Miami, FL Investment Properties for Sale
Browse homes for sale and investment properties in Miami, FL. Refine your search by price, property type, or more.
Best cash flowing properties in Miami, FL

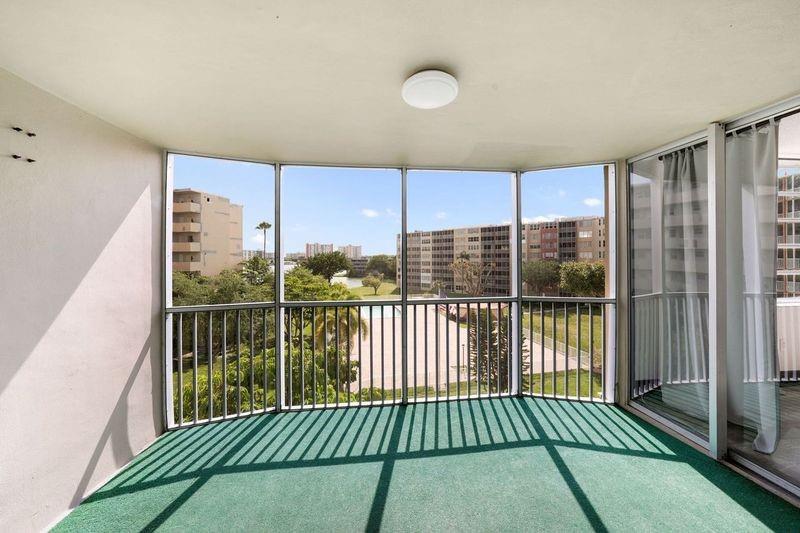
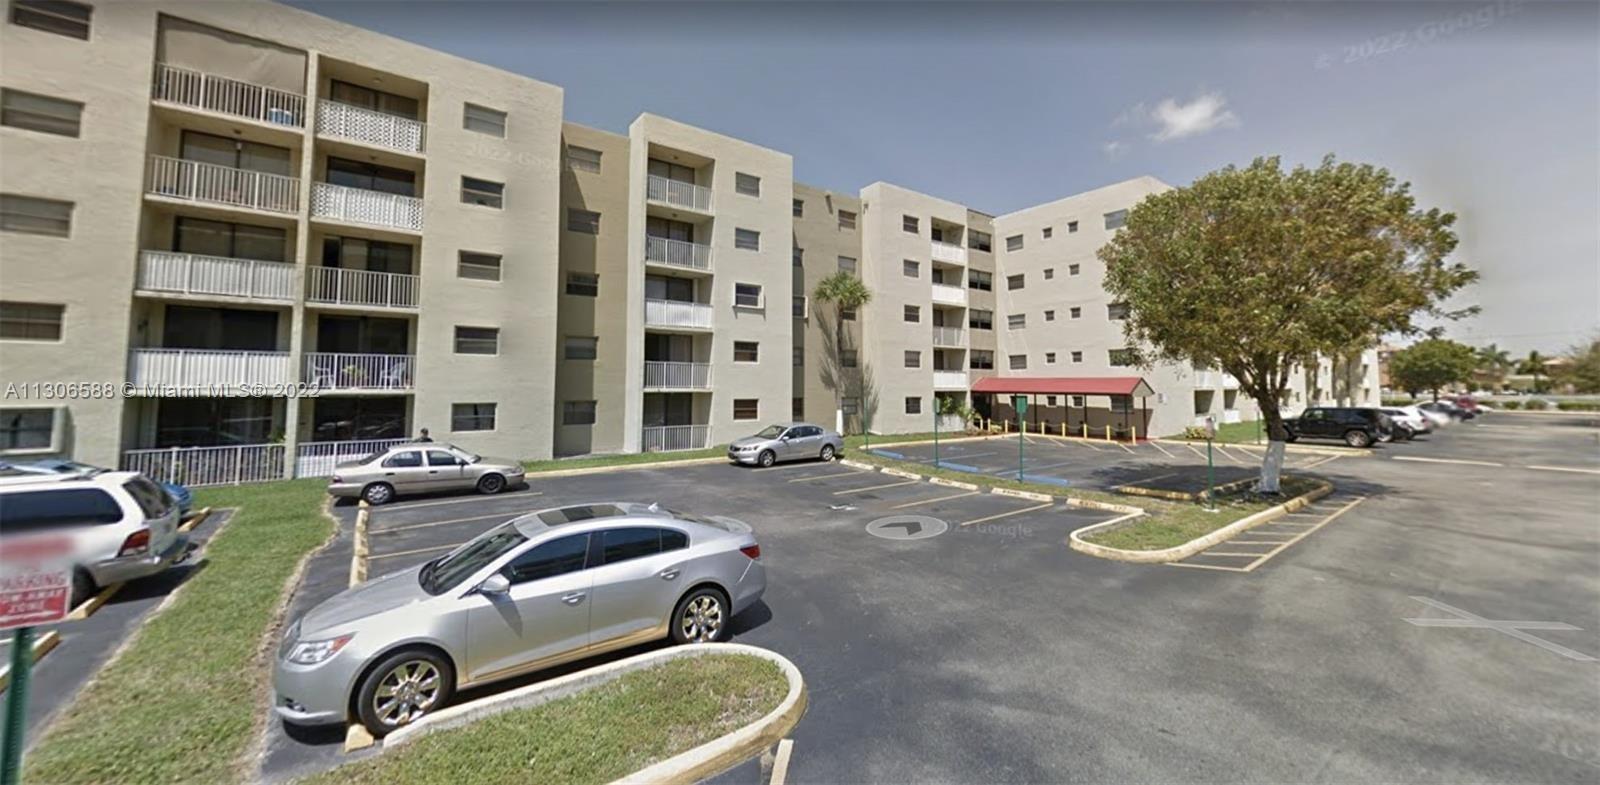
Active under contract
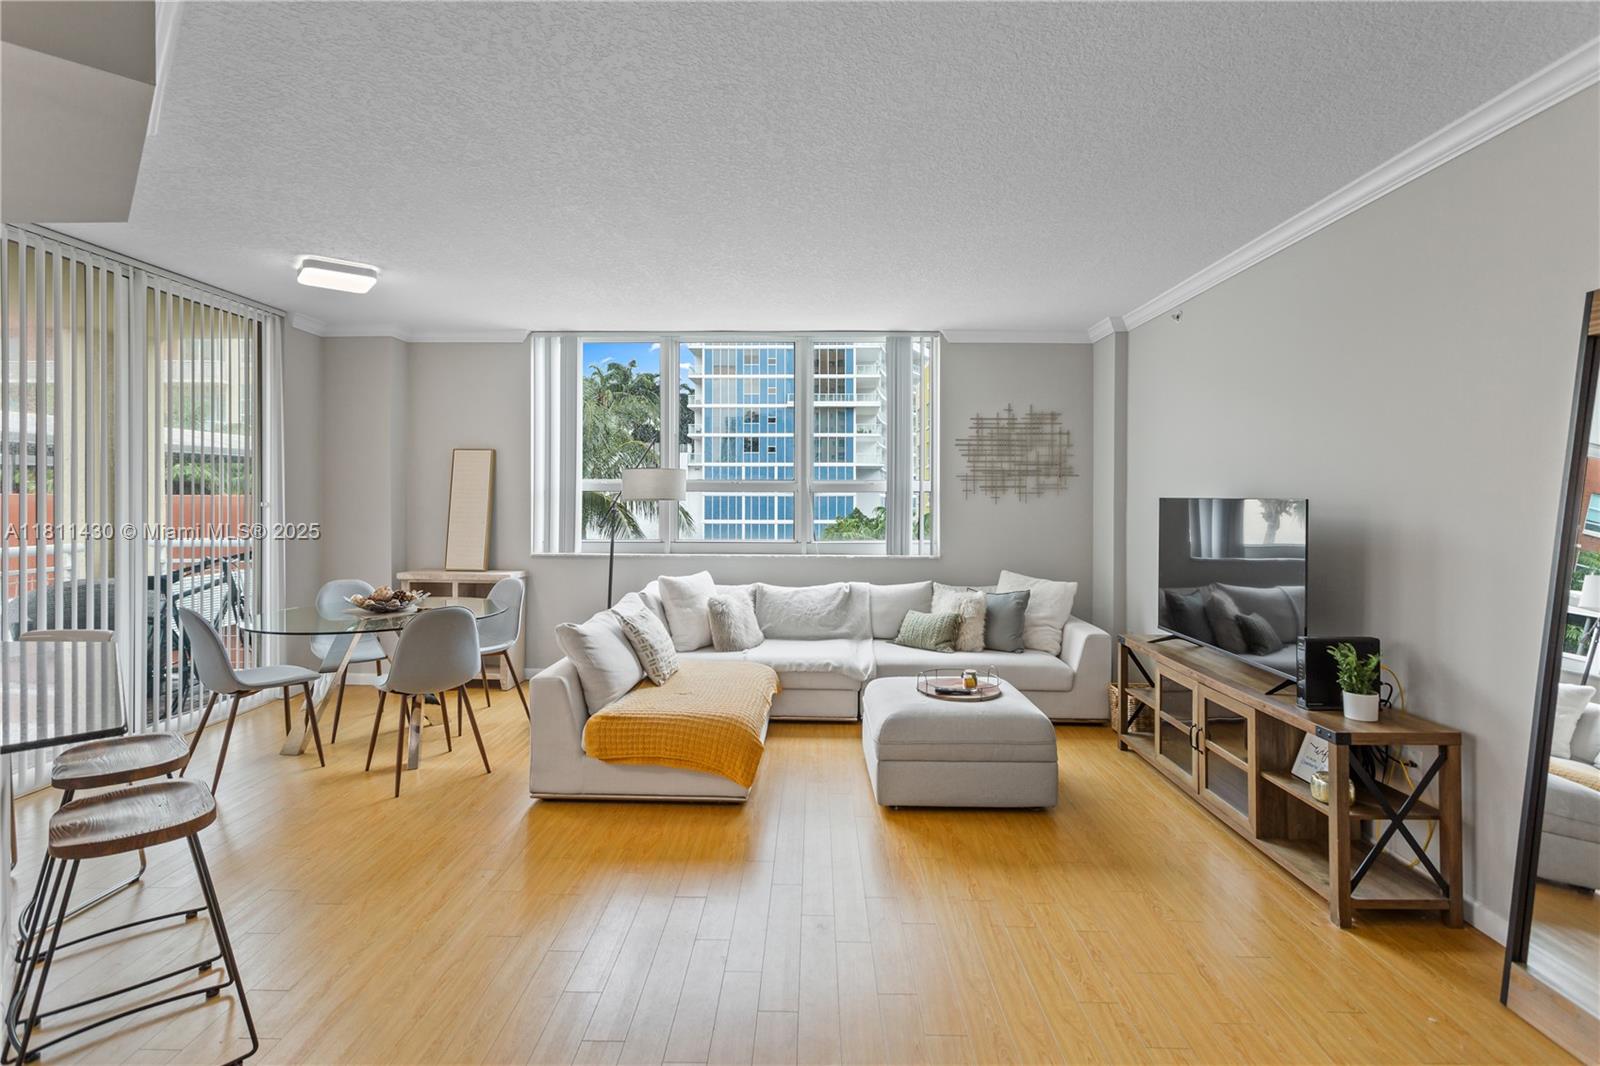
$250,000
2
bds
|
2
ba
|
1,092
sqft
|
built
1982
325 NW 72nd Ave, Miami, FL 33126
$-161
Cash flow
-3.4%
Cash-on-Cash Return
5.4%
Cap rate
0.9%
Rent to Value Ratio
Active
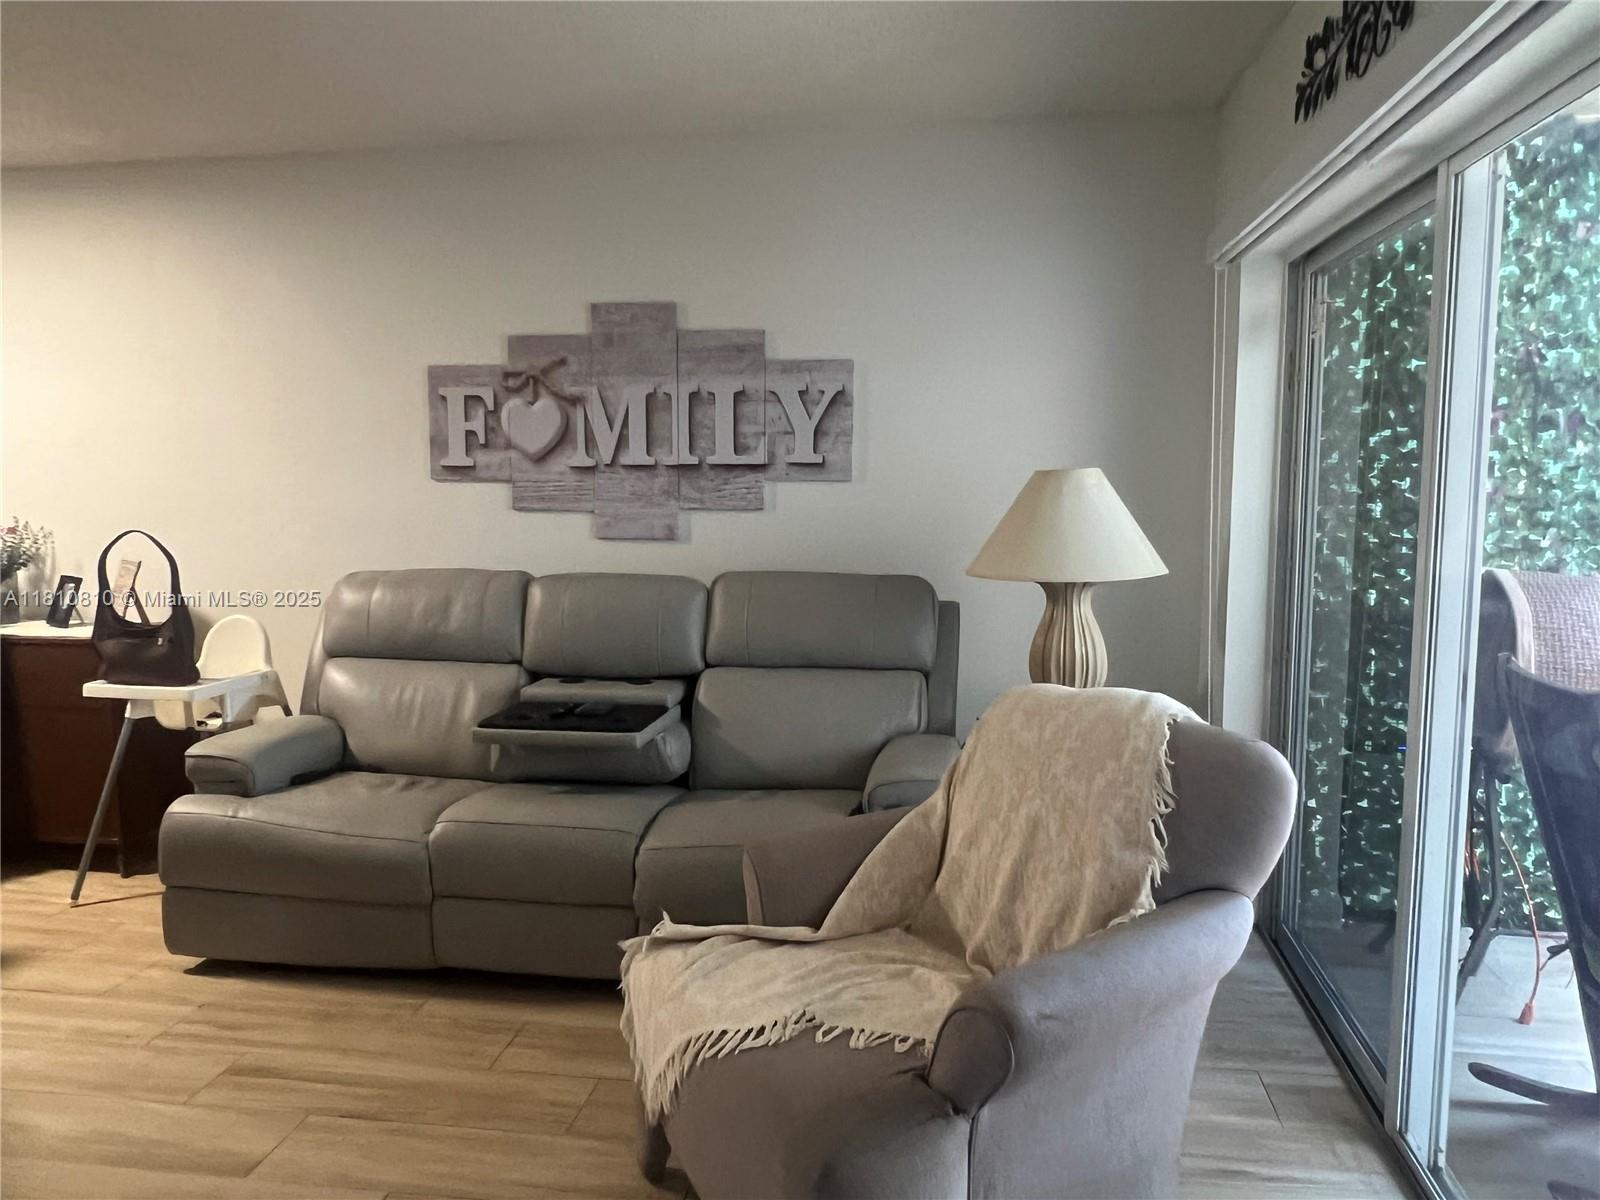
$189,900
2
bds
|
2
ba
|
1,317
sqft
|
built
1970
1750 NE 191st St, Miami, FL 33179
$-341
Cash flow
-9.4%
Cash-on-Cash Return
4.0%
Cap rate
1.2%
Rent to Value Ratio
6,208 out of 7,048 properties for sale in Miami, FL
Limited Results Shown
Create a free account, or log in to reveal all property listings and enjoy the complete experience.
Active
$625,000
3
bds
|
2
ba
|
1,367
sqft
|
built
1980
20620 SW 120th Pl, Miami, FL 33177
$-1,089
Cash flow
-9.1%
Cash-on-Cash Return
4.1%
Cap rate
0.5%
Rent to Value Ratio
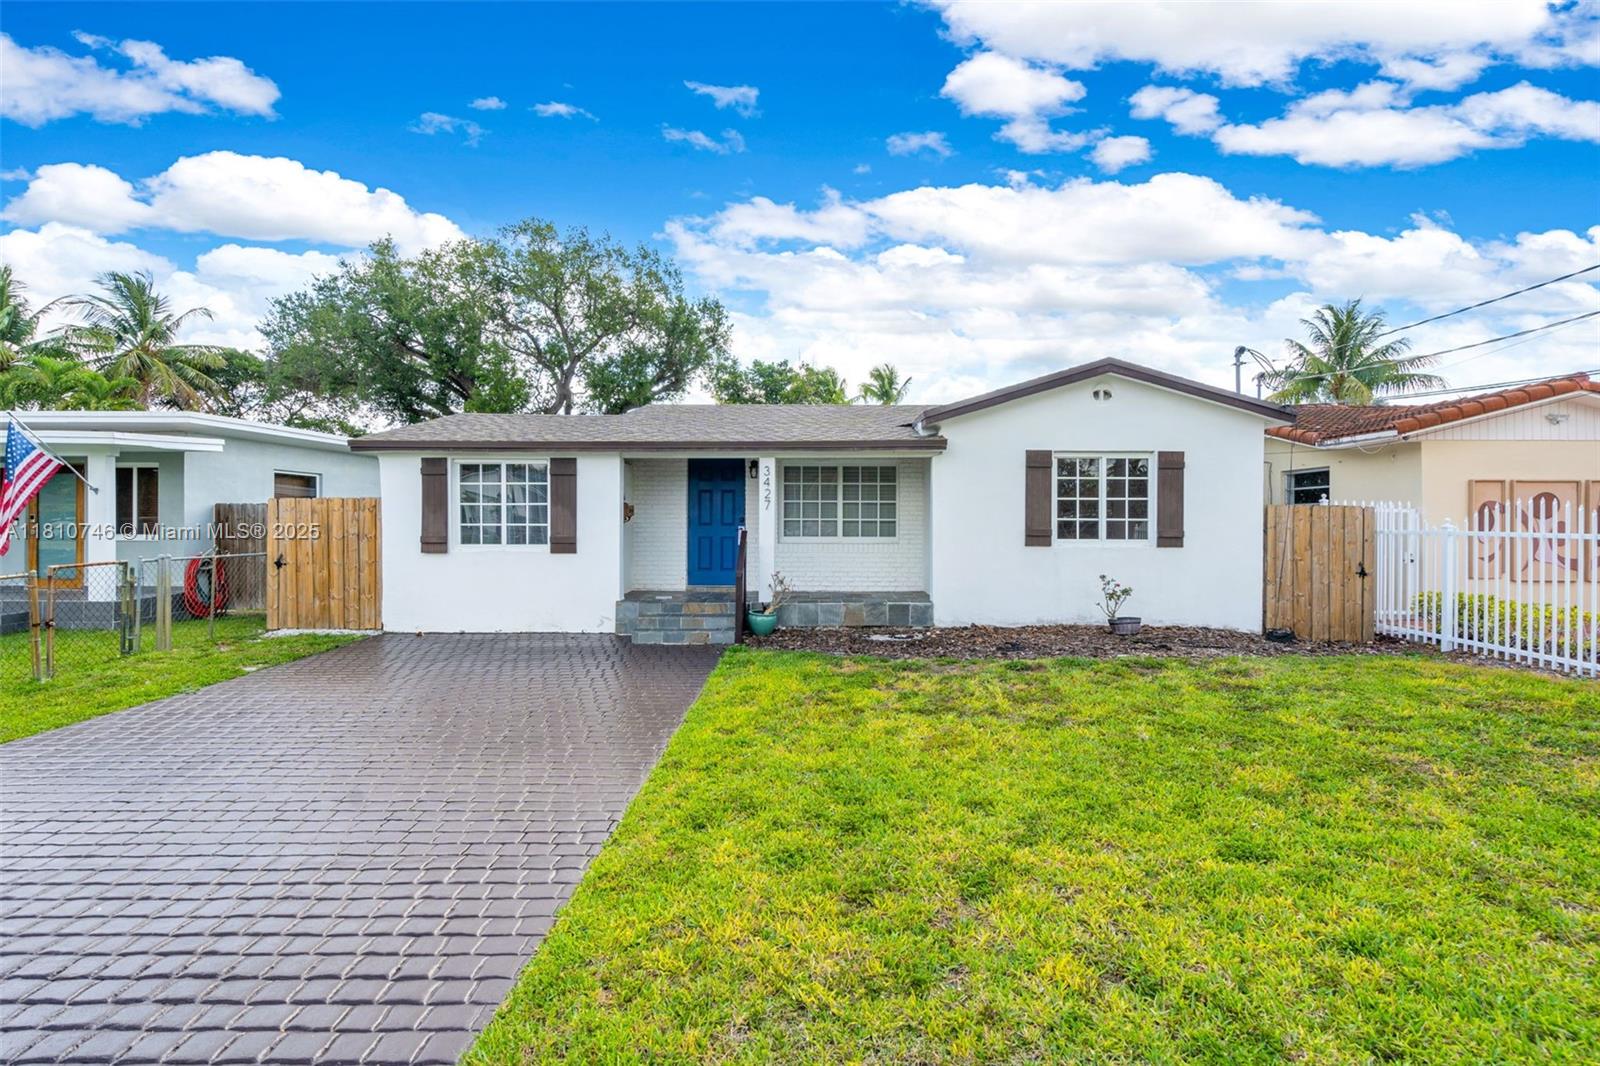
Active
$699,999
2
bds
|
1
ba
|
1,194
sqft
|
built
1949
3427 SW 64th Ave, Miami, FL 33155
$-1,723
Cash flow
-12.8%
Cash-on-Cash Return
3.2%
Cap rate
0.6%
Rent to Value Ratio
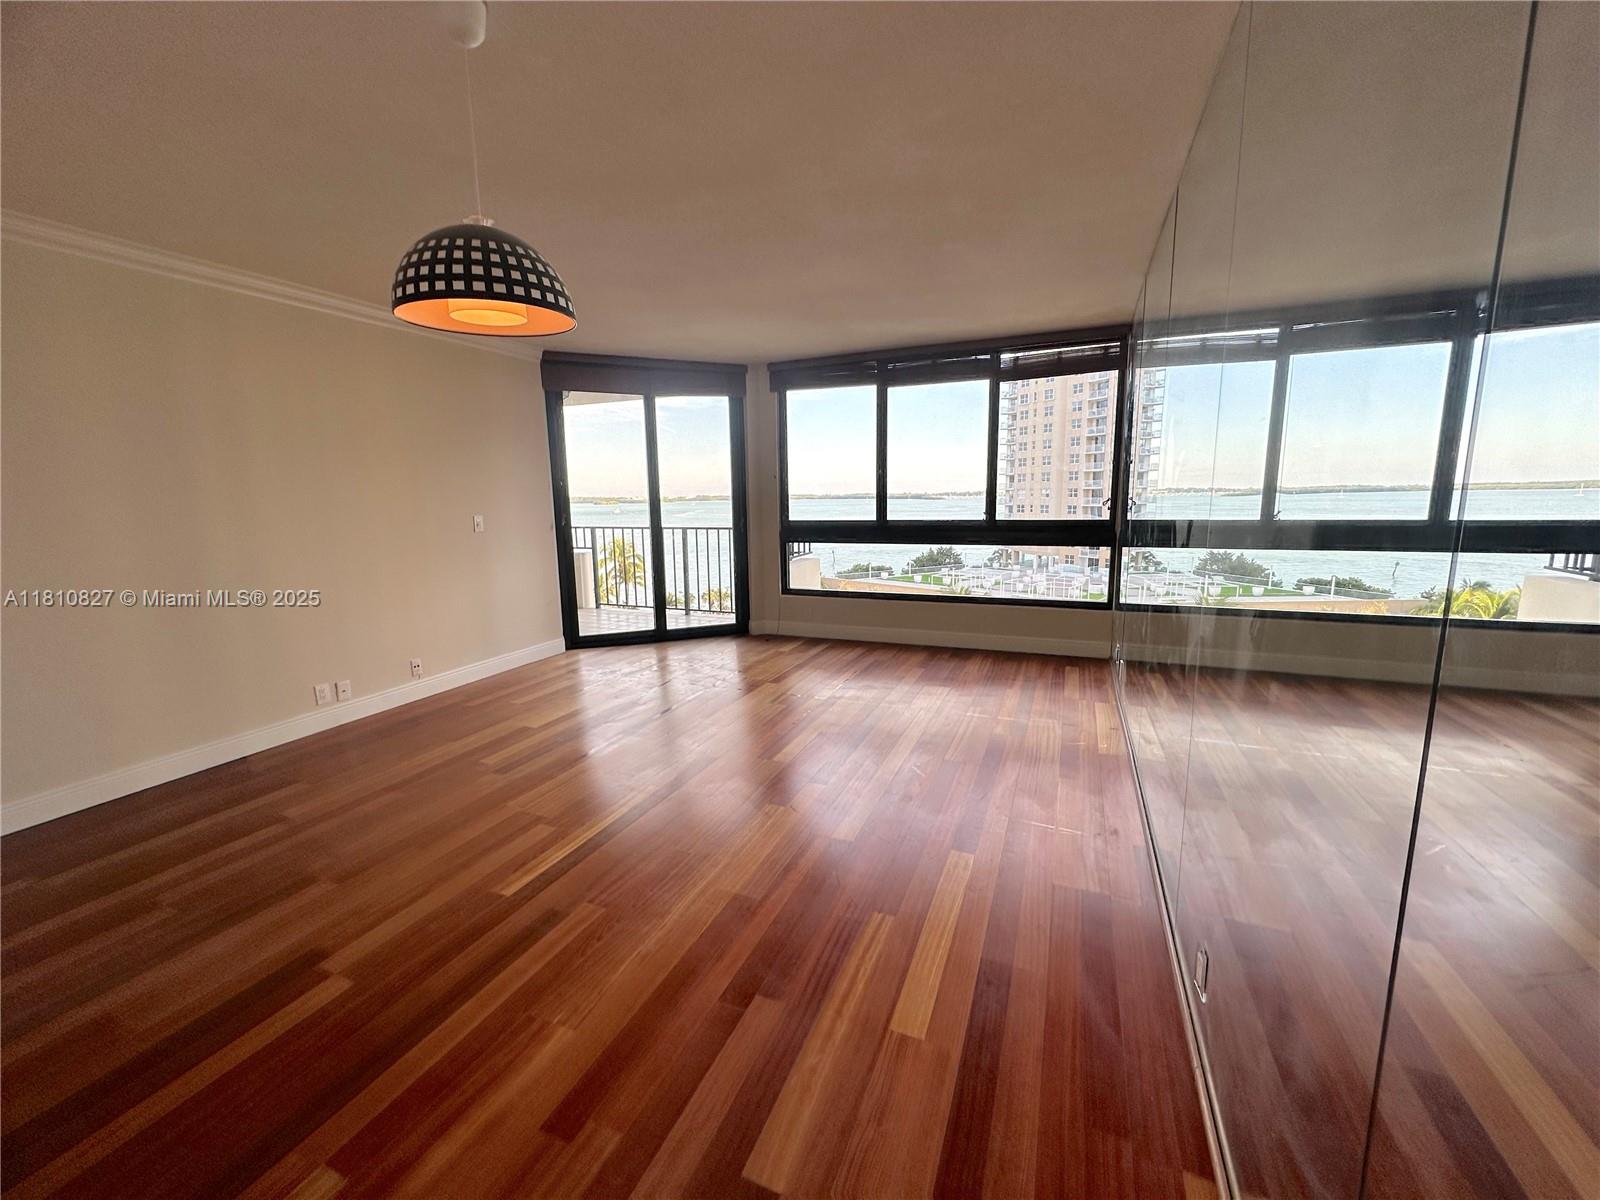
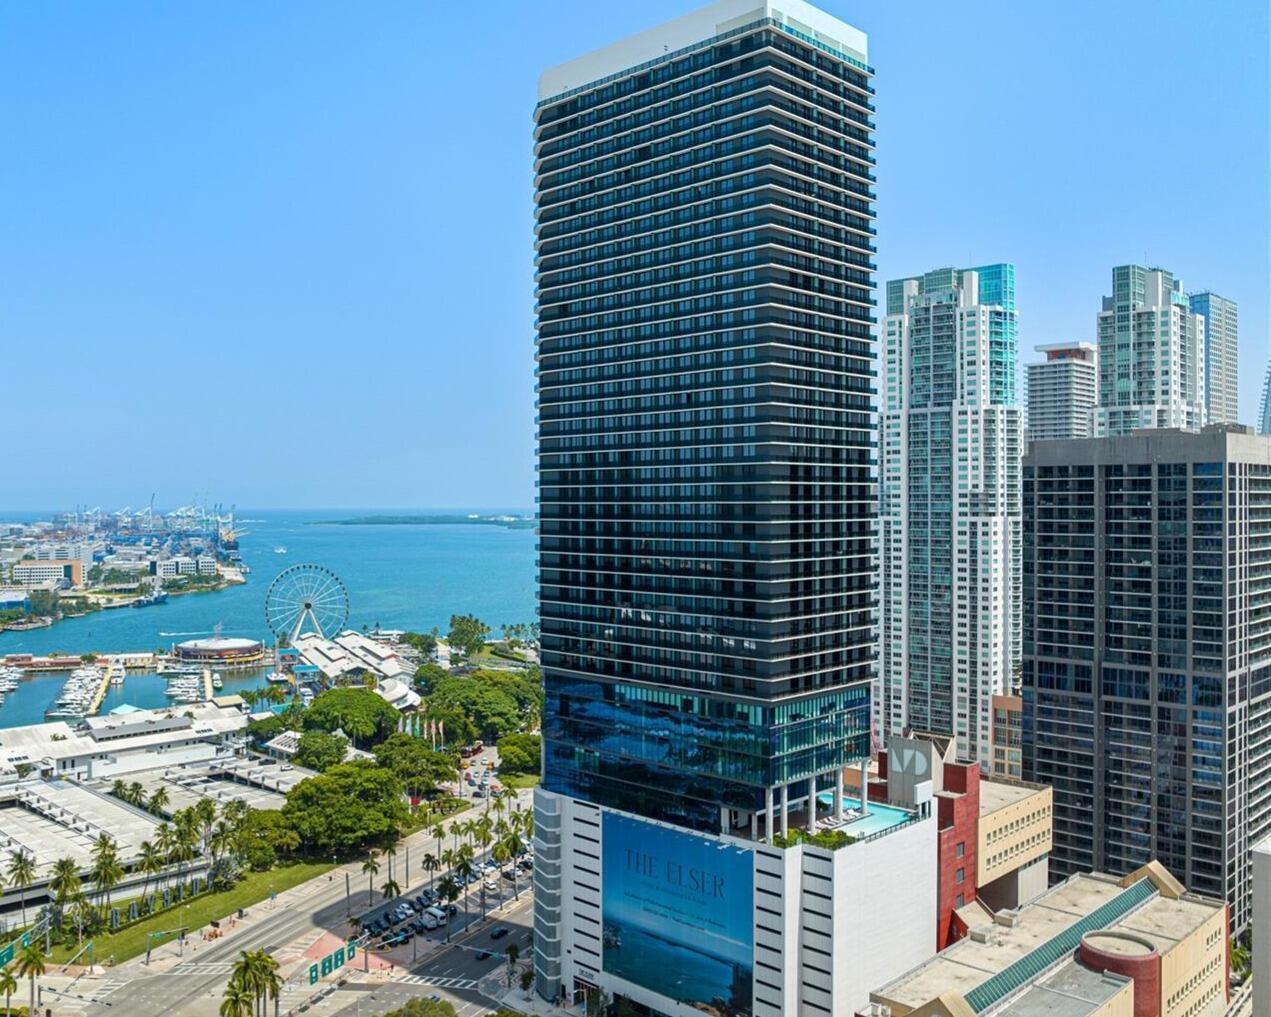
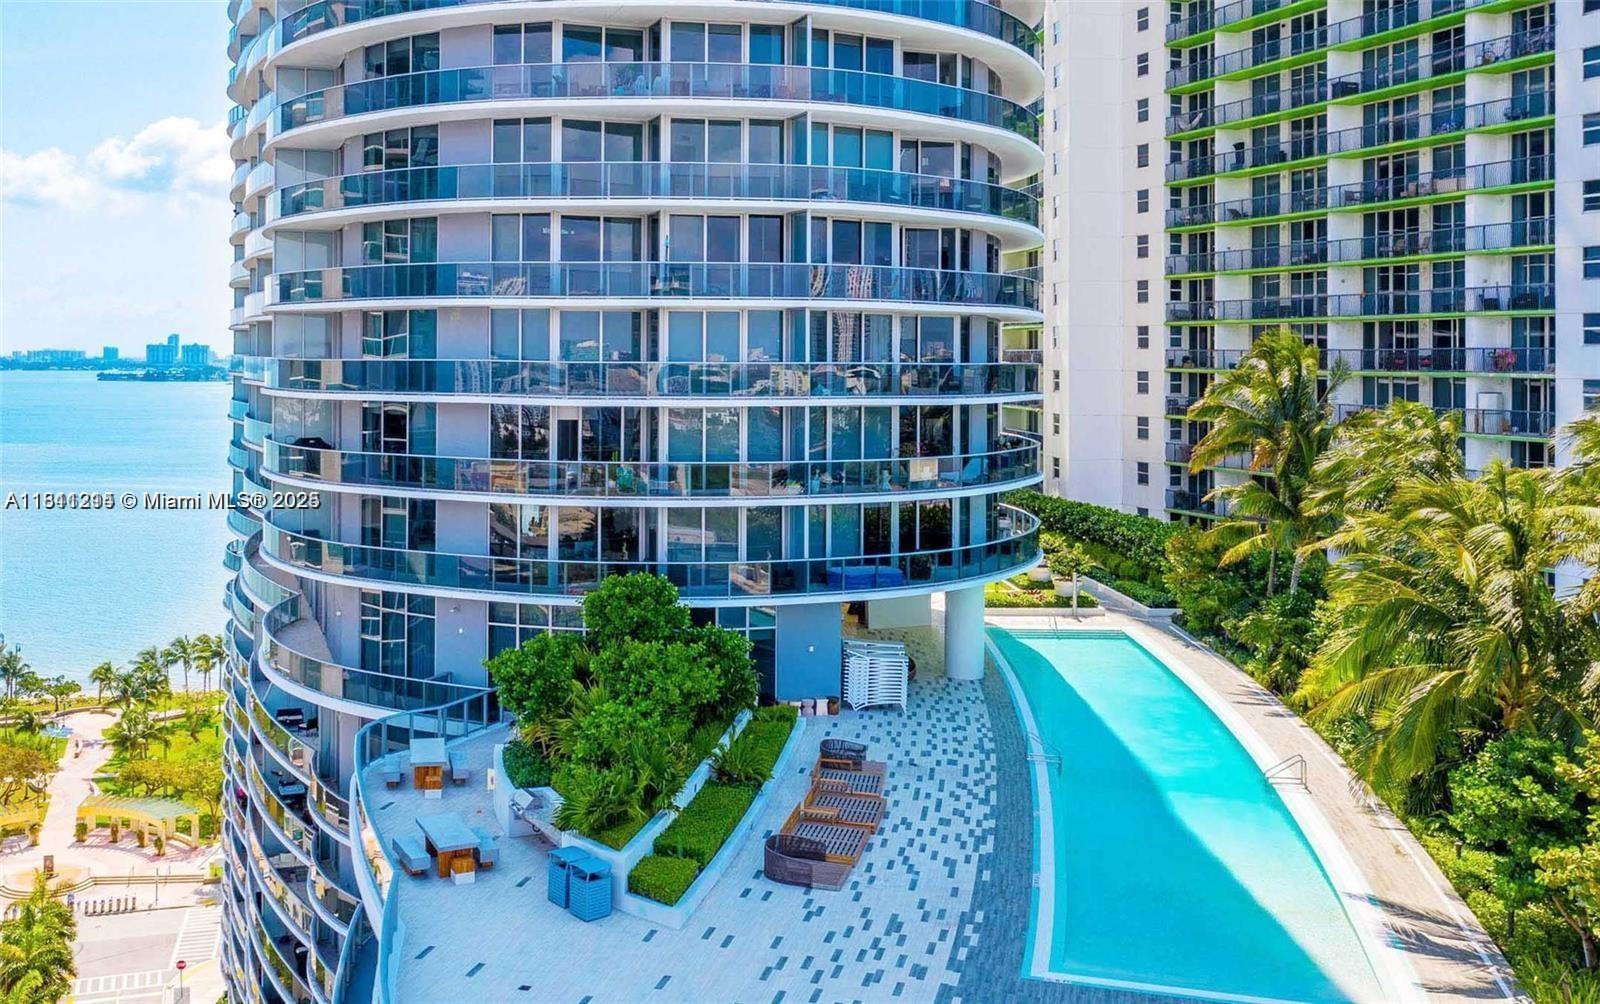
Active
$440,000
1
bds
|
2
ba
|
820
sqft
|
built
1982
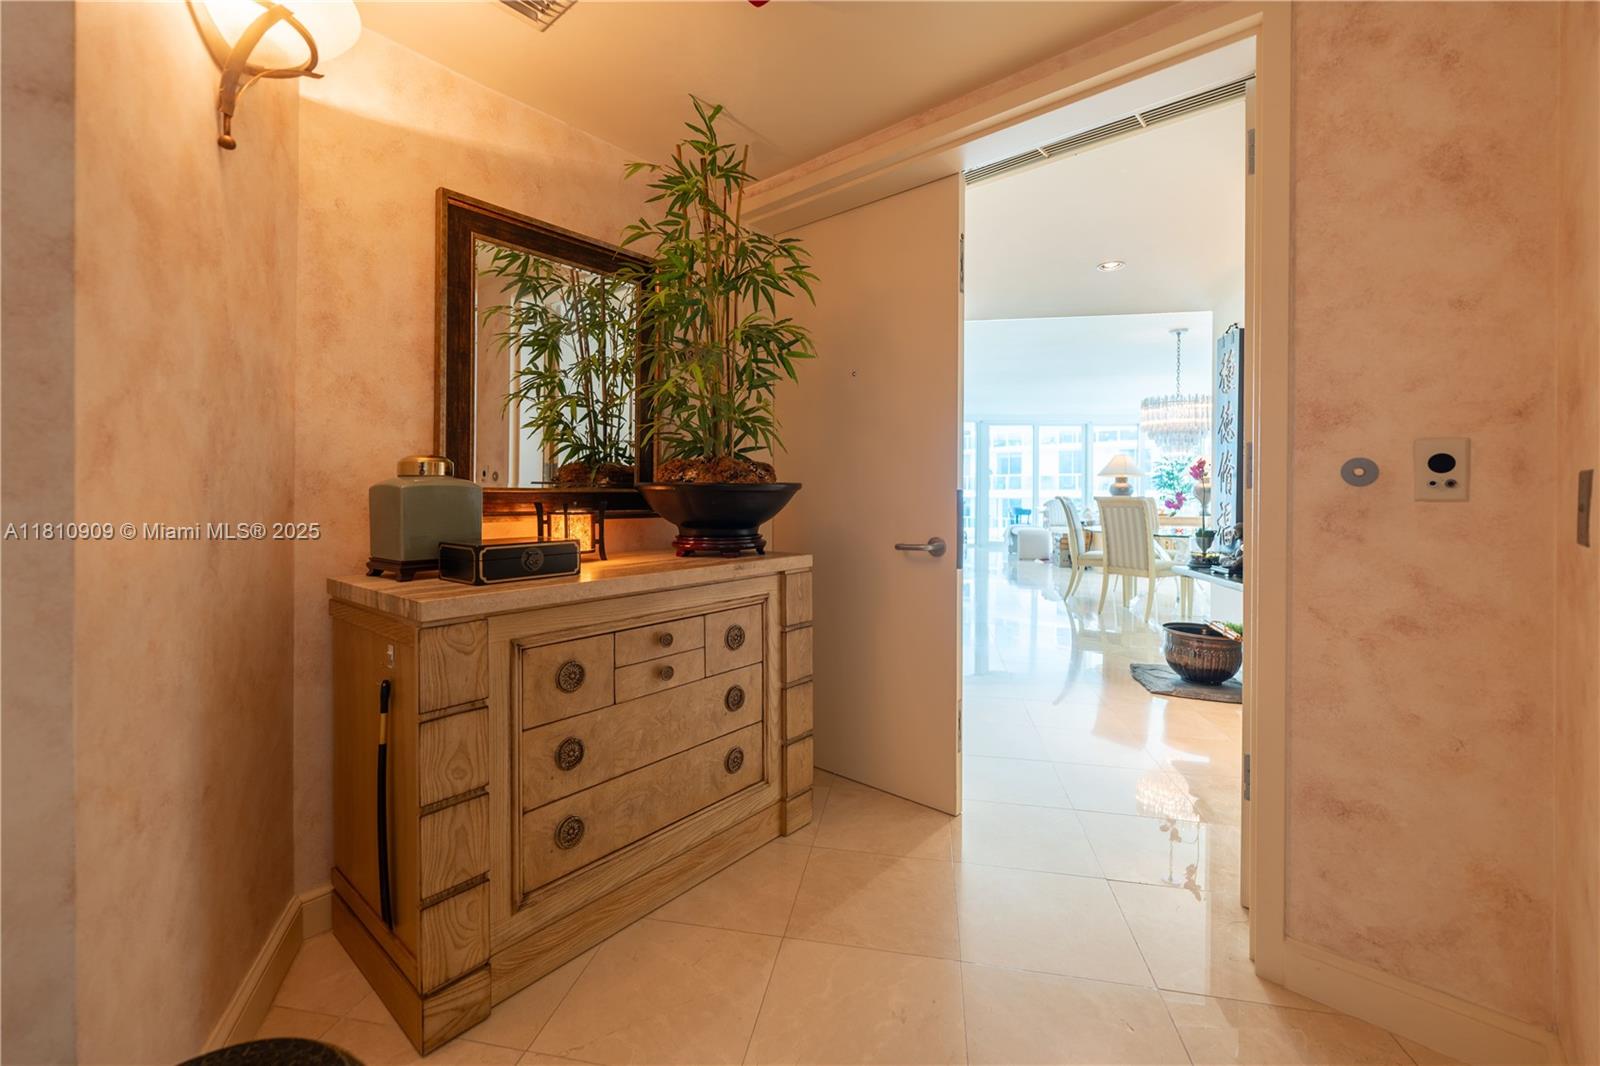
520 Brickell Key Dr, Miami, FL 33131
$-1,612
Cash flow
-19.1%
Cash-on-Cash Return
1.8%
Cap rate
0.7%
Rent to Value Ratio
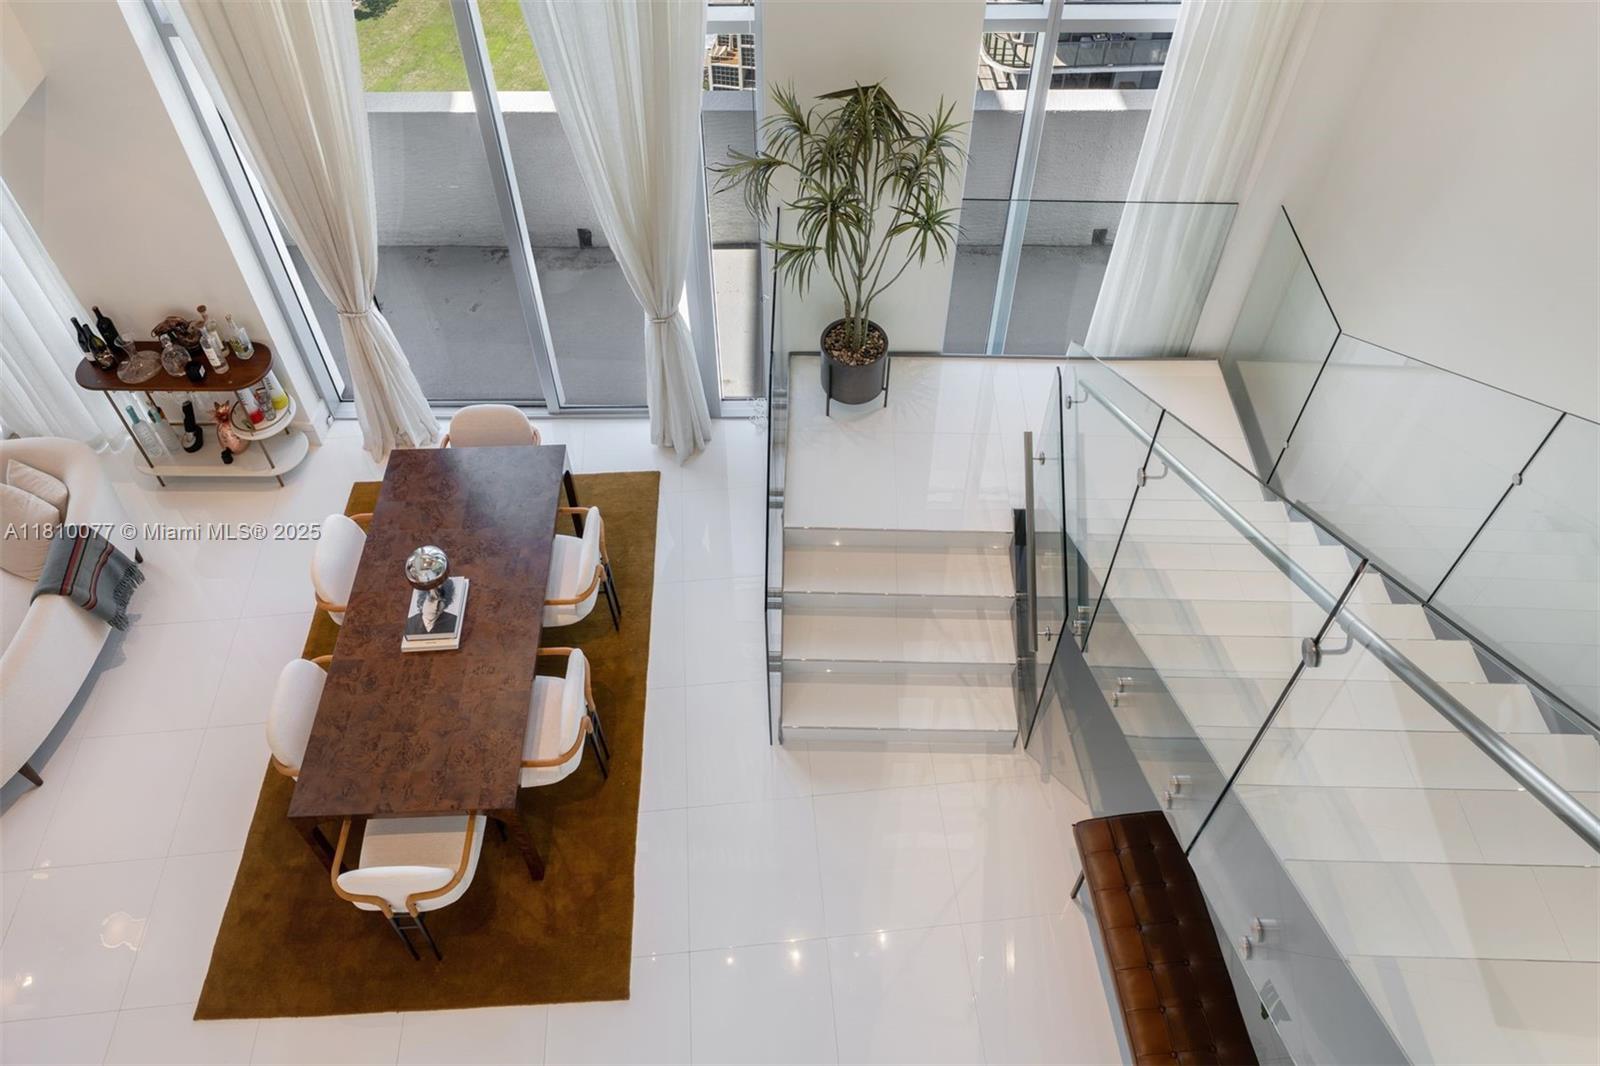
Active
$1,975,000
3
bds
|
3
ba
|
1,900
sqft
|
built
2006
725 NE 22nd St, Miami, FL 33137
$-7,268
Cash flow
-19.2%
Cash-on-Cash Return
1.7%
Cap rate
0.5%
Rent to Value Ratio
Active
$379,900
2
bds
|
2
ba
|
914
sqft
|
built
1989
850 N Miami Ave, Miami, FL 33136
$-1,241
Cash flow
-17.0%
Cash-on-Cash Return
2.2%
Cap rate
0.8%
Rent to Value Ratio
Active
$415,000
3
bds
|
1
ba
|
879
sqft
|
built
1952
12245 NW 17th Ct, Miami, FL 33167
$-450
Cash flow
-5.7%
Cash-on-Cash Return
4.8%
Cap rate
0.7%
Rent to Value Ratio
Active
$950,000
5
bds
|
0
ba
|
2,060
sqft
|
built
1924
1237 NW 33rd Ave, Miami, FL 33125
$-3,832
Cash flow
-21.0%
Cash-on-Cash Return
1.3%
Cap rate
0.3%
Rent to Value Ratio
Active
$890,000
6
bds
|
0
ba
|
2,120
sqft
|
built
1972
4147 NW 23rd Ct, Miami, FL 33142
$-2,627
Cash flow
-15.4%
Cash-on-Cash Return
2.6%
Cap rate
0.3%
Rent to Value Ratio
Active
$350,000
3
bds
|
2
ba
|
1,130
sqft
|
built
1979
8475 SW 156th Ct, Miami, FL 33193
$-877
Cash flow
-13.1%
Cash-on-Cash Return
3.1%
Cap rate
0.7%
Rent to Value Ratio
Active
$342,000
1
bds
|
2
ba
|
978
sqft
|
built
2008
253 NE 2nd St, Miami, FL 33132
$-1,410
Cash flow
-21.5%
Cash-on-Cash Return
1.2%
Cap rate
0.9%
Rent to Value Ratio
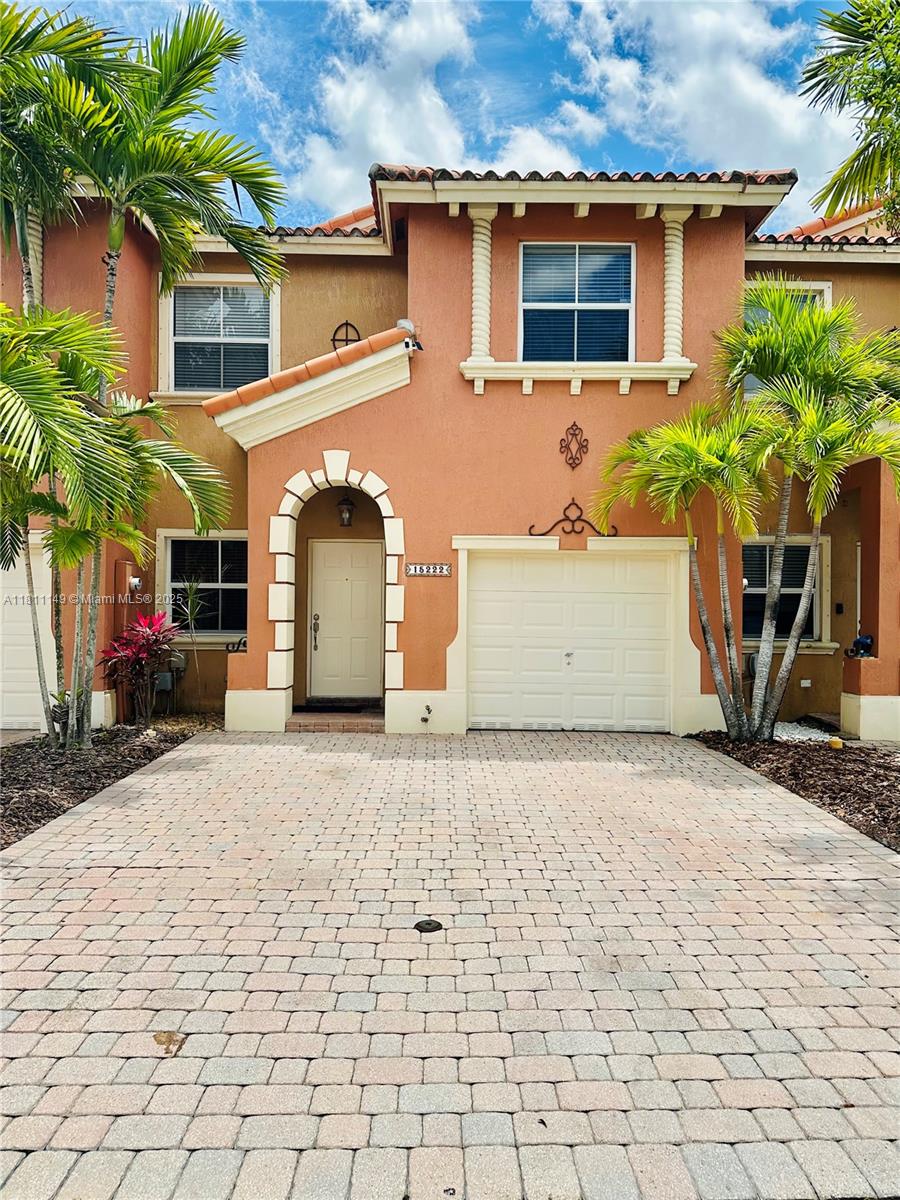
Active
$549,900
3
bds
|
3
ba
|
1,704
sqft
|
built
2003
15222 SW 30th Ter, Miami, FL 33185
$-1,263
Cash flow
-12.0%
Cash-on-Cash Return
3.4%
Cap rate
0.6%
Rent to Value Ratio
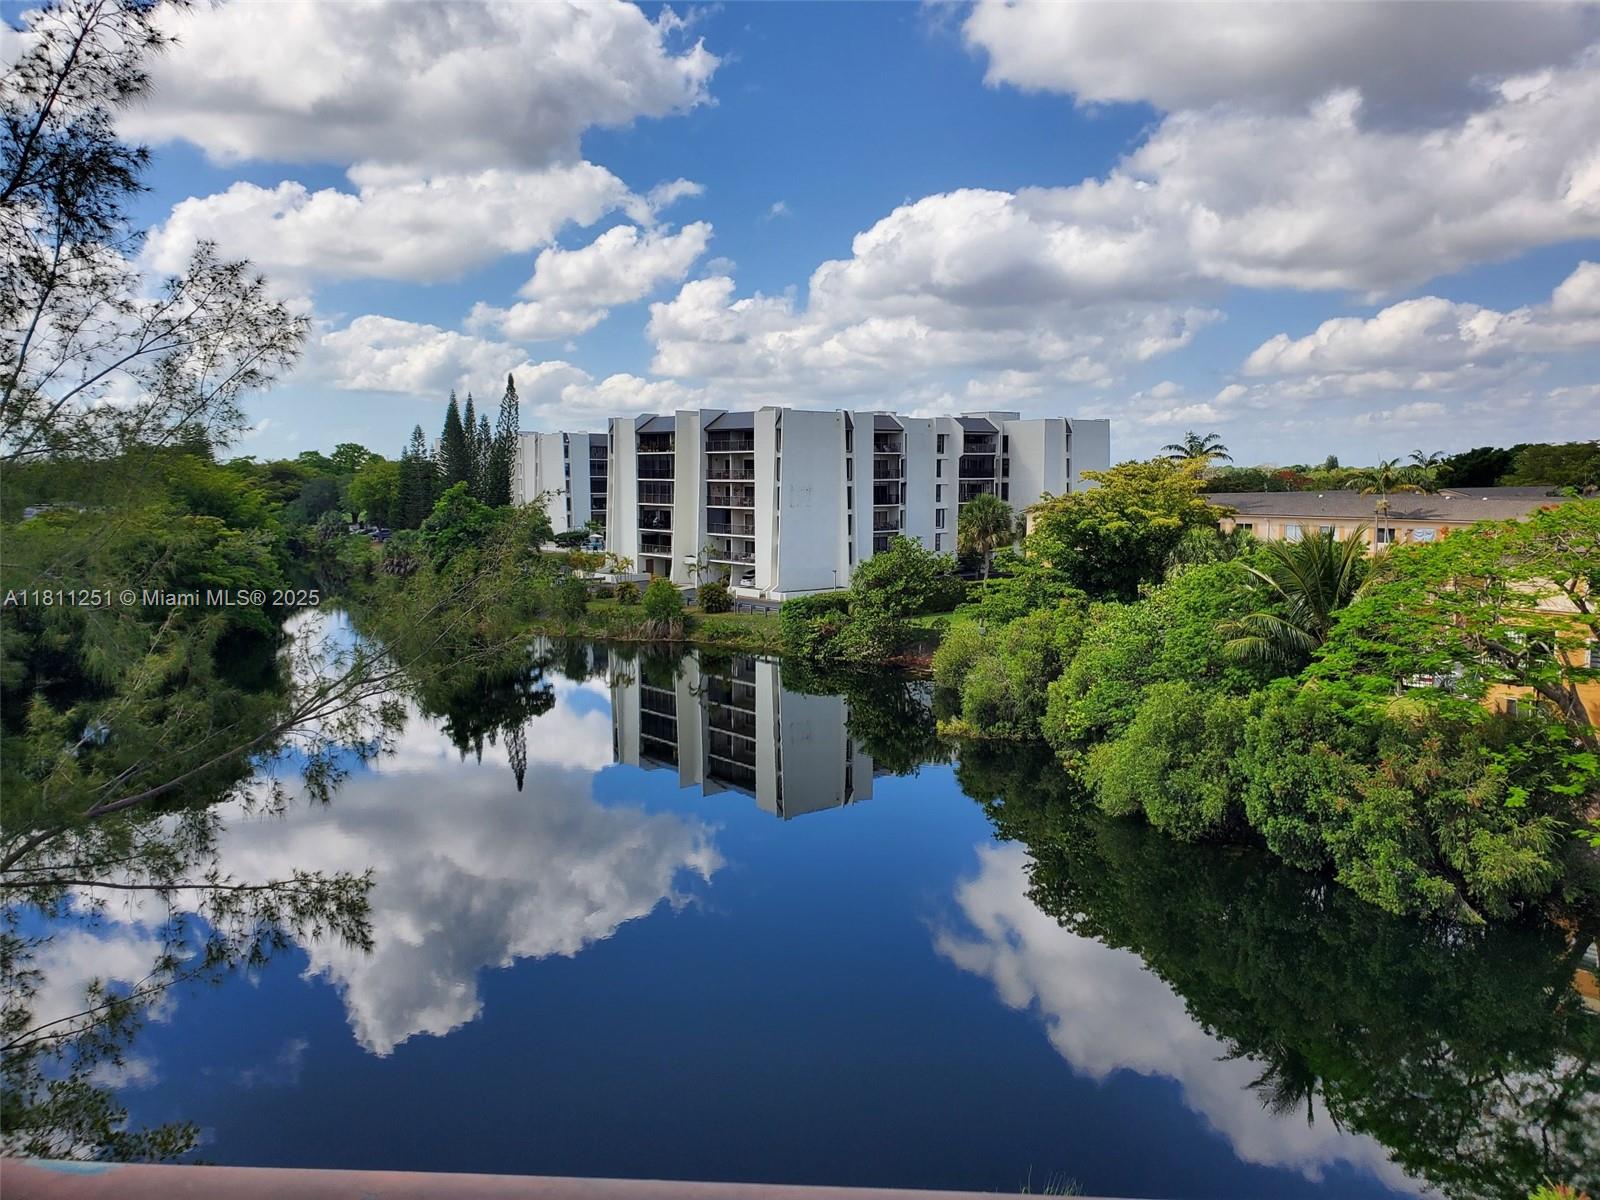
Active
$545,000
2
bds
|
2
ba
|
1,245
sqft
|
built
2002
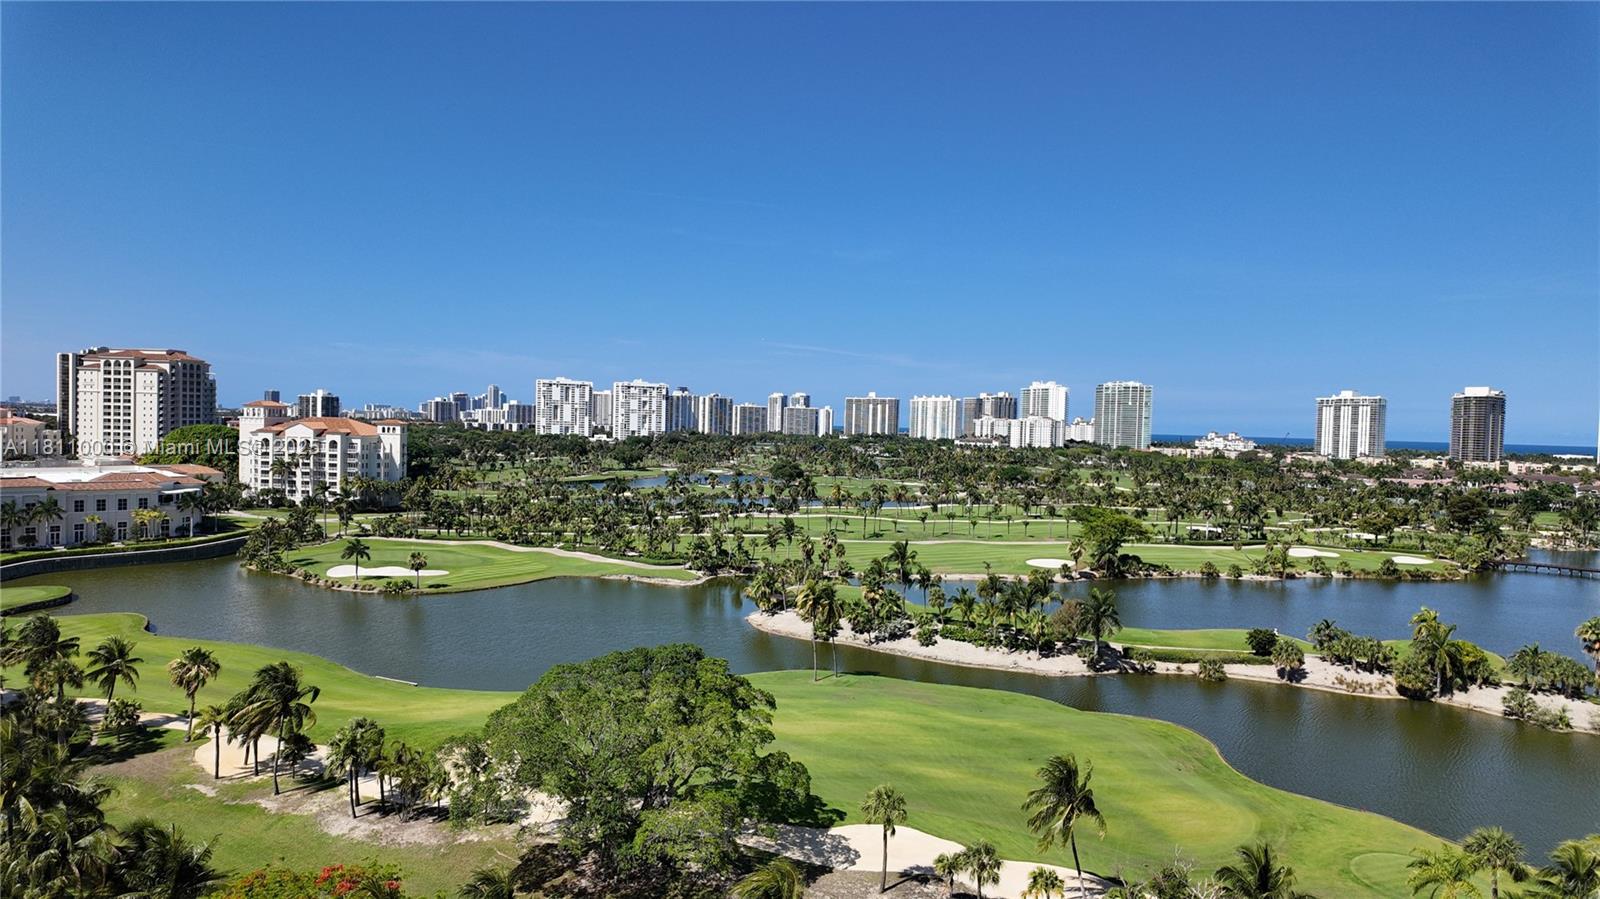
19501 E Country Club Dr, Miami, FL 33180
$-1,610
Cash flow
-15.4%
Cash-on-Cash Return
2.6%
Cap rate
0.7%
Rent to Value Ratio
Active
$2,125,000
2
bds
|
3
ba
|
2,070
sqft
|
built
1993
2127 Brickell Ave, Miami, FL 33129
$-9,831
Cash flow
-24.1%
Cash-on-Cash Return
0.6%
Cap rate
0.4%
Rent to Value Ratio
Active
$849,000
2
bds
|
2
ba
|
1,168
sqft
|
built
2008
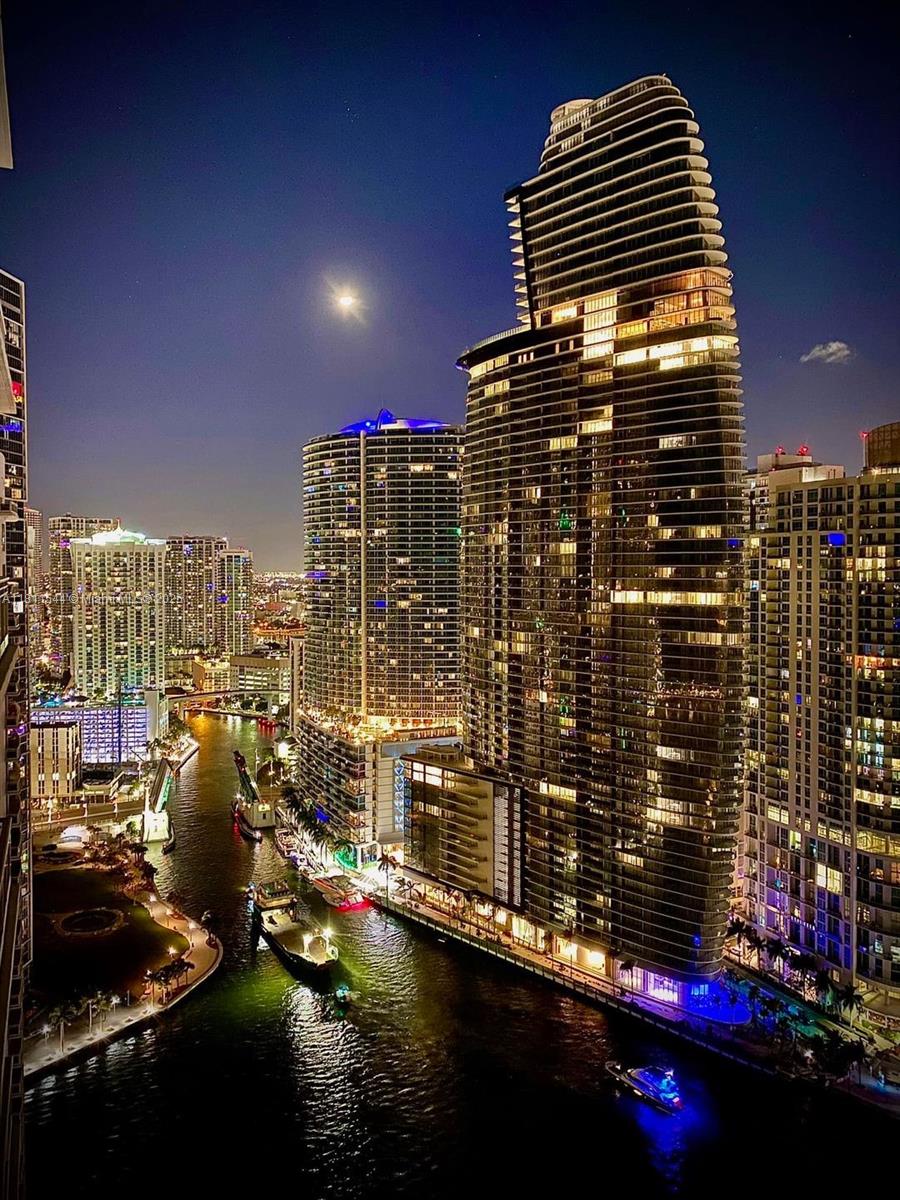
475 Brickell Ave, Miami, FL 33131
$-2,280
Cash flow
-14.0%
Cash-on-Cash Return
2.9%
Cap rate
0.7%
Rent to Value Ratio
Active
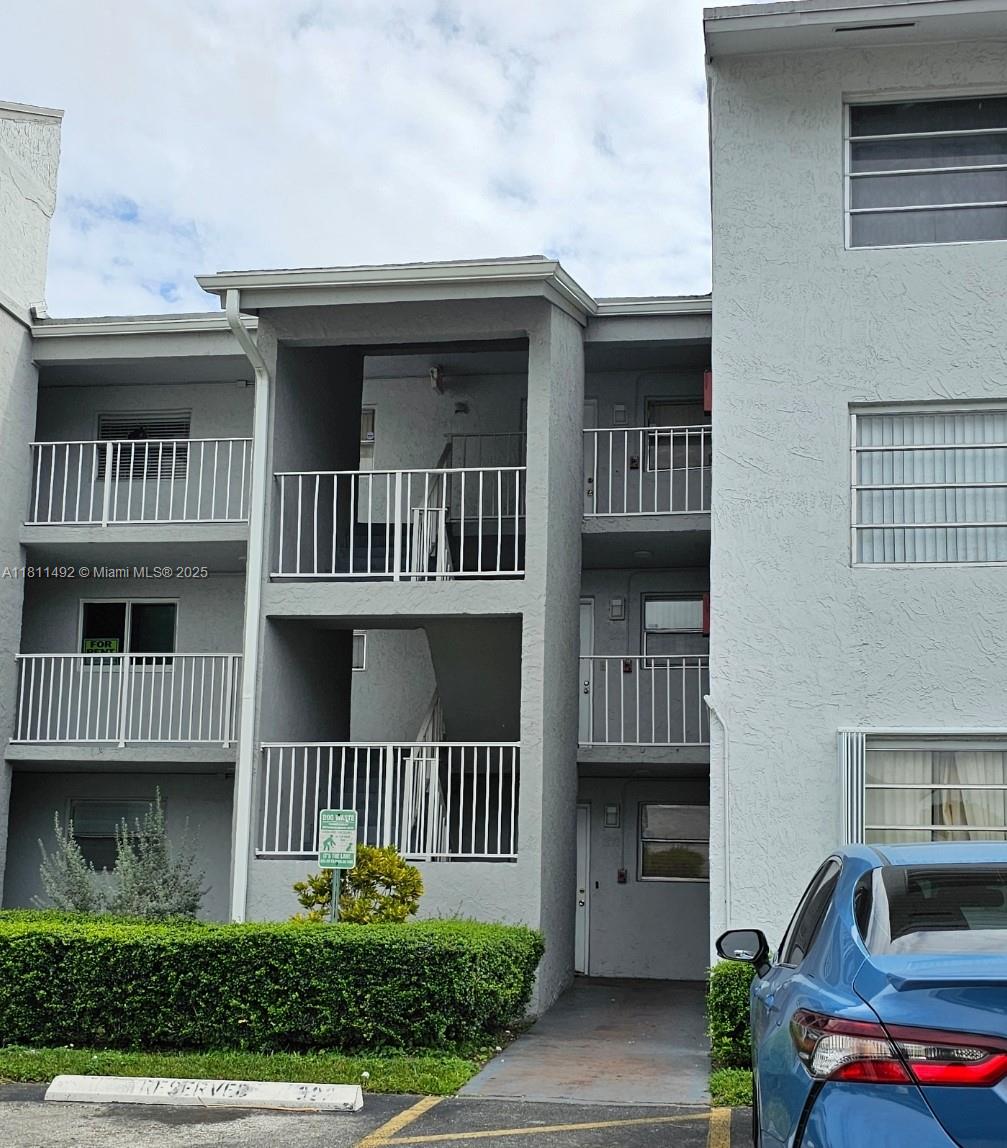
$189,900
2
bds
|
2
ba
|
1,317
sqft
|
built
1970
1750 NE 191st St, Miami, FL 33179
$-341
Cash flow
-9.4%
Cash-on-Cash Return
4.0%
Cap rate
1.2%
Rent to Value Ratio
Active
$439,000
3
bds
|
3
ba
|
1,320
sqft
|
built
2021
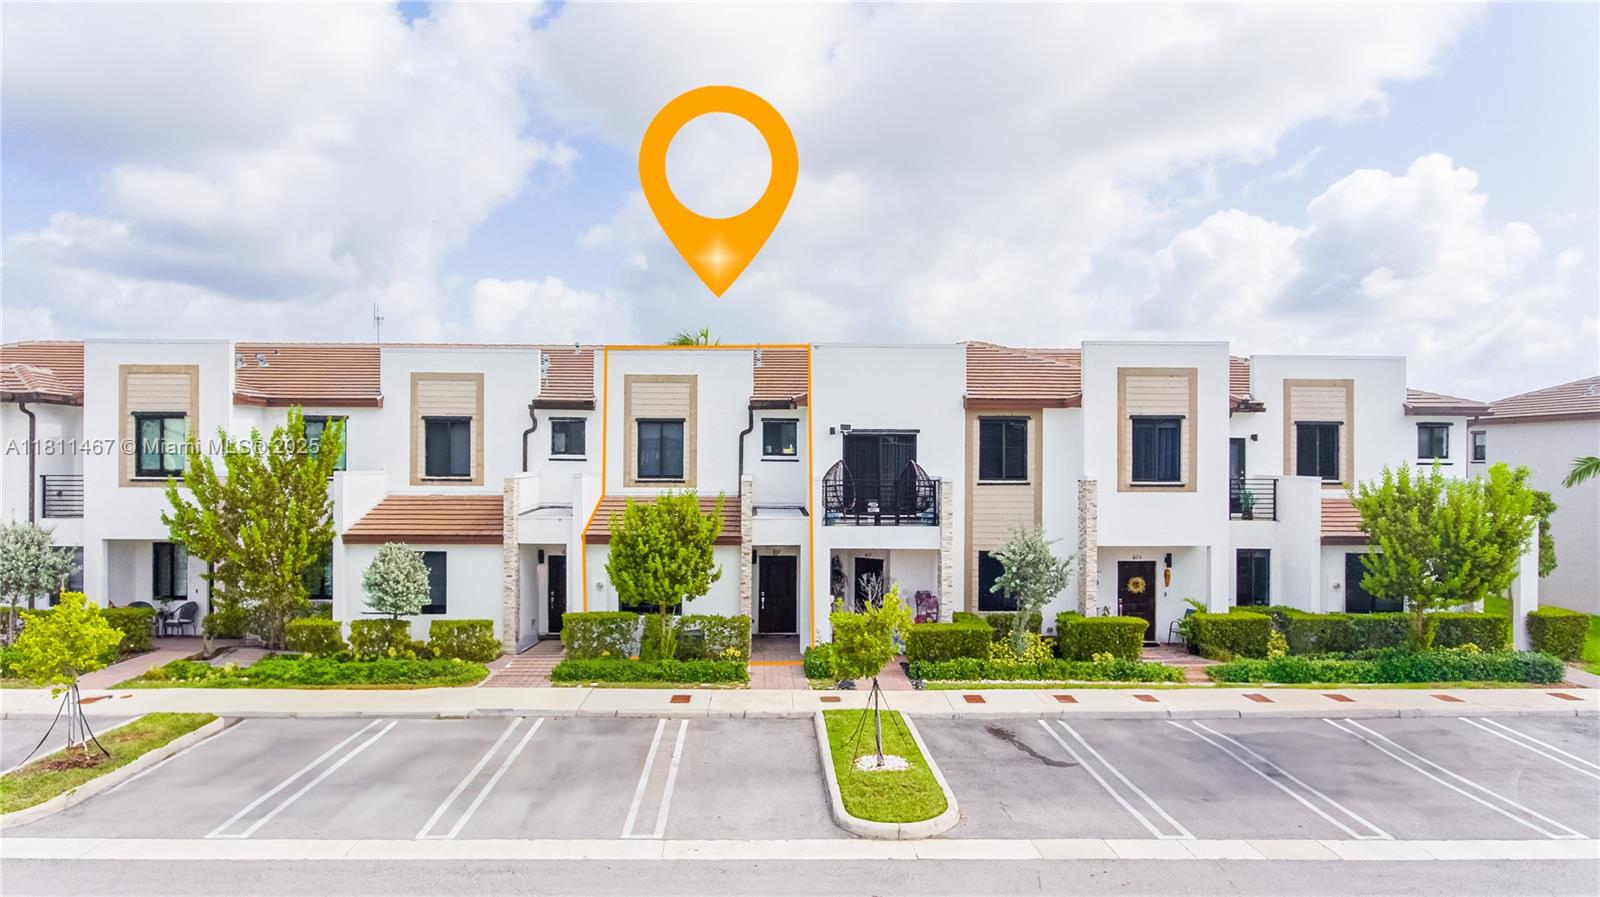
817 NE 211th St, Miami, FL 33179
$-1,328
Cash flow
-15.8%
Cash-on-Cash Return
2.5%
Cap rate
0.7%
Rent to Value Ratio
Active
$398,000
2
bds
|
1
ba
|
964
sqft
|
built
2004
2000 N Bayshore Dr, Miami, FL 33137
$-1,365
Cash flow
-17.9%
Cash-on-Cash Return
2.0%
Cap rate
0.7%
Rent to Value Ratio
Active
$335,000
3
bds
|
2
ba
|
1,120
sqft
|
built
2001
15711 SW 137th Ave, Miami, FL 33177
$-368
Cash flow
-5.7%
Cash-on-Cash Return
4.8%
Cap rate
0.8%
Rent to Value Ratio
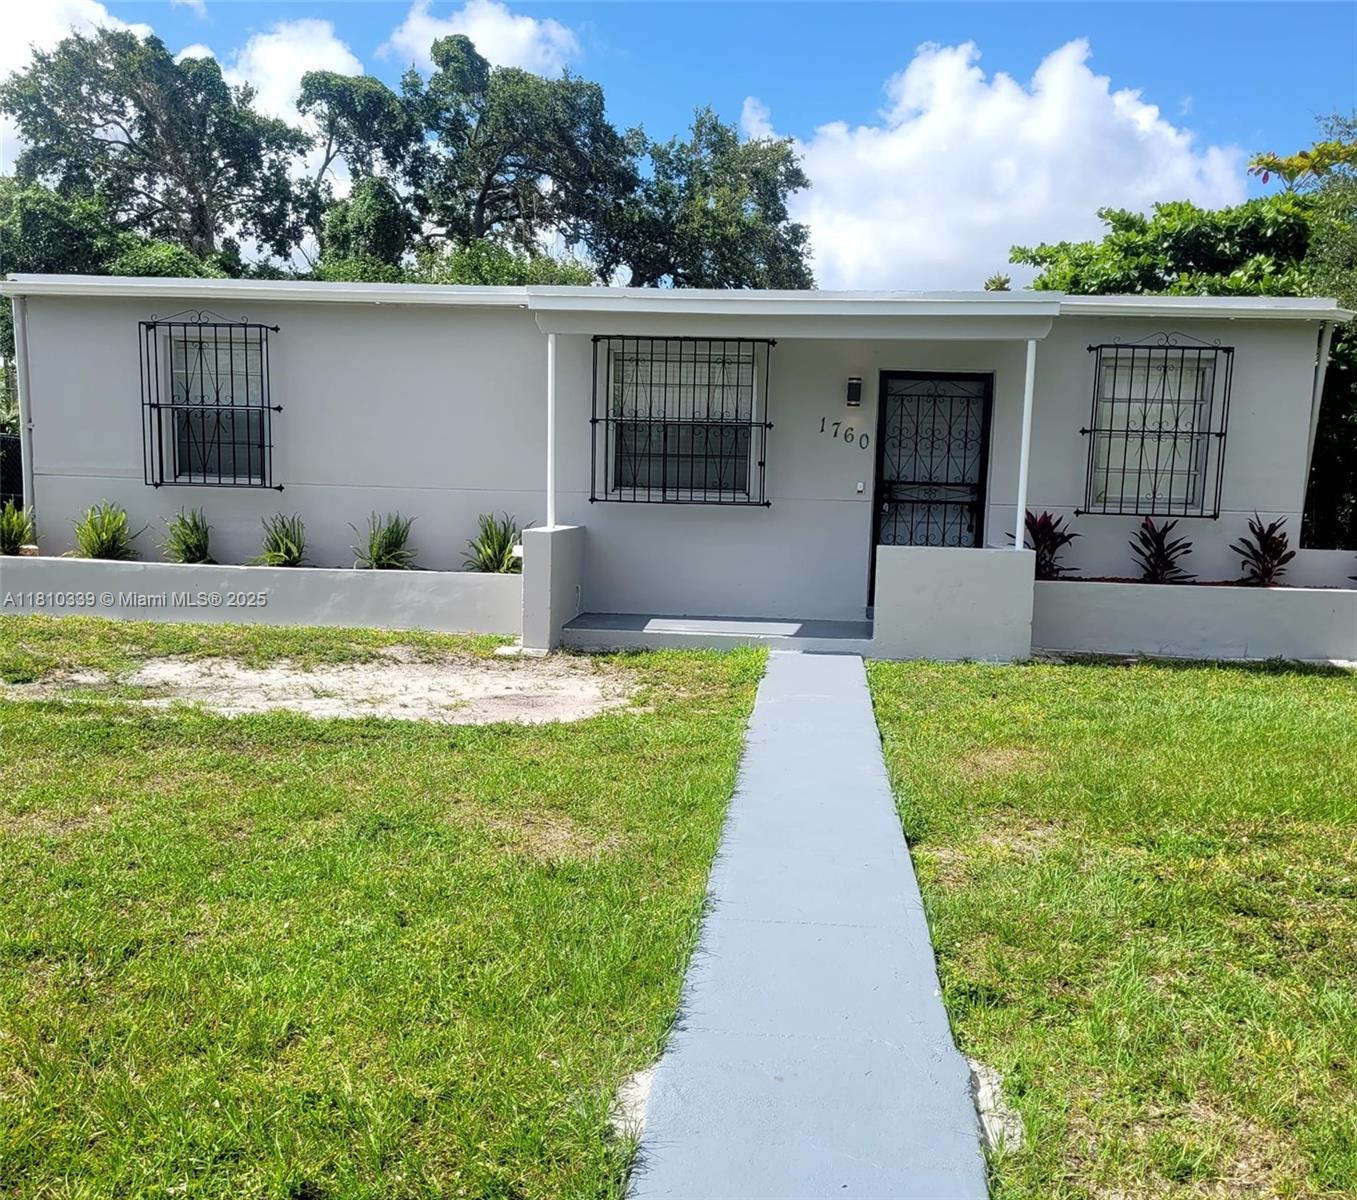
Active
$479,900
3
bds
|
1
ba
|
851
sqft
|
built
1952
1760 NW 127th St, Miami, FL 33167
$-868
Cash flow
-9.4%
Cash-on-Cash Return
4.0%
Cap rate
0.6%
Rent to Value Ratio

Active
$945,000
4
bds
|
2
ba
|
1,629
sqft
|
built
1929
1780 SW 14th Ter, Miami, FL 33145
$-2,631
Cash flow
-14.5%
Cash-on-Cash Return
2.8%
Cap rate
0.5%
Rent to Value Ratio
Active
$690,000
3
bds
|
1
ba
|
861
sqft
|
built
1937
243 NW 43rd St, Miami, FL 33127
$-1,668
Cash flow
-12.6%
Cash-on-Cash Return
3.2%
Cap rate
0.4%
Rent to Value Ratio
Active
$279,000
2
bds
|
2
ba
|
870
sqft
|
built
1988
8185 NW 7th St, Miami, FL 33126
$-574
Cash flow
-10.7%
Cash-on-Cash Return
3.7%
Cap rate
0.8%
Rent to Value Ratio
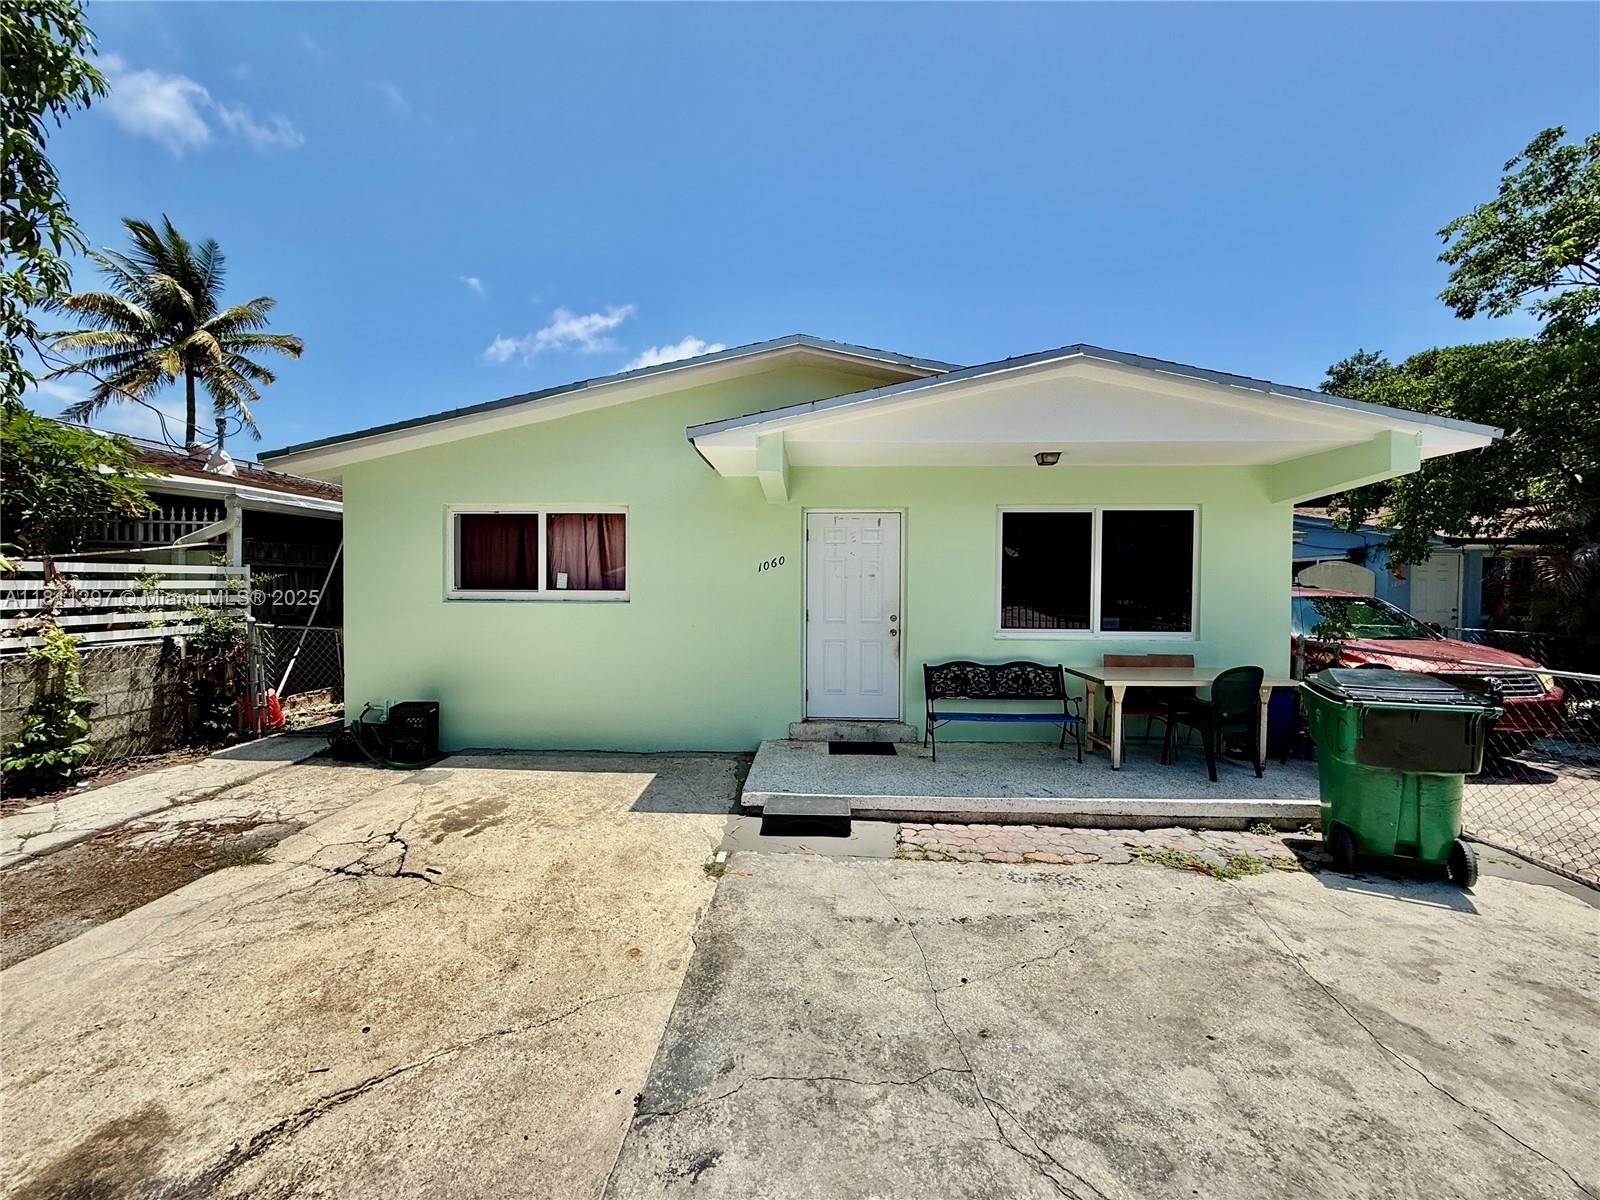
Active
$599,000
2
bds
|
0
ba
|
1,590
sqft
|
built
1973
1060 NW 24th St, Miami, FL 33127
$-2,130
Cash flow
-18.6%
Cash-on-Cash Return
1.9%
Cap rate
0.4%
Rent to Value Ratio
Active
$589,000
1
bds
|
1
ba
|
439
sqft
|
built
2022
398 NE 5th St, Miami, FL 33132
$-1,644
Cash flow
-14.6%
Cash-on-Cash Return
2.8%
Cap rate
0.7%
Rent to Value Ratio
Active
$2,150,000
3
bds
|
3
ba
|
2,129
sqft
|
built
2008
3301 NE 1st Ave, Miami, FL 33137
$-7,234
Cash flow
-17.6%
Cash-on-Cash Return
2.1%
Cap rate
0.4%
Rent to Value Ratio
Active
$699,000
2
bds
|
3
ba
|
1,031
sqft
|
built
2018
488 NE 18th St, Miami, FL 33132
$-2,297
Cash flow
-17.1%
Cash-on-Cash Return
2.2%
Cap rate
0.6%
Rent to Value Ratio
Active
$315,900
3
bds
|
2
ba
|
1,206
sqft
|
built
1976
14250 SW 62nd St, Miami, FL 33183
$-707
Cash flow
-11.7%
Cash-on-Cash Return
3.5%
Cap rate
0.8%
Rent to Value Ratio
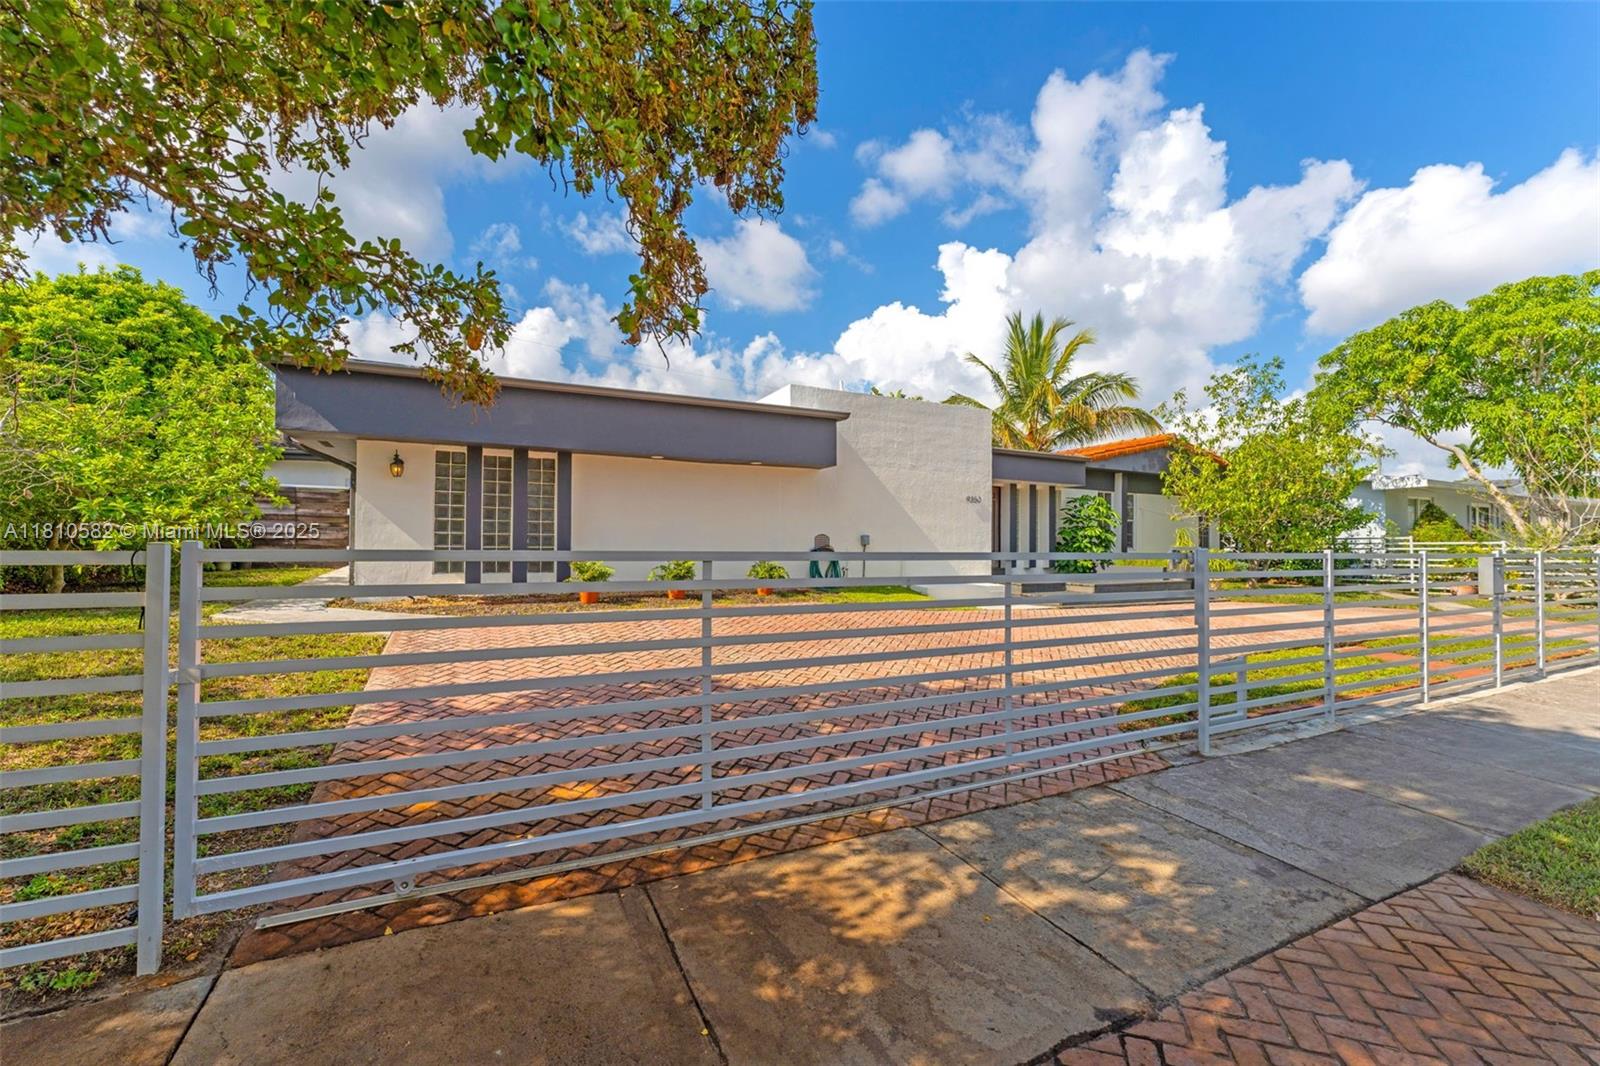
Active
$1,200,000
5
bds
|
3
ba
|
3,137
sqft
|
built
1972
9350 SW 88th Ter, Miami, FL 33176
$-1,307
Cash flow
-5.7%
Cash-on-Cash Return
4.8%
Cap rate
0.7%
Rent to Value Ratio
Active
$299,000
3
bds
|
2
ba
|
1,040
sqft
|
built
1981
8520 SW 133rd Avenue Rd, Miami, FL 33183
$-486
Cash flow
-8.5%
Cash-on-Cash Return
4.2%
Cap rate
0.9%
Rent to Value Ratio
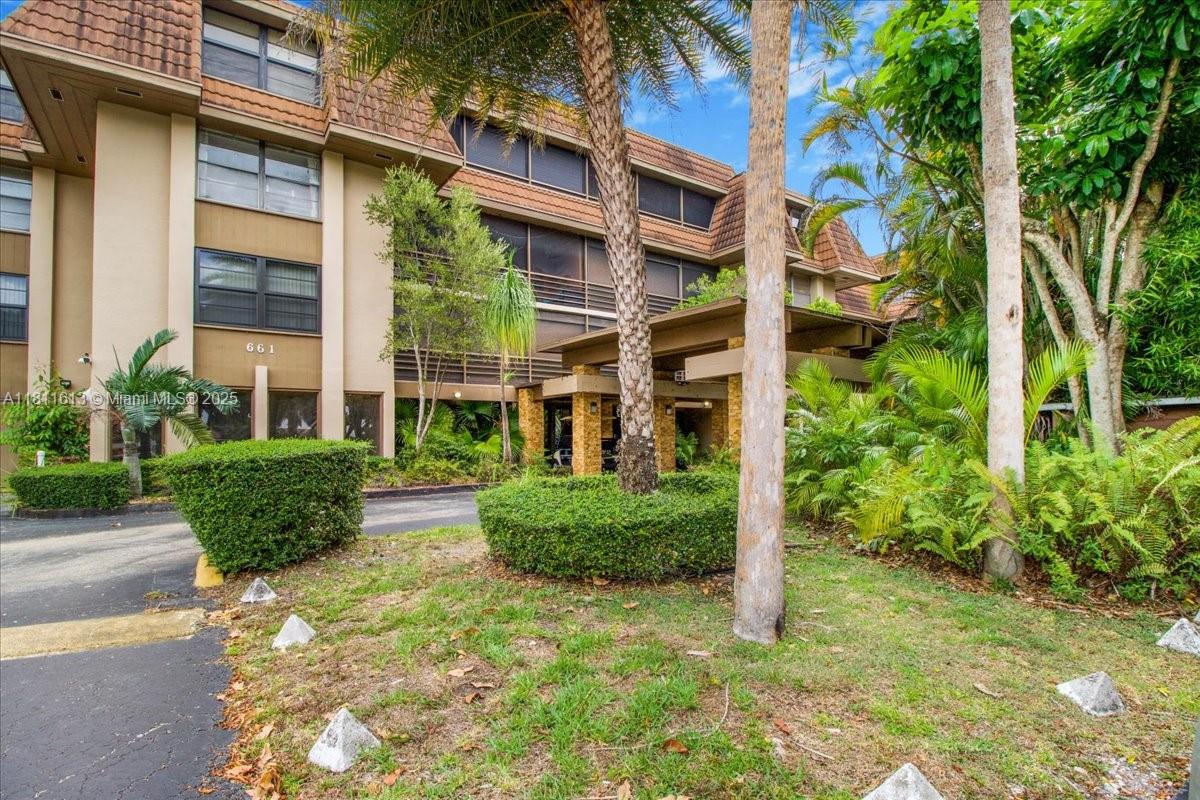
Active
$249,000
2
bds
|
2
ba
|
1,255
sqft
|
built
1973
661 NE 195th St, Miami, FL 33179
$-539
Cash flow
-11.3%
Cash-on-Cash Return
3.6%
Cap rate
1.0%
Rent to Value Ratio
Active
$750,000
3
bds
|
2
ba
|
1,364
sqft
|
built
1971
4752 SW 127th Ct, Miami, FL 33175
$-1,724
Cash flow
-12.0%
Cash-on-Cash Return
3.4%
Cap rate
0.5%
Rent to Value Ratio
Active
$550,000
3
bds
|
0
ba
|
1,248
sqft
|
built
1959
5545 NW 3rd Ave, Miami, FL 33127
$-1,574
Cash flow
-14.9%
Cash-on-Cash Return
2.7%
Cap rate
0.5%
Rent to Value Ratio
Active
$534,900
3
bds
|
2
ba
|
1,469
sqft
|
built
1989
15319 SW 53rd Ter, Miami, FL 33185
$-675
Cash flow
-6.6%
Cash-on-Cash Return
4.6%
Cap rate
0.7%
Rent to Value Ratio
Active
$350,000
1
bds
|
1
ba
|
600
sqft
|
built
1998
185 SE 14th Ter, Miami, FL 33131
$-1,278
Cash flow
-19.1%
Cash-on-Cash Return
1.8%
Cap rate
0.7%
Rent to Value Ratio
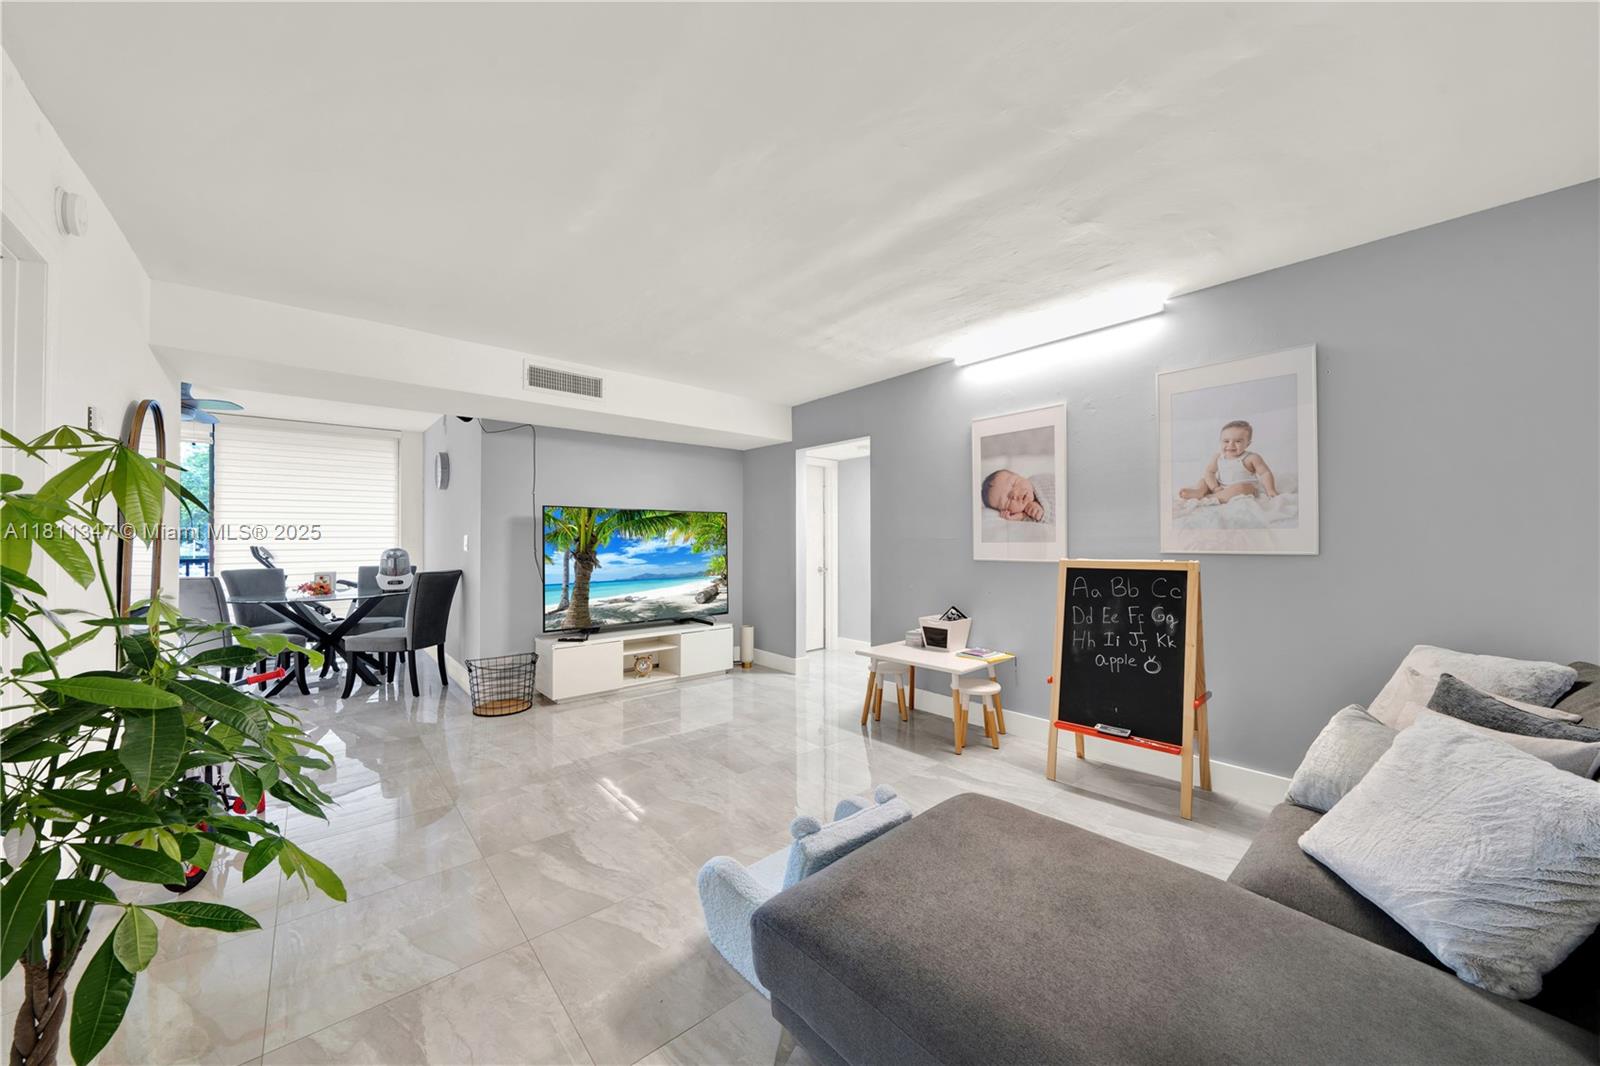
Active
$520,000
3
bds
|
3
ba
|
1,440
sqft
|
built
1997
14816 SW 104th St, Miami, FL 33196
$-1,459
Cash flow
-14.6%
Cash-on-Cash Return
2.8%
Cap rate
0.6%
Rent to Value Ratio
Active
$475,000
3
bds
|
2
ba
|
1,378
sqft
|
built
1973
11389 SW 65th St, Miami, FL 33173
$-543
Cash flow
-6.0%
Cash-on-Cash Return
4.8%
Cap rate
0.7%
Rent to Value Ratio
Active
$670,000
1
bds
|
2
ba
|
852
sqft
|
built
2017
45 SW 9th St, Miami, FL 33130
$-2,750
Cash flow
-21.4%
Cash-on-Cash Return
1.2%
Cap rate
0.6%
Rent to Value Ratio
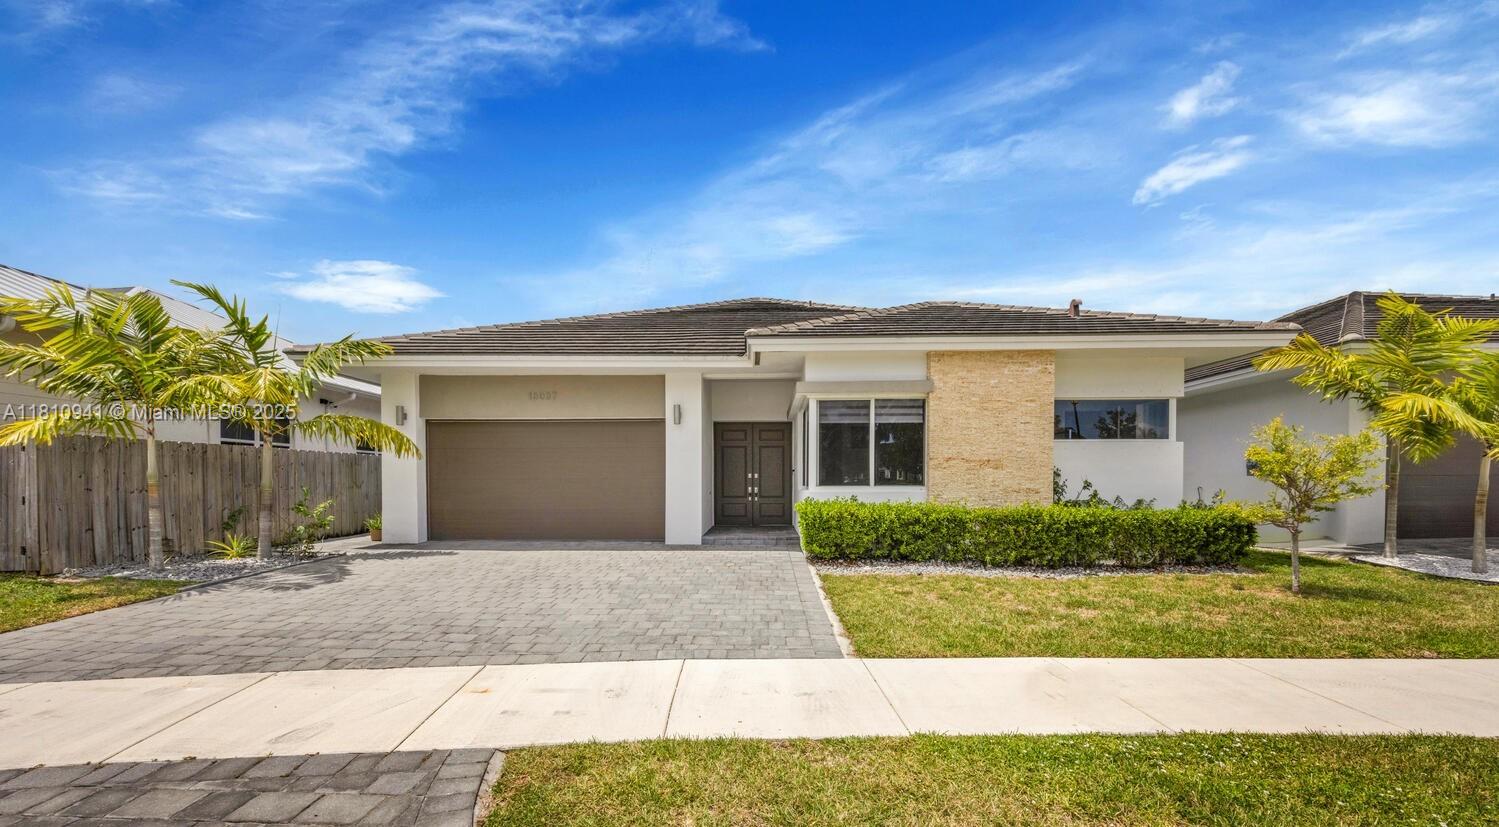
Active
$755,000
4
bds
|
4
ba
|
2,264
sqft
|
built
2020
15037 SW 174th St, Miami, FL 33187
$-1,634
Cash flow
-11.3%
Cash-on-Cash Return
3.5%
Cap rate
0.6%
Rent to Value Ratio
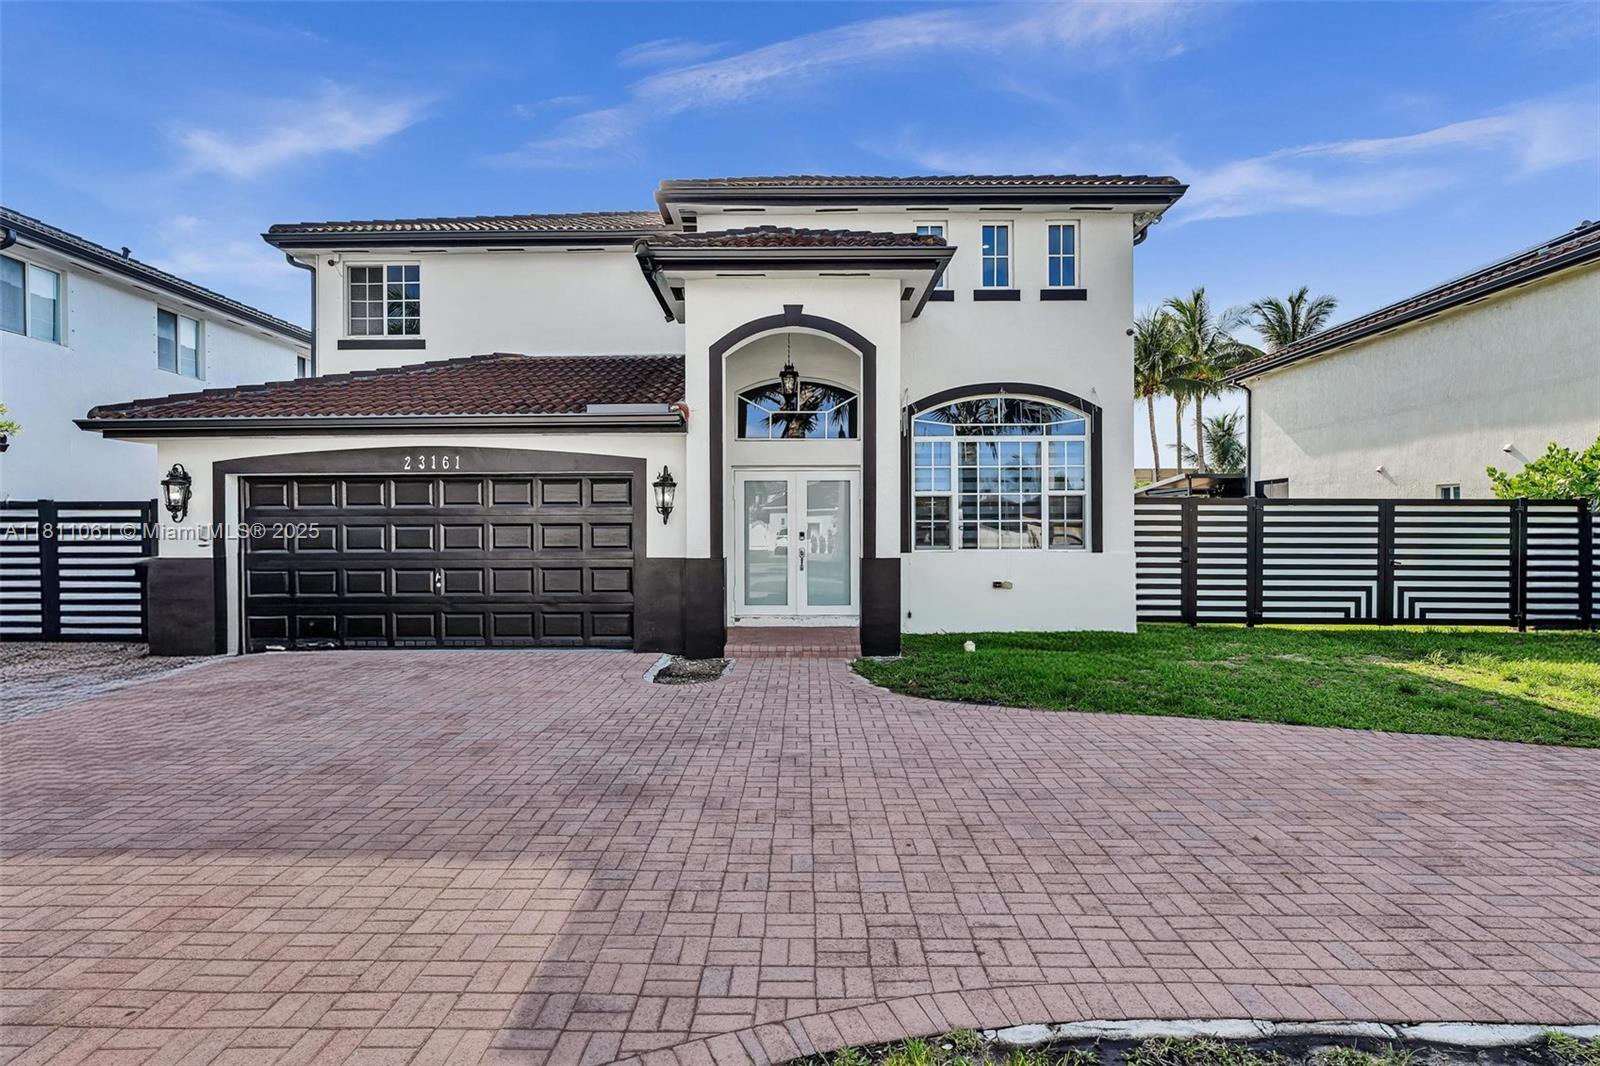
Active
$899,999
4
bds
|
3
ba
|
2,619
sqft
|
built
2005
23161 SW 107th Ave, Miami, FL 33170
$-2,911
Cash flow
-16.9%
Cash-on-Cash Return
2.3%
Cap rate
0.4%
Rent to Value Ratio
Active under contract
$250,000
2
bds
|
2
ba
|
1,092
sqft
|
built
1982
325 NW 72nd Ave, Miami, FL 33126
$-161
Cash flow
-3.4%
Cash-on-Cash Return
5.4%
Cap rate
0.9%
Rent to Value Ratio