Miami, FL Investment Properties for Sale
Browse homes for sale and investment properties in Miami, FL. Refine your search by price, property type, or more.
Best cash flowing properties in Miami, FL
Active
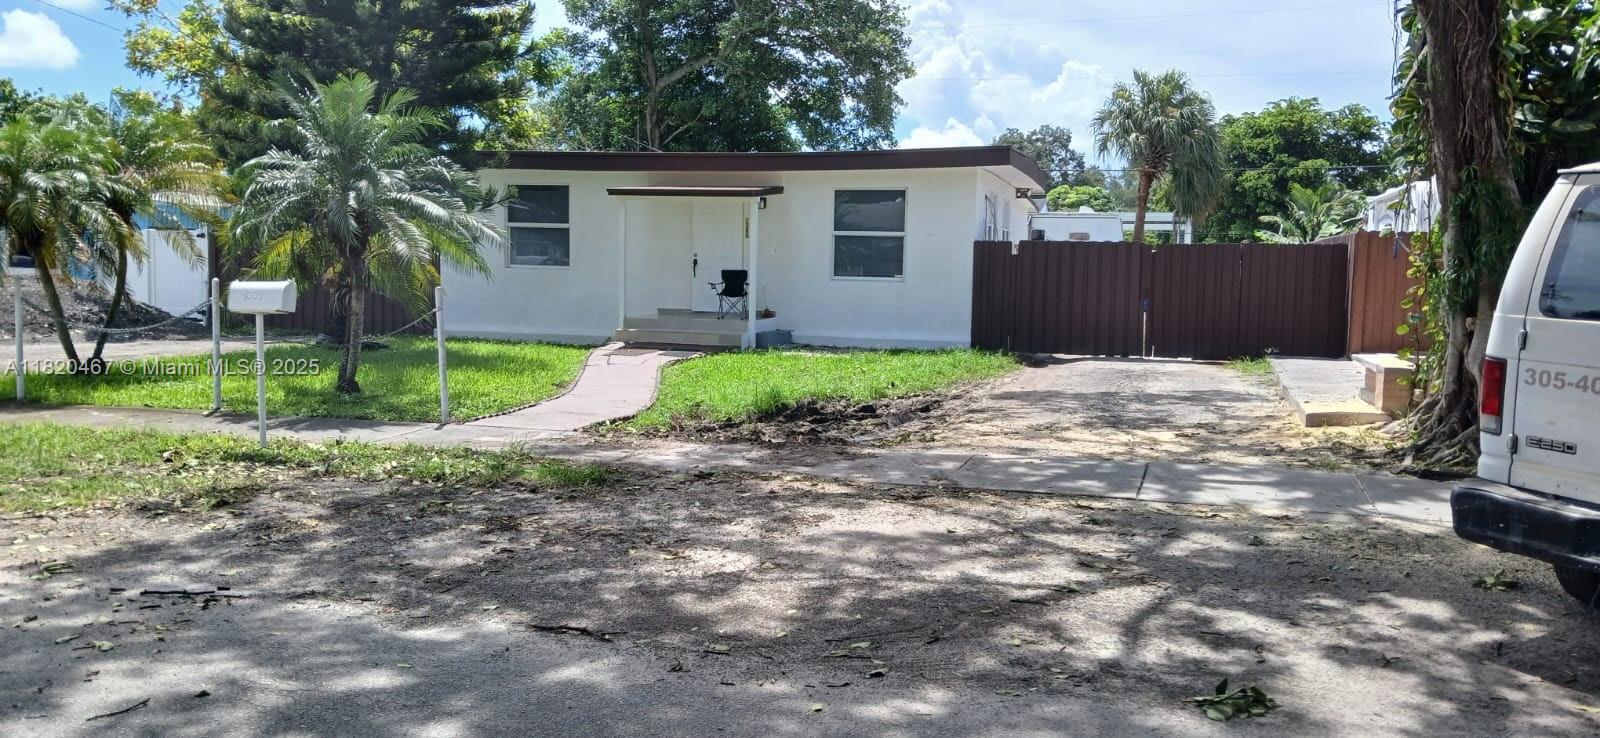
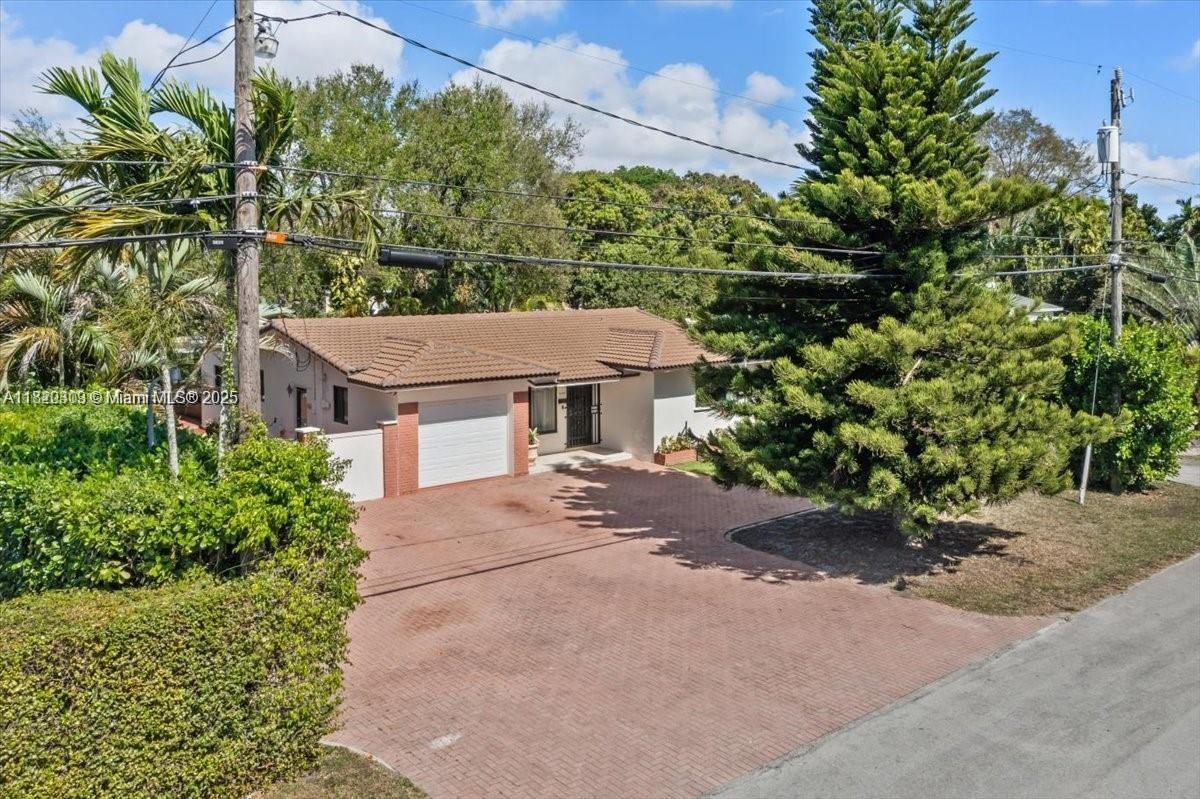
$189,900
1
bds
|
1
ba
|
605
sqft
|
built
1972
801 NW 47th Ave, Miami, FL 33126
$-388
Cash flow
-10.7%
Cash-on-Cash Return
3.7%
Cap rate
0.9%
Rent to Value Ratio

Active
$495,000
3
bds
|
2
ba
|
1,110
sqft
|
built
1978
1847 NW 63rd St, Miami, FL 33147
$-409
Cash flow
-4.3%
Cash-on-Cash Return
5.2%
Cap rate
0.7%
Rent to Value Ratio
6,350 out of 7,208 properties for sale in Miami, FL
Limited Results Shown
Create a free account, or log in to reveal all property listings and enjoy the complete experience.
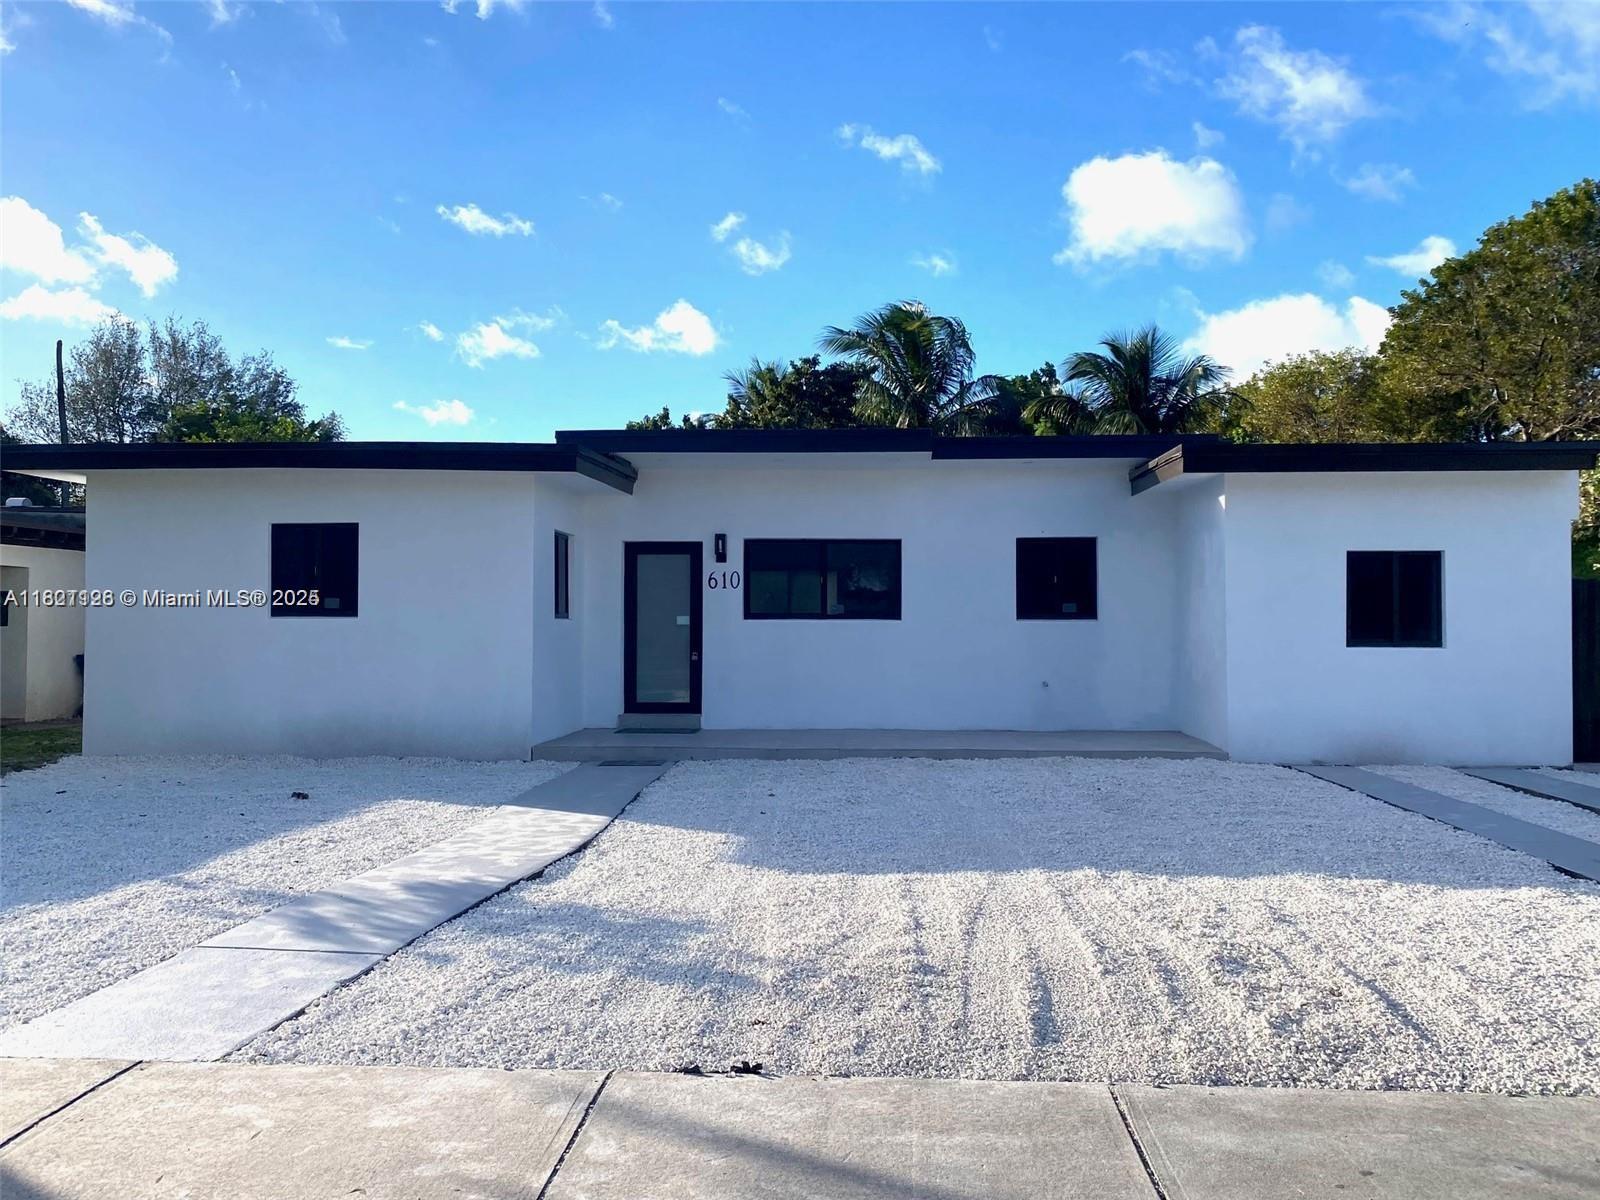
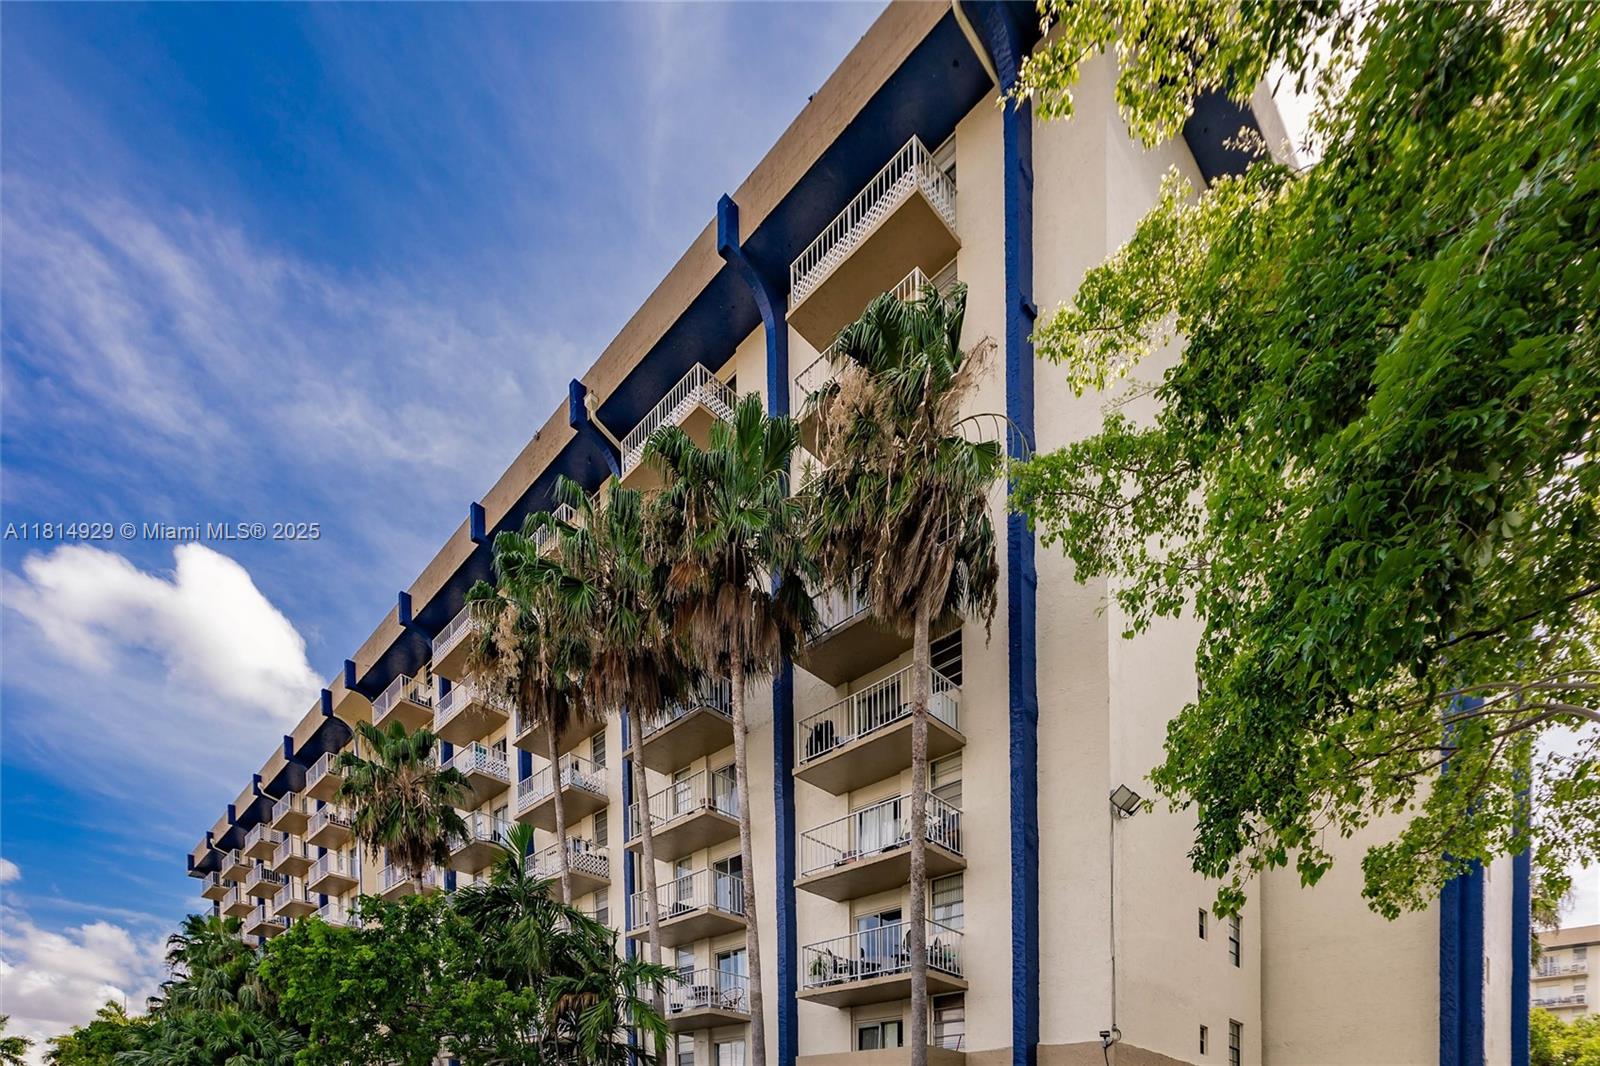
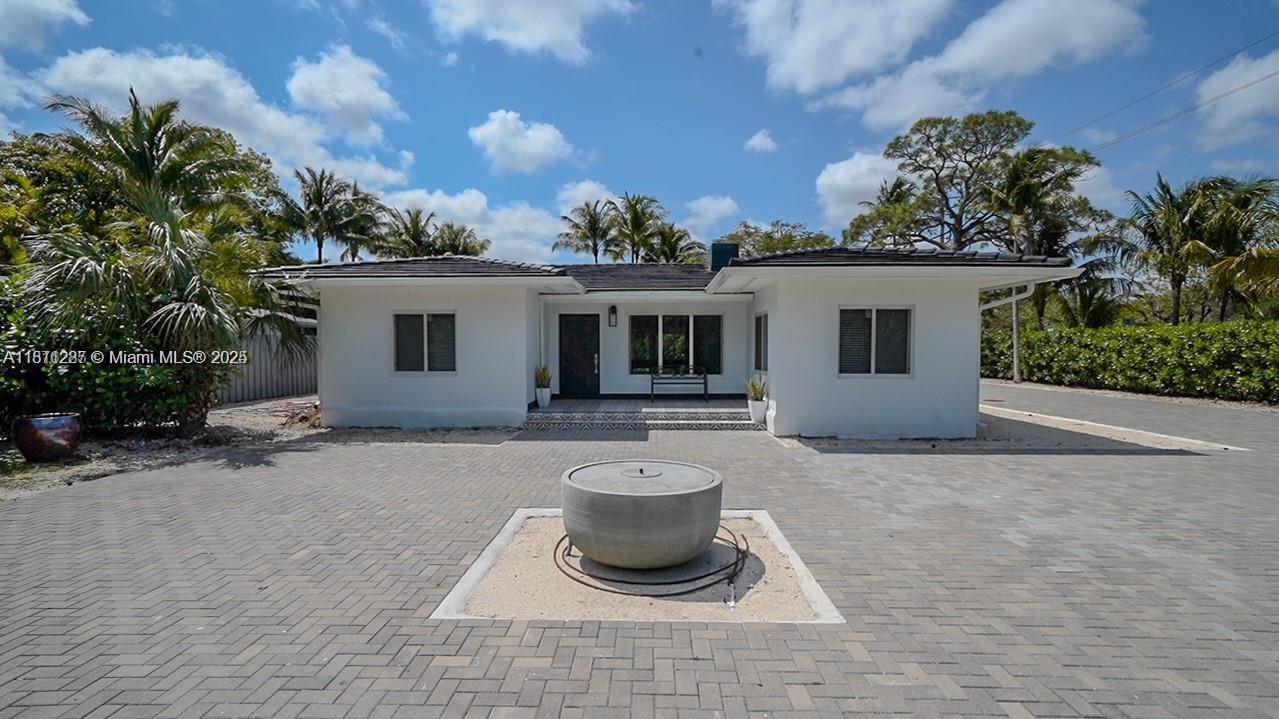
Active
$599,000
3
bds
|
2
ba
|
1,287
sqft
|
built
1950
610 NW 111th St, Miami, FL 33168
$-1,628
Cash flow
-14.2%
Cash-on-Cash Return
2.9%
Cap rate
0.5%
Rent to Value Ratio
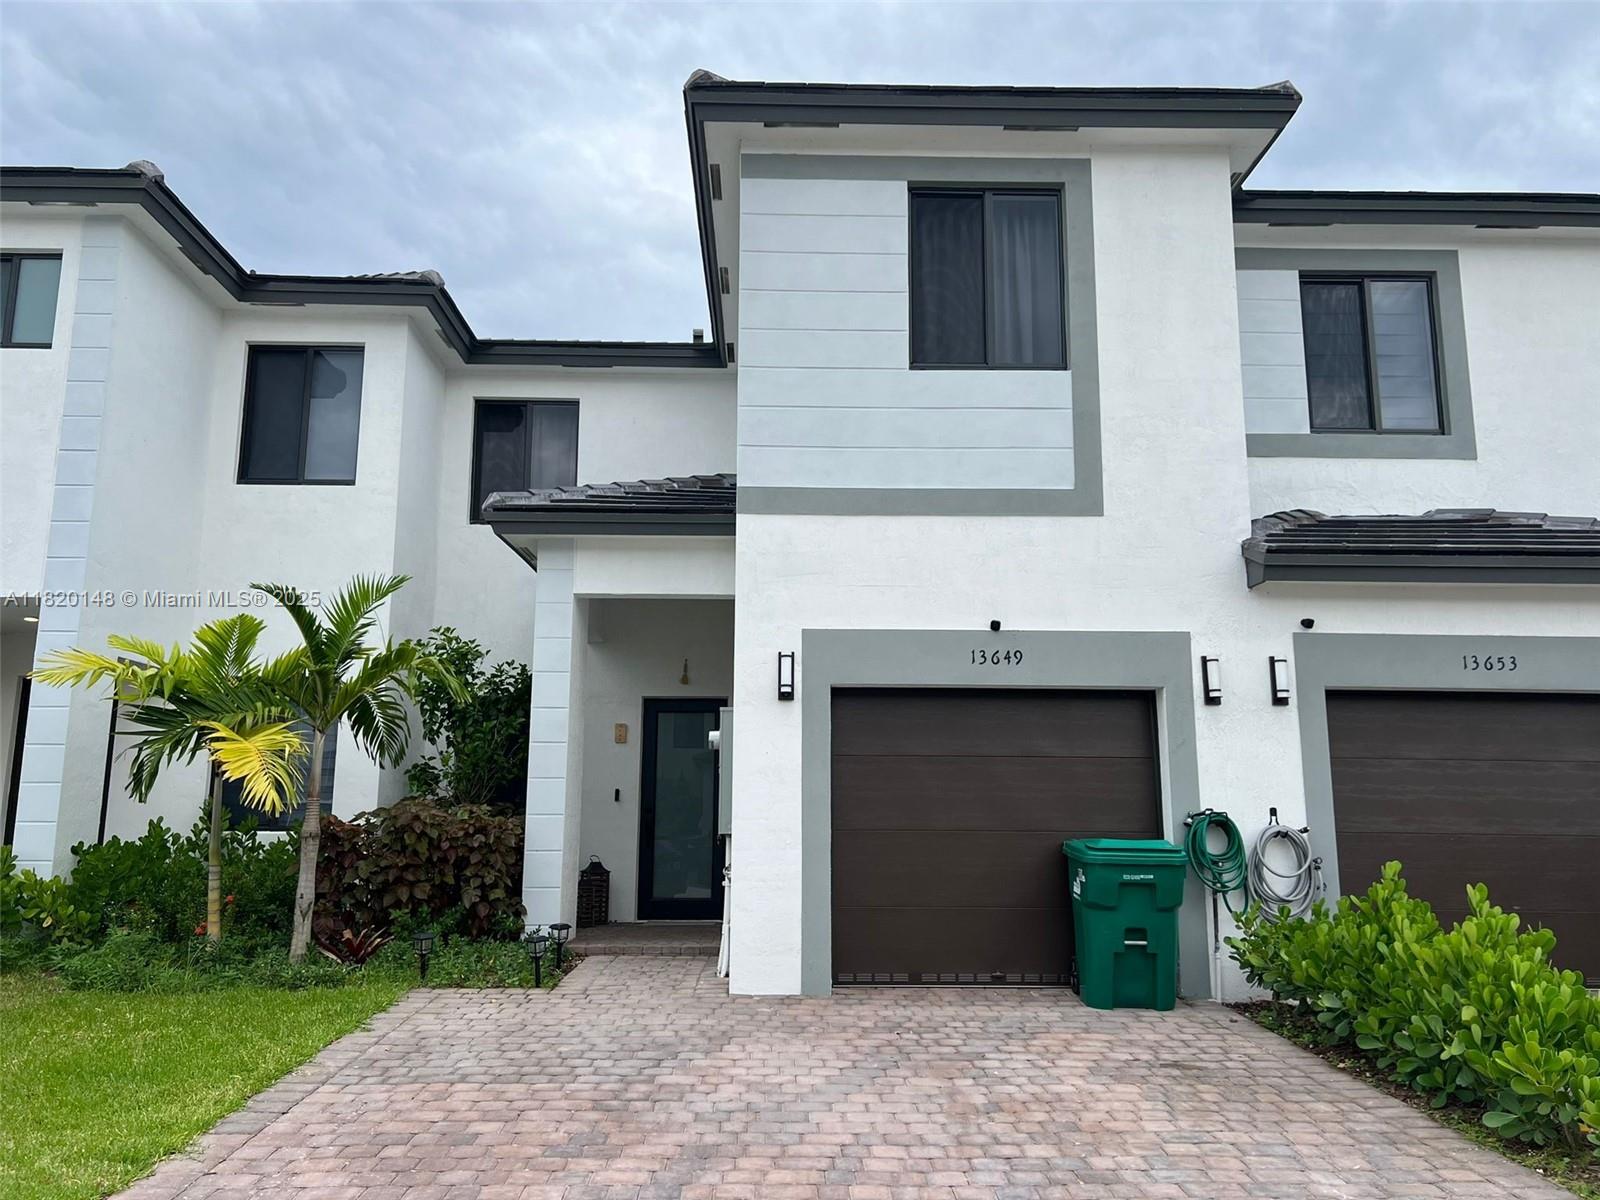
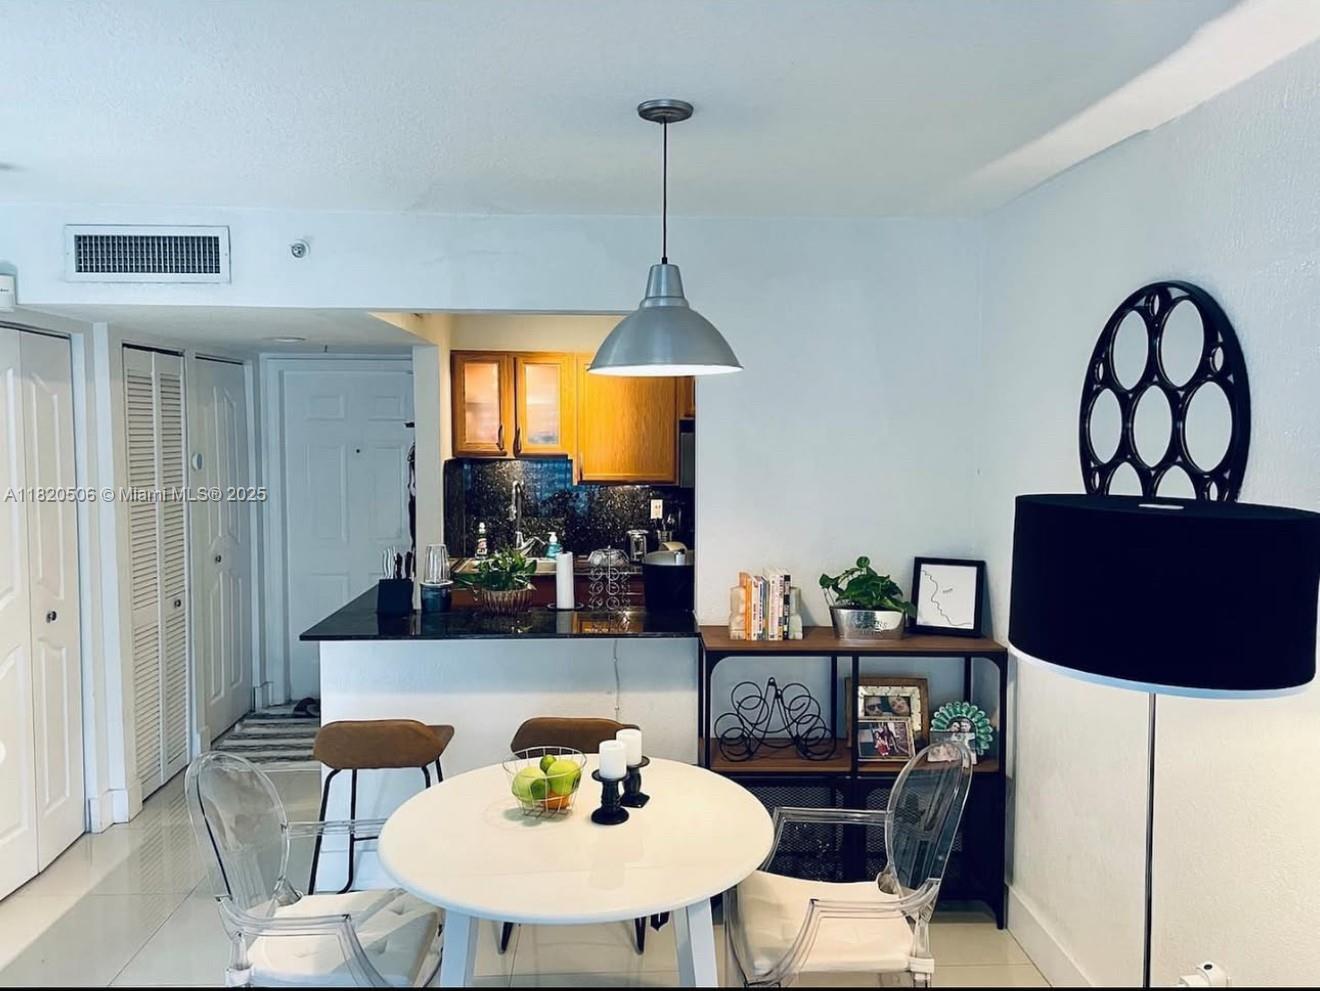
Active
$570,000
3
bds
|
3
ba
|
1,824
sqft
|
built
2023
13649 SW 157th Pl, Miami, FL 33196
$-1,925
Cash flow
-17.6%
Cash-on-Cash Return
2.1%
Cap rate
0.5%
Rent to Value Ratio
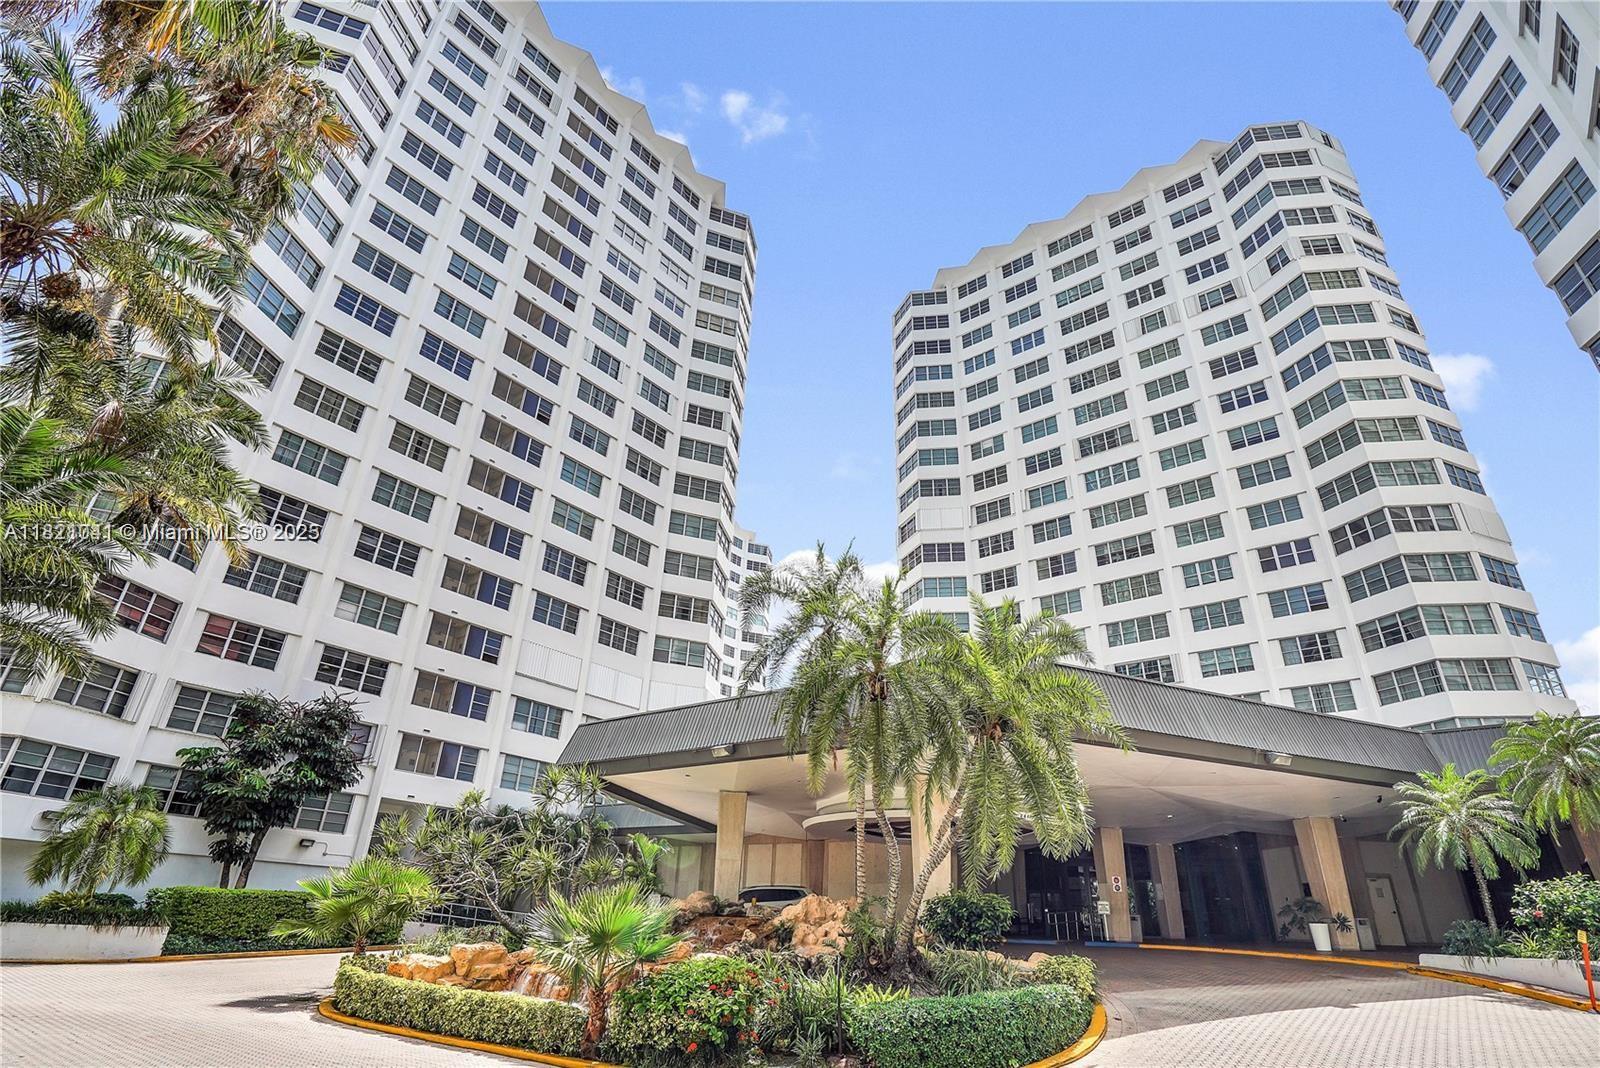
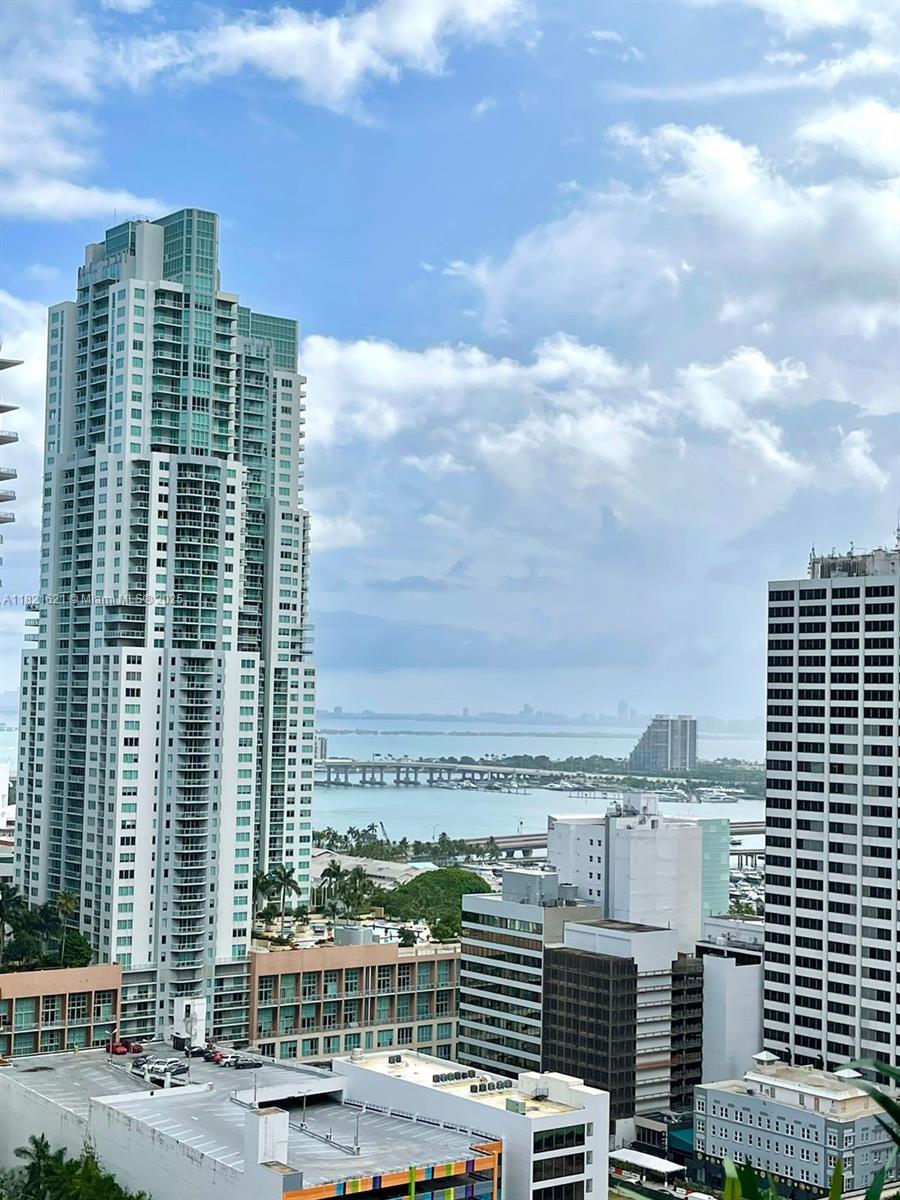
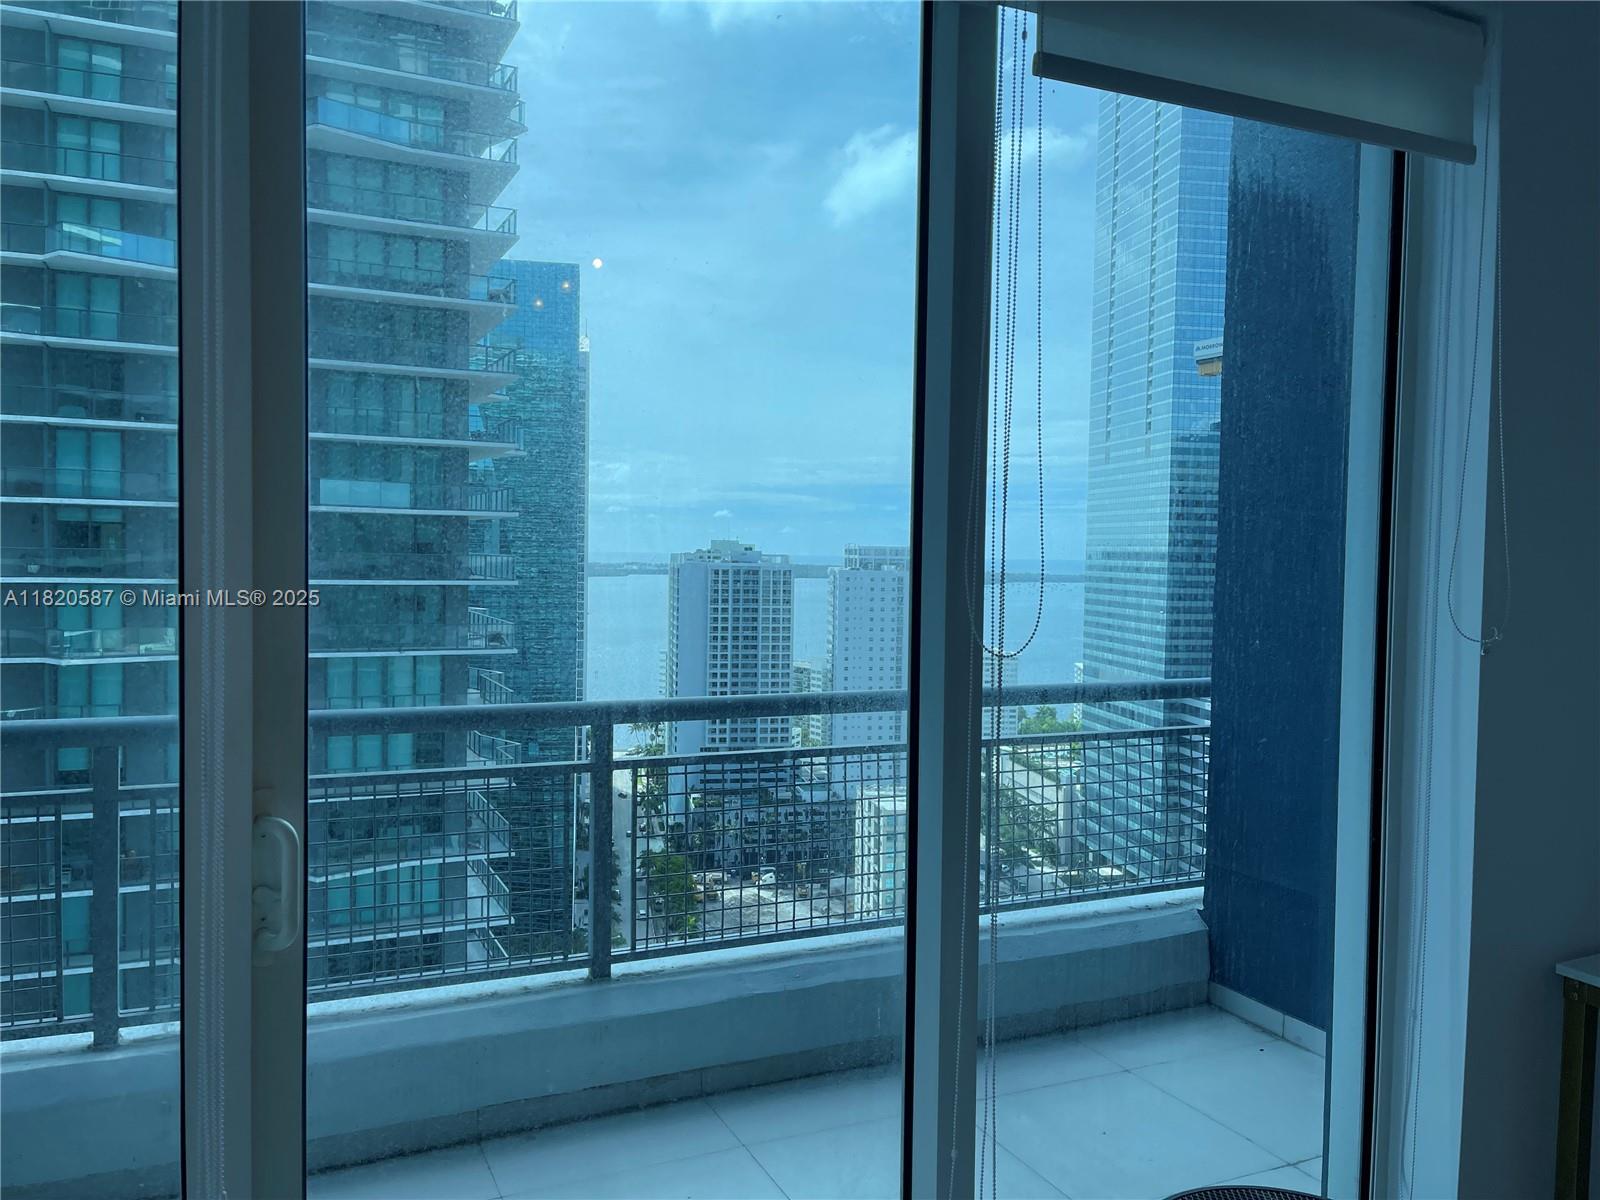
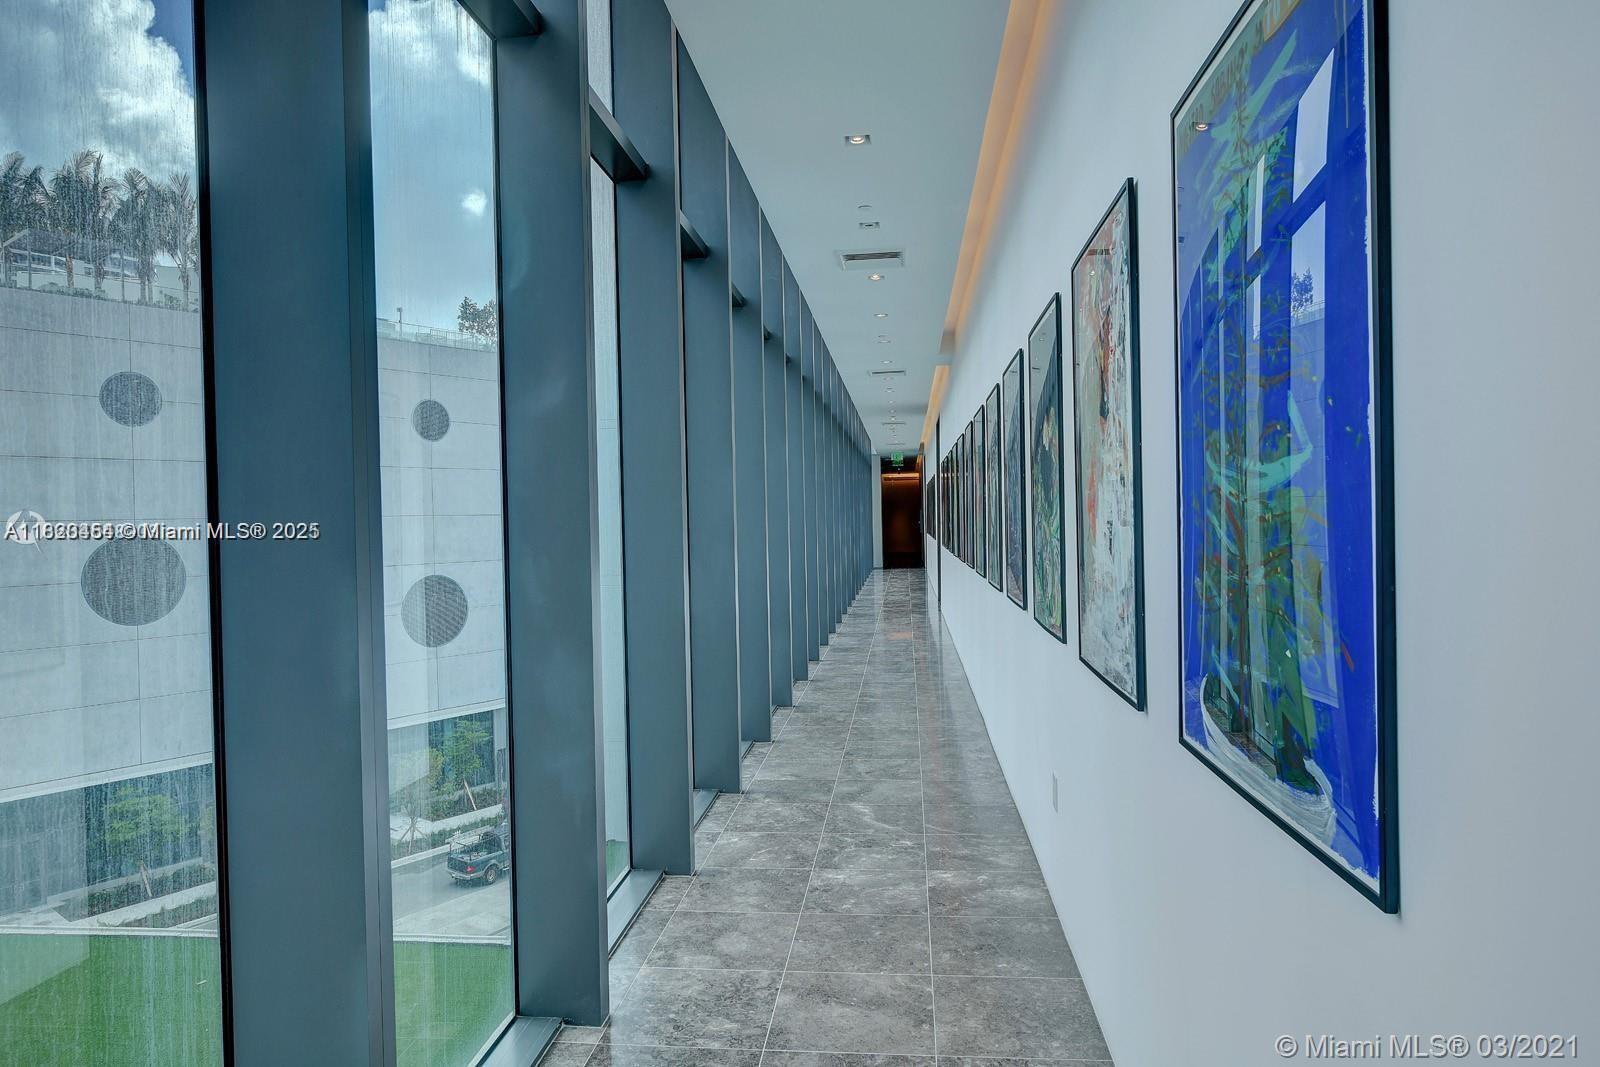
Active
$420,000
2
bds
|
2
ba
|
990
sqft
|
built
1968
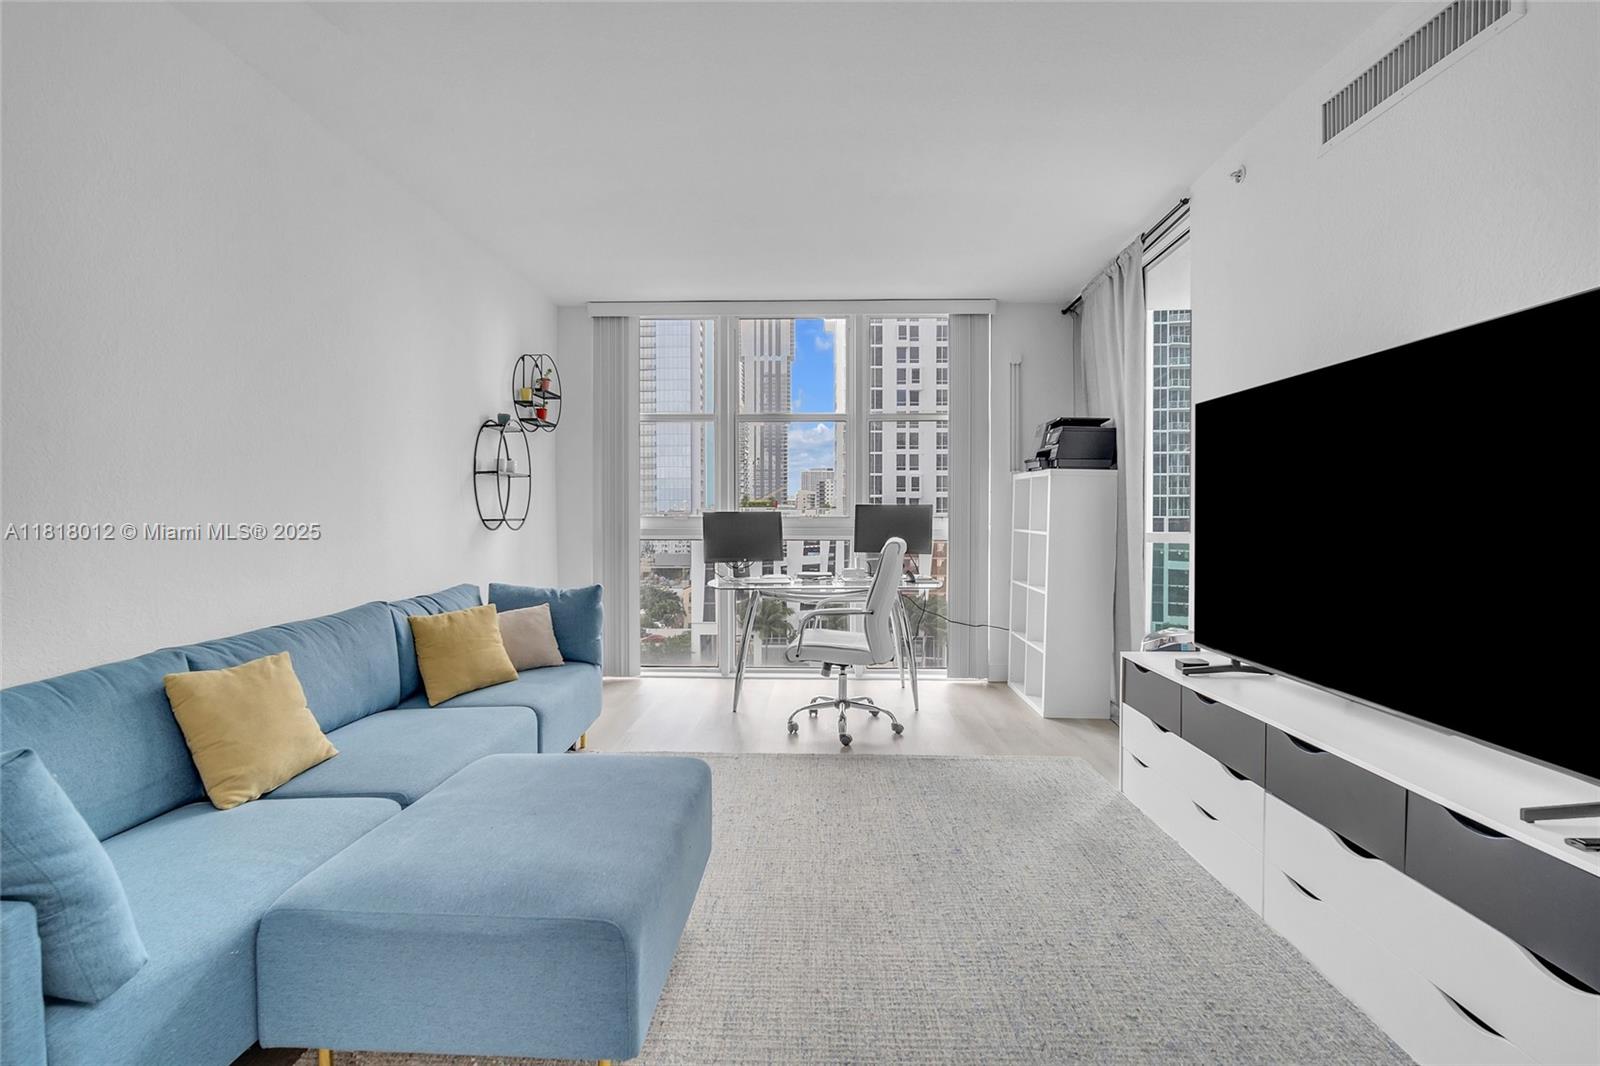
999 Brickell Bay Dr, Miami, FL 33131
$-1,118
Cash flow
-13.9%
Cash-on-Cash Return
3.0%
Cap rate
0.8%
Rent to Value Ratio

Active
$785,000
4
bds
|
3
ba
|
2,203
sqft
|
built
2001
18043 SW 149th Pl, Miami, FL 33187
$-2,099
Cash flow
-14.0%
Cash-on-Cash Return
2.9%
Cap rate
0.5%
Rent to Value Ratio
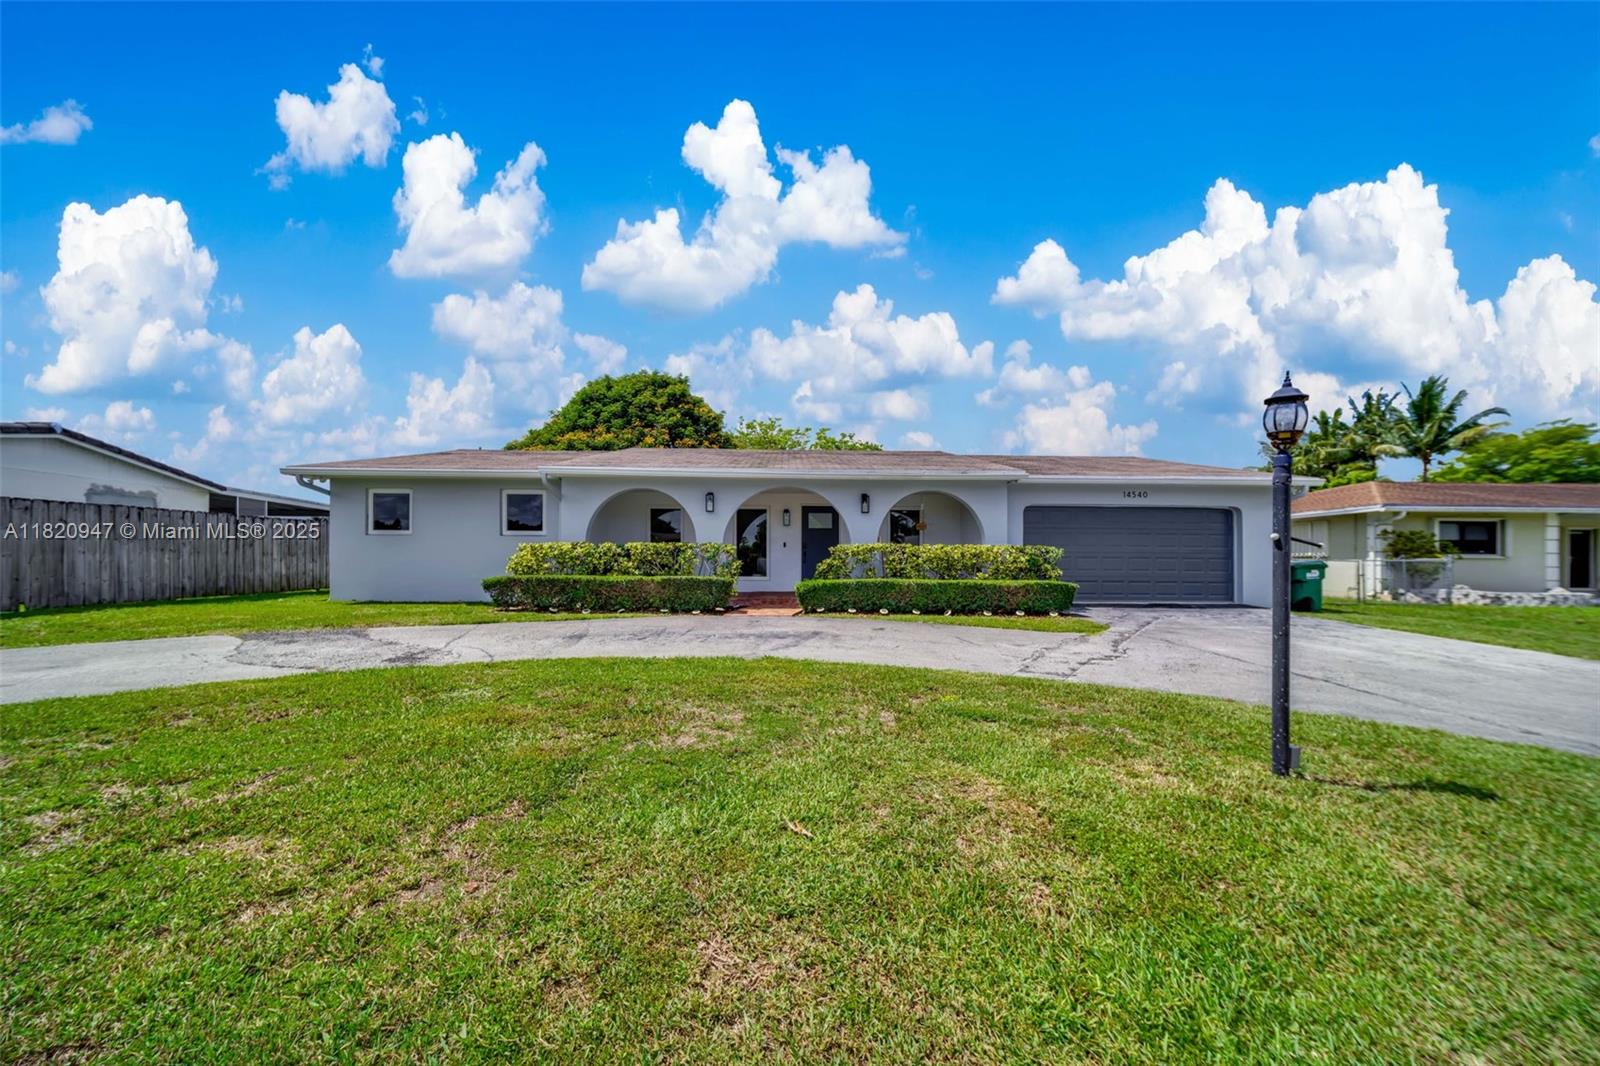
Active
$899,999
3
bds
|
2
ba
|
1,984
sqft
|
built
1973
14540 SW 77th St, Miami, FL 33183
$-2,395
Cash flow
-13.9%
Cash-on-Cash Return
3.0%
Cap rate
0.5%
Rent to Value Ratio
Active
$495,000
3
bds
|
2
ba
|
1,110
sqft
|
built
1978
1847 NW 63rd St, Miami, FL 33147
$-409
Cash flow
-4.3%
Cash-on-Cash Return
5.2%
Cap rate
0.7%
Rent to Value Ratio

Active
$694,999
3
bds
|
2
ba
|
1,570
sqft
|
built
1953
7110 SW 13th Ter, Miami, FL 33144
$-1,285
Cash flow
-9.6%
Cash-on-Cash Return
3.9%
Cap rate
0.5%
Rent to Value Ratio

Active
$555,000
3
bds
|
2
ba
|
1,288
sqft
|
built
1956
21200 NE 12th Ct, Miami, FL 33179
$-1,068
Cash flow
-10.0%
Cash-on-Cash Return
3.8%
Cap rate
0.6%
Rent to Value Ratio
Active
$189,900
1
bds
|
1
ba
|
605
sqft
|
built
1972
801 NW 47th Ave, Miami, FL 33126
$-388
Cash flow
-10.7%
Cash-on-Cash Return
3.7%
Cap rate
0.9%
Rent to Value Ratio
Active
$345,000
1
bds
|
1
ba
|
430
sqft
|
built
2016
151 SE 1st St, Miami, FL 33131
$-720
Cash flow
-10.9%
Cash-on-Cash Return
3.6%
Cap rate
0.8%
Rent to Value Ratio
Active
$879,999
4
bds
|
3
ba
|
2,362
sqft
|
built
1971
9627 SW 18th Ter, Miami, FL 33165
$-3,433
Cash flow
-20.4%
Cash-on-Cash Return
1.5%
Cap rate
0.4%
Rent to Value Ratio
Active
$665,000
4
bds
|
3
ba
|
2,290
sqft
|
built
2005
13745 SW 113th Ln, Miami, FL 33186
$-1,694
Cash flow
-13.3%
Cash-on-Cash Return
3.1%
Cap rate
0.5%
Rent to Value Ratio
Active
$1,750,000
3
bds
|
4
ba
|
1,928
sqft
|
built
1952
871 NE 71st St, Miami, FL 33138
$-3,878
Cash flow
-11.6%
Cash-on-Cash Return
3.5%
Cap rate
0.5%
Rent to Value Ratio
Active
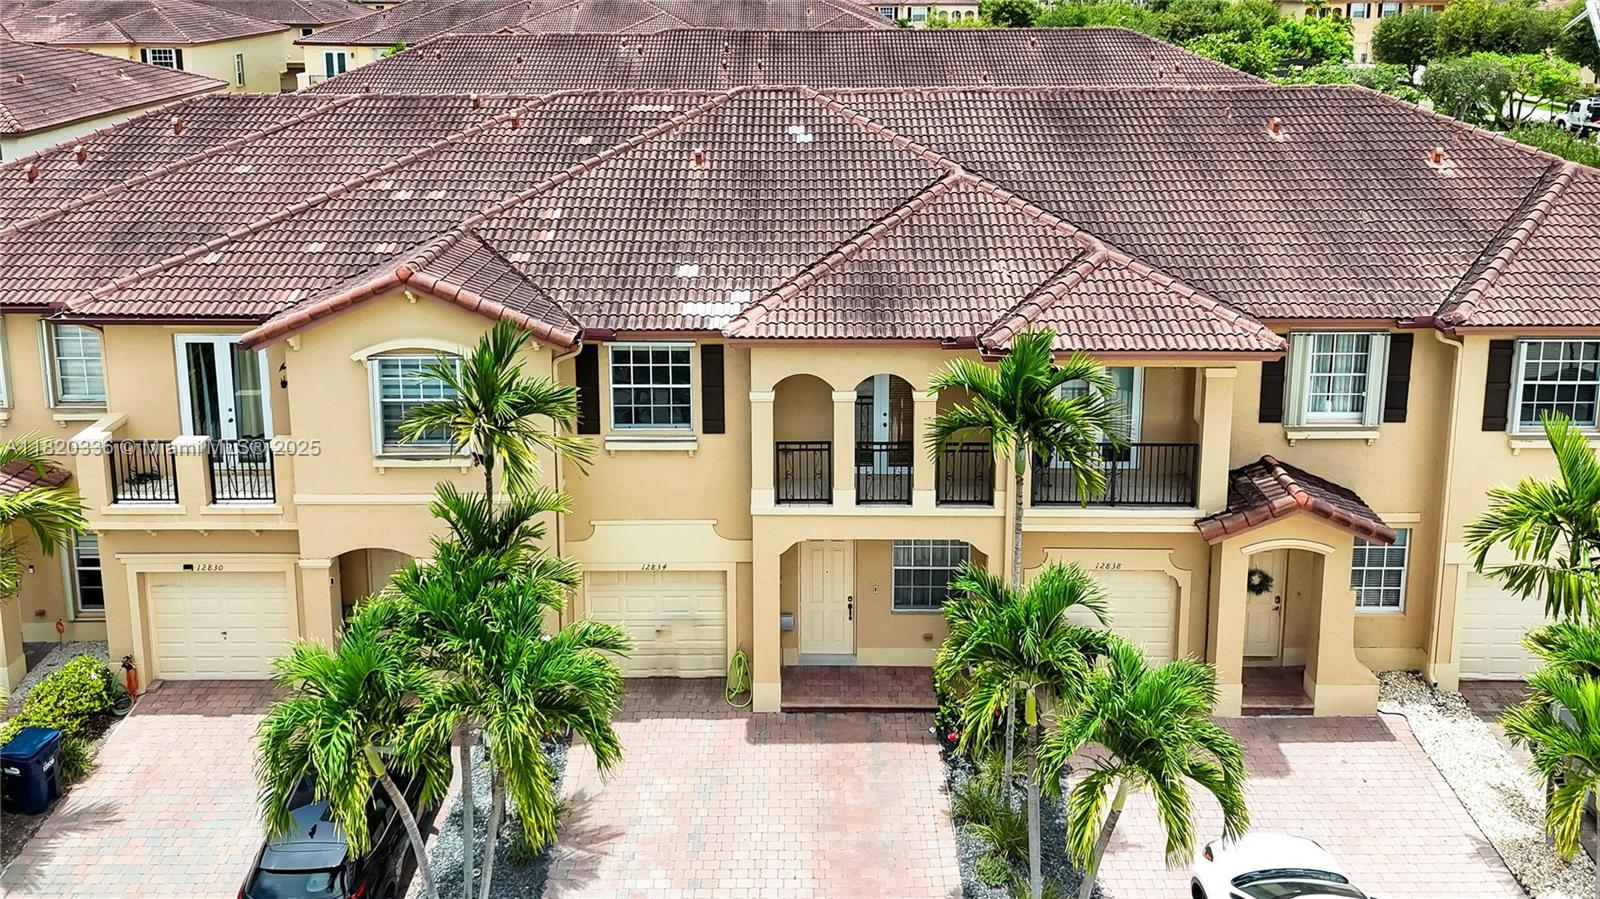
$585,000
3
bds
|
3
ba
|
1,758
sqft
|
built
2005
12834 SW 134th St, Miami, FL 33186
$-1,401
Cash flow
-12.5%
Cash-on-Cash Return
3.3%
Cap rate
0.5%
Rent to Value Ratio
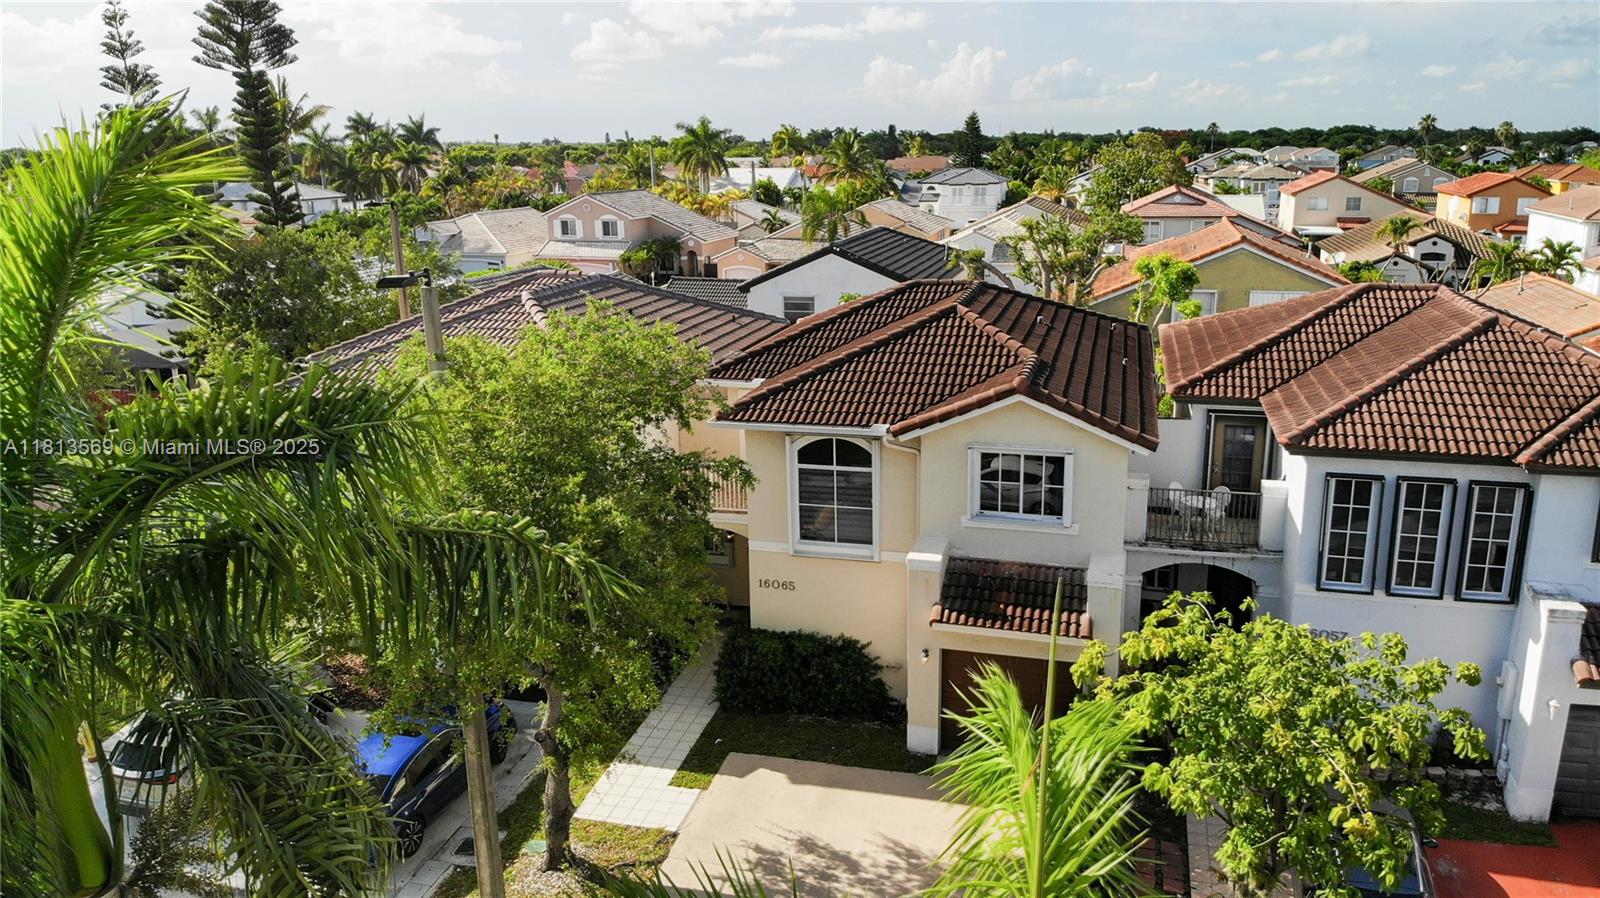
Active
$519,995
3
bds
|
2
ba
|
1,790
sqft
|
built
1997
16065 SW 86th Ln, Miami, FL 33193
$-886
Cash flow
-8.9%
Cash-on-Cash Return
4.1%
Cap rate
0.6%
Rent to Value Ratio
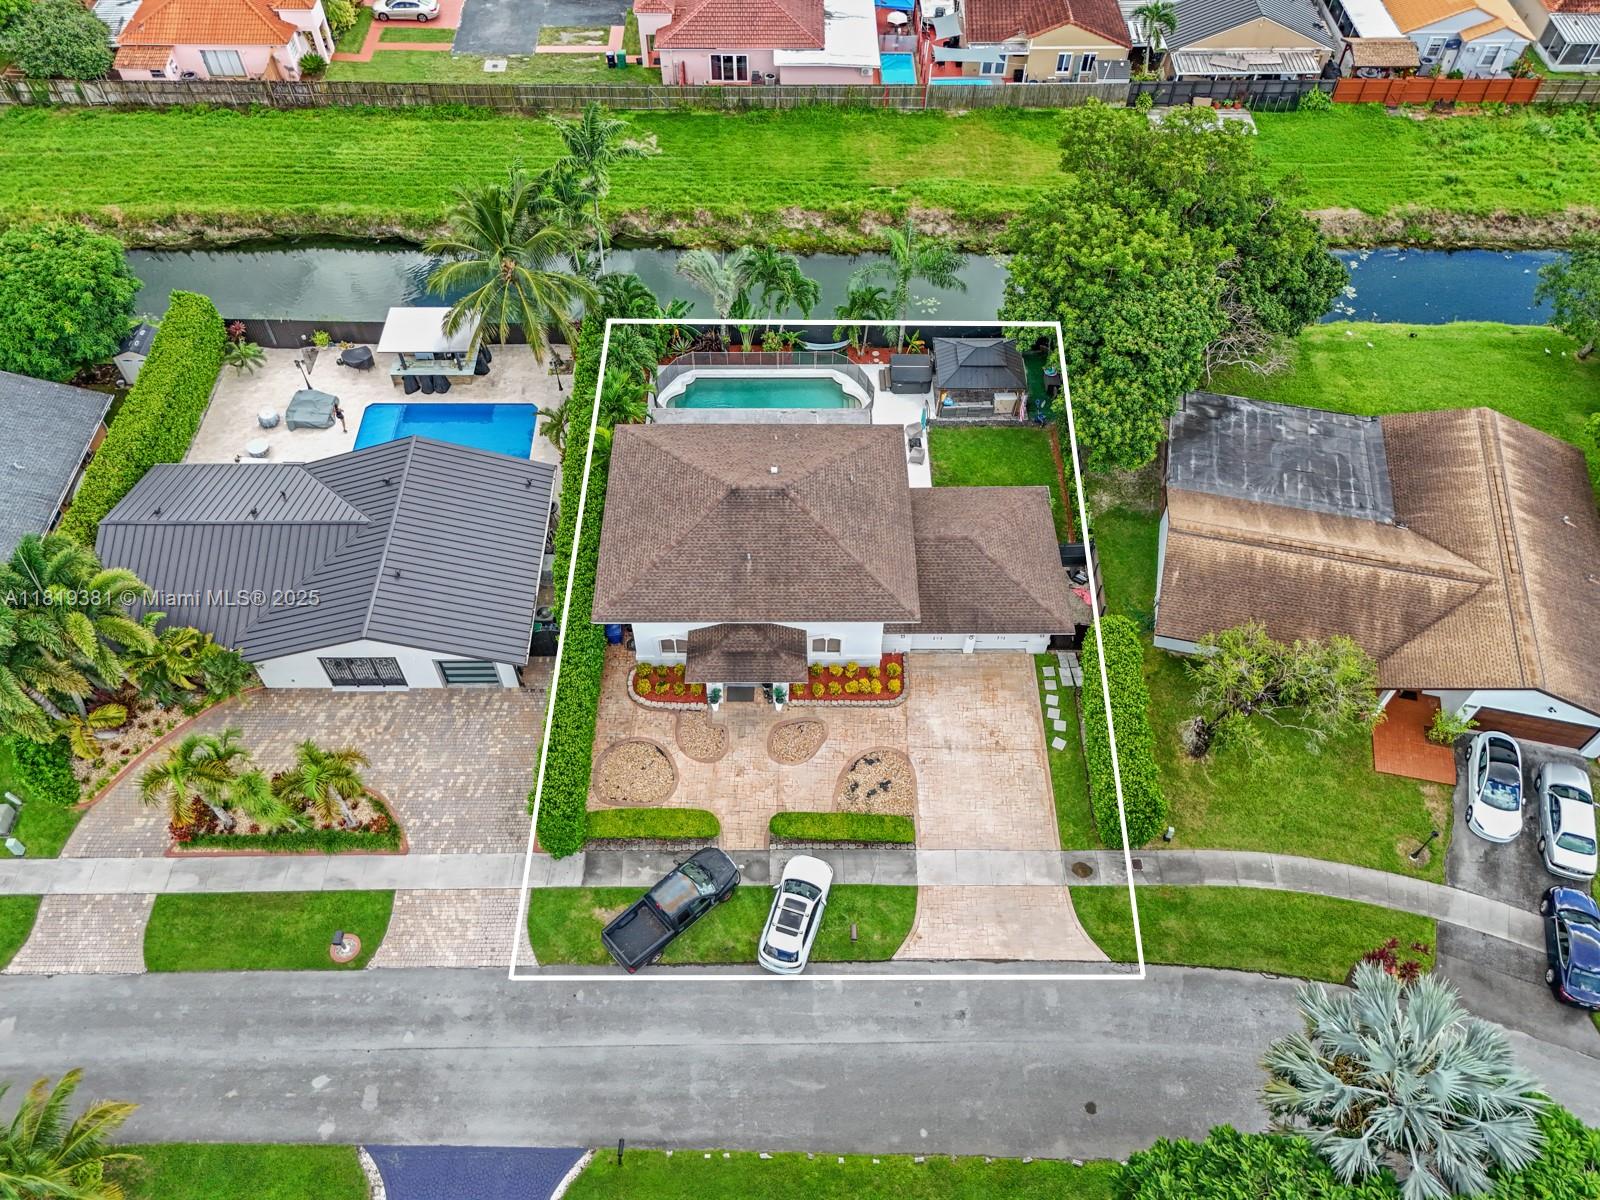
Active
$890,000
4
bds
|
3
ba
|
2,733
sqft
|
built
1981
12950 SW 149th St, Miami, FL 33186
$-1,511
Cash flow
-8.9%
Cash-on-Cash Return
4.1%
Cap rate
0.6%
Rent to Value Ratio
Active
$395,000
2
bds
|
1
ba
|
468
sqft
|
built
1948
1280 NW 100th Ter, Miami, FL 33147
$-863
Cash flow
-11.4%
Cash-on-Cash Return
3.5%
Cap rate
0.5%
Rent to Value Ratio
Active
$435,000
1
bds
|
2
ba
|
782
sqft
|
built
2008
60 SW 13th St, Miami, FL 33130
$-490
Cash flow
-5.9%
Cash-on-Cash Return
4.8%
Cap rate
0.8%
Rent to Value Ratio
Active
$2,650,000
4
bds
|
3
ba
|
1,556
sqft
|
built
1948
8390 SW 64th St, Miami, FL 33143
$-8,820
Cash flow
-17.4%
Cash-on-Cash Return
2.2%
Cap rate
0.3%
Rent to Value Ratio

Active
$399,000
2
bds
|
2
ba
|
1,214
sqft
|
built
2007
7280 SW 89th St, Miami, FL 33156
$-1,626
Cash flow
-21.3%
Cash-on-Cash Return
1.3%
Cap rate
0.7%
Rent to Value Ratio

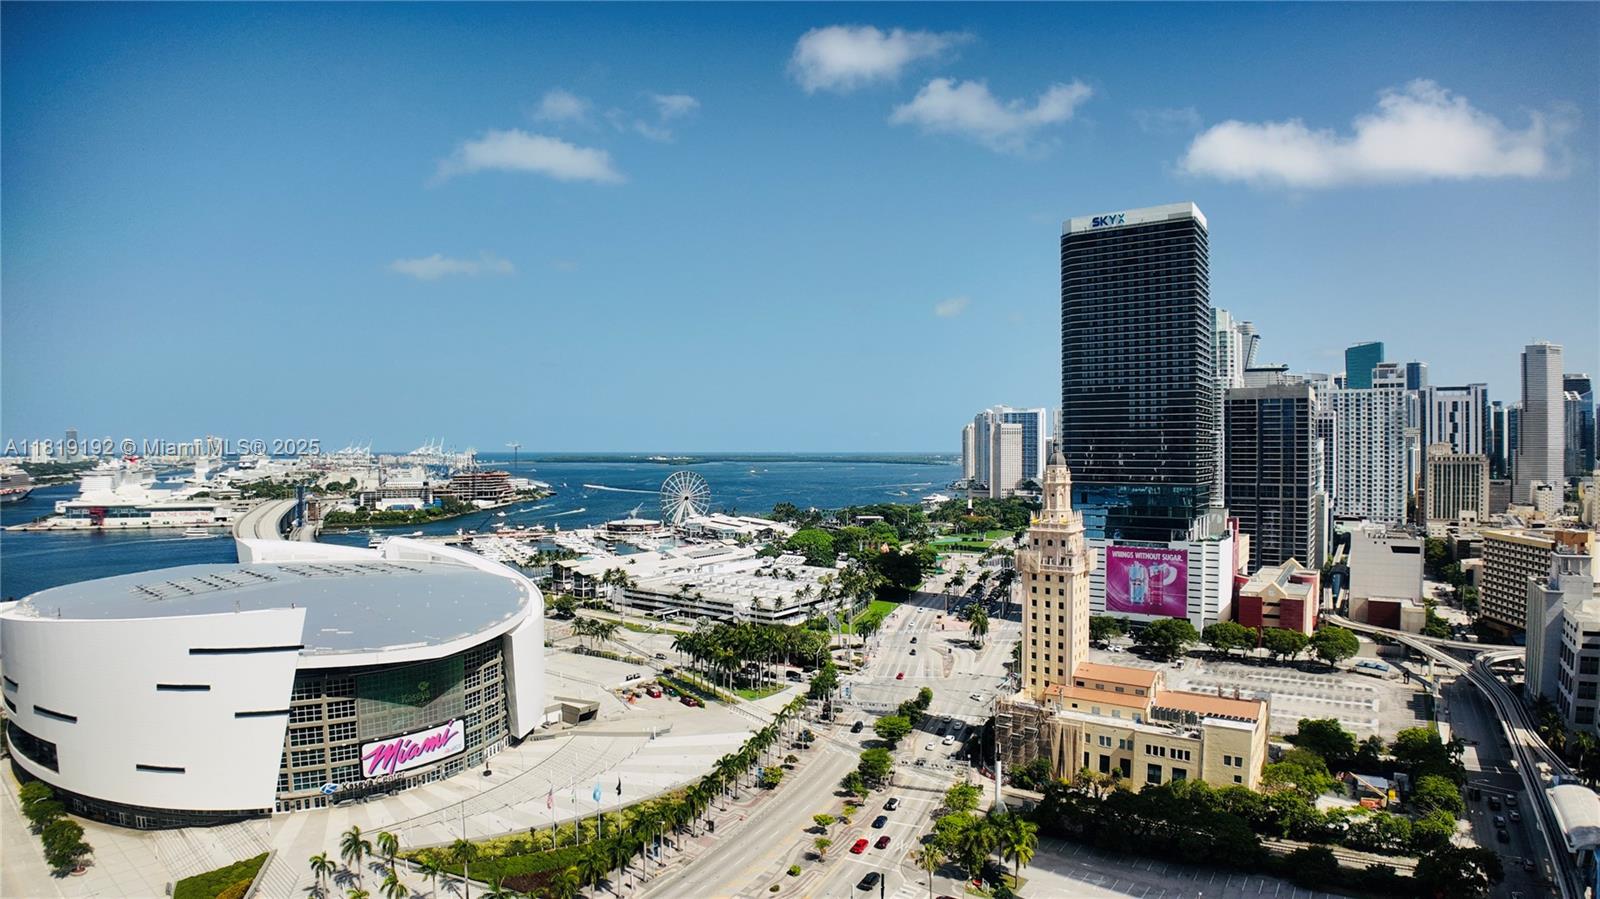
Active
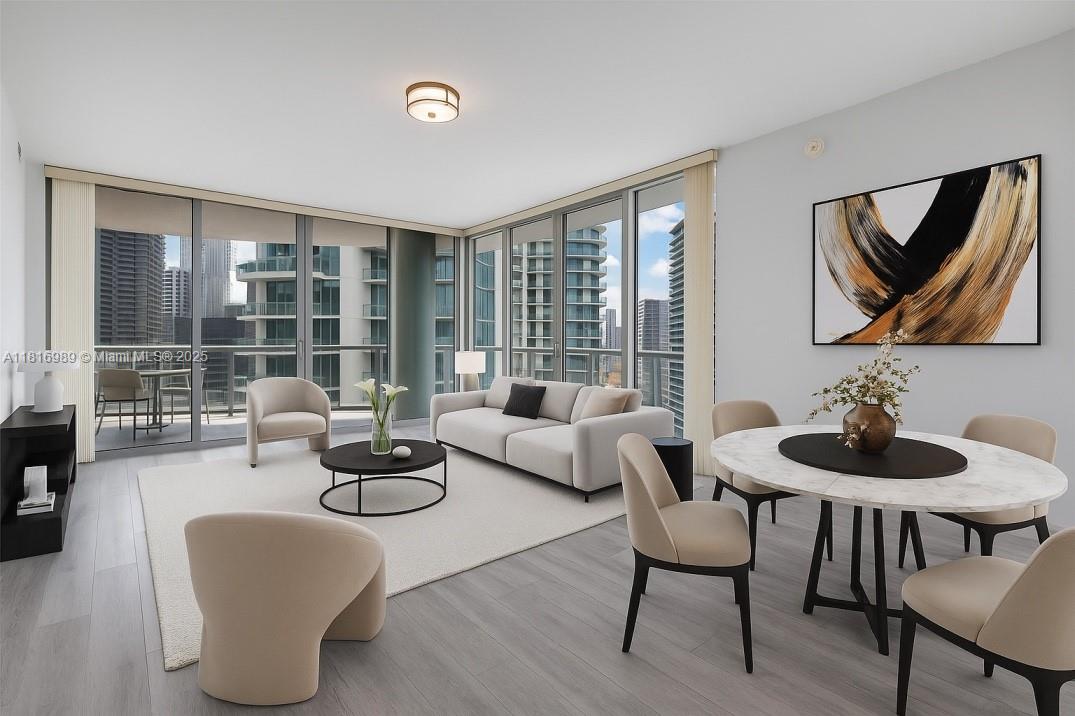
$1,320,000
2
bds
|
2
ba
|
1,347
sqft
|
built
2009
485 Brickell Ave, Miami, FL 33131
$-5,435
Cash flow
-21.5%
Cash-on-Cash Return
1.2%
Cap rate
0.5%
Rent to Value Ratio
Active
$315,000
1
bds
|
1
ba
|
596
sqft
|
built
1971
445 SW 11th St, Miami, FL 33130
$-922
Cash flow
-15.3%
Cash-on-Cash Return
2.6%
Cap rate
0.7%
Rent to Value Ratio
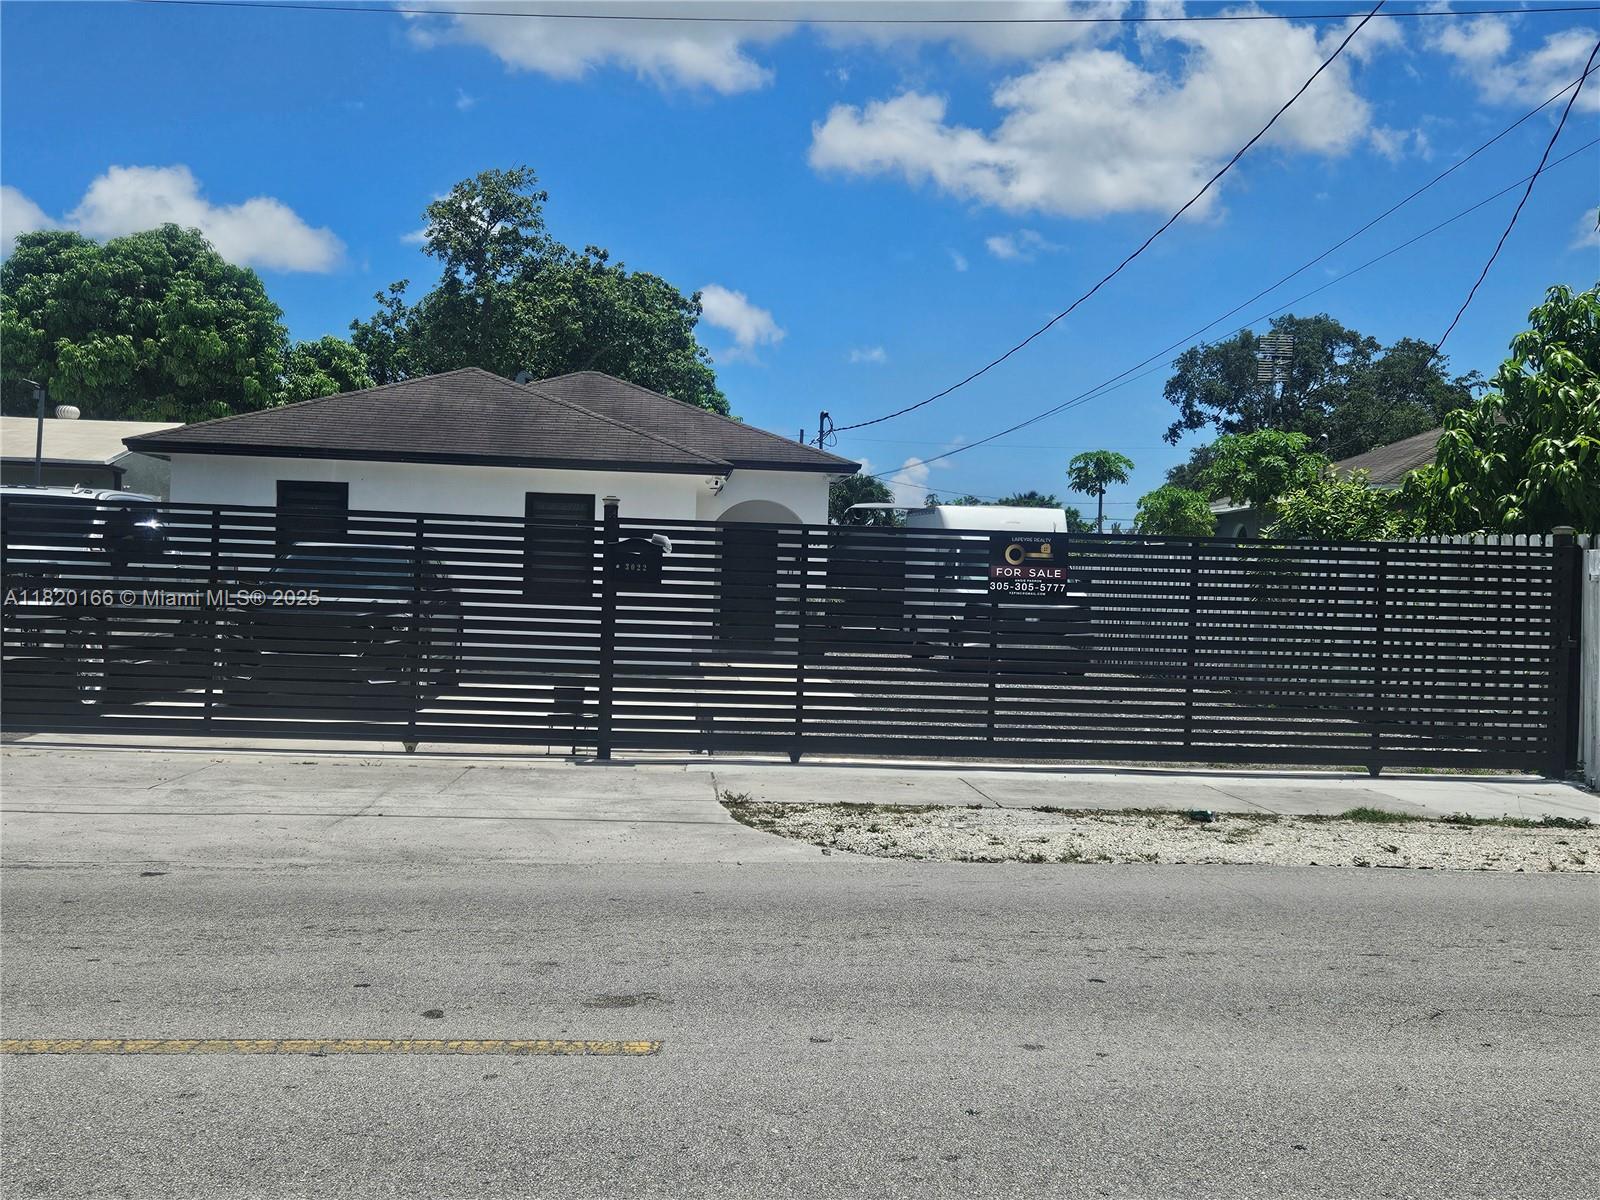
Active
$694,999
3
bds
|
2
ba
|
1,427
sqft
|
built
2007
3022 NW 95th St, Miami, FL 33147
$-2,293
Cash flow
-17.2%
Cash-on-Cash Return
2.2%
Cap rate
0.5%
Rent to Value Ratio
Active
$590,000
4
bds
|
0
ba
|
1,452
sqft
|
built
1954
6430 NE 1st Ct, Miami, FL 33138
$-1,305
Cash flow
-11.5%
Cash-on-Cash Return
3.5%
Cap rate
0.5%
Rent to Value Ratio
Active
$598,000
3
bds
|
2
ba
|
1,318
sqft
|
built
2003
19220 SW 119th Pl, Miami, FL 33177
$-1,351
Cash flow
-11.8%
Cash-on-Cash Return
3.4%
Cap rate
0.5%
Rent to Value Ratio
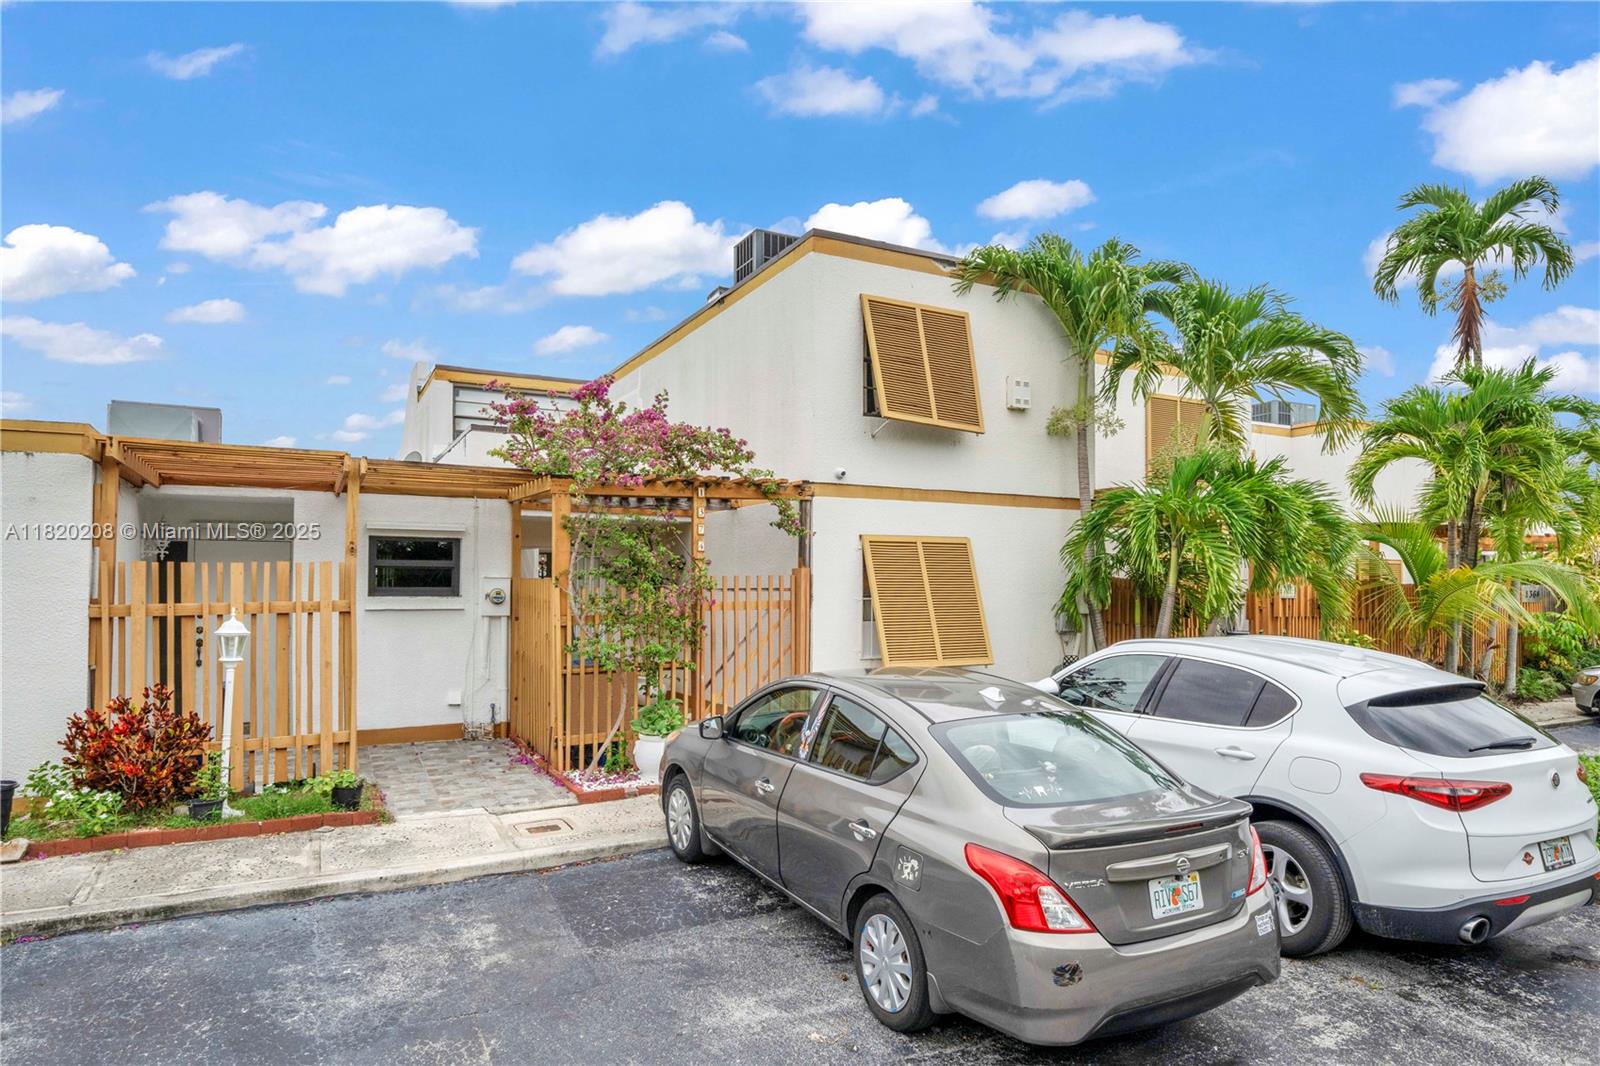
Active
$559,900
3
bds
|
3
ba
|
1,851
sqft
|
built
1979
1374 SW 131st Place Cir E, Miami, FL 33184
$-1,412
Cash flow
-13.2%
Cash-on-Cash Return
3.1%
Cap rate
0.6%
Rent to Value Ratio

Active
$850,000
3
bds
|
2
ba
|
1,767
sqft
|
built
1954
5959 SW 16th Ter, Miami, FL 33155
$-2,116
Cash flow
-13.0%
Cash-on-Cash Return
3.2%
Cap rate
0.4%
Rent to Value Ratio

Active
$610,000
2
bds
|
3
ba
|
1,158
sqft
|
built
2005
601 NE 36th St, Miami, FL 33137
$-2,113
Cash flow
-18.1%
Cash-on-Cash Return
2.0%
Cap rate
0.7%
Rent to Value Ratio
Active
$699,900
4
bds
|
0
ba
|
2,555
sqft
|
built
1952
9620 NW 26th Ave, Miami, FL 33147
$-2,325
Cash flow
-17.3%
Cash-on-Cash Return
2.2%
Cap rate
0.3%
Rent to Value Ratio

Active
$1,370,000
6
bds
|
0
ba
|
2,320
sqft
|
built
1984
43 NW 41st St, Miami, FL 33127
$-4,666
Cash flow
-17.8%
Cash-on-Cash Return
2.1%
Cap rate
0.3%
Rent to Value Ratio
Active
$769,900
3
bds
|
2
ba
|
2,118
sqft
|
built
1982
12821 SW 148th Street Rd, Miami, FL 33186
$-788
Cash flow
-5.3%
Cash-on-Cash Return
4.9%
Cap rate
0.6%
Rent to Value Ratio
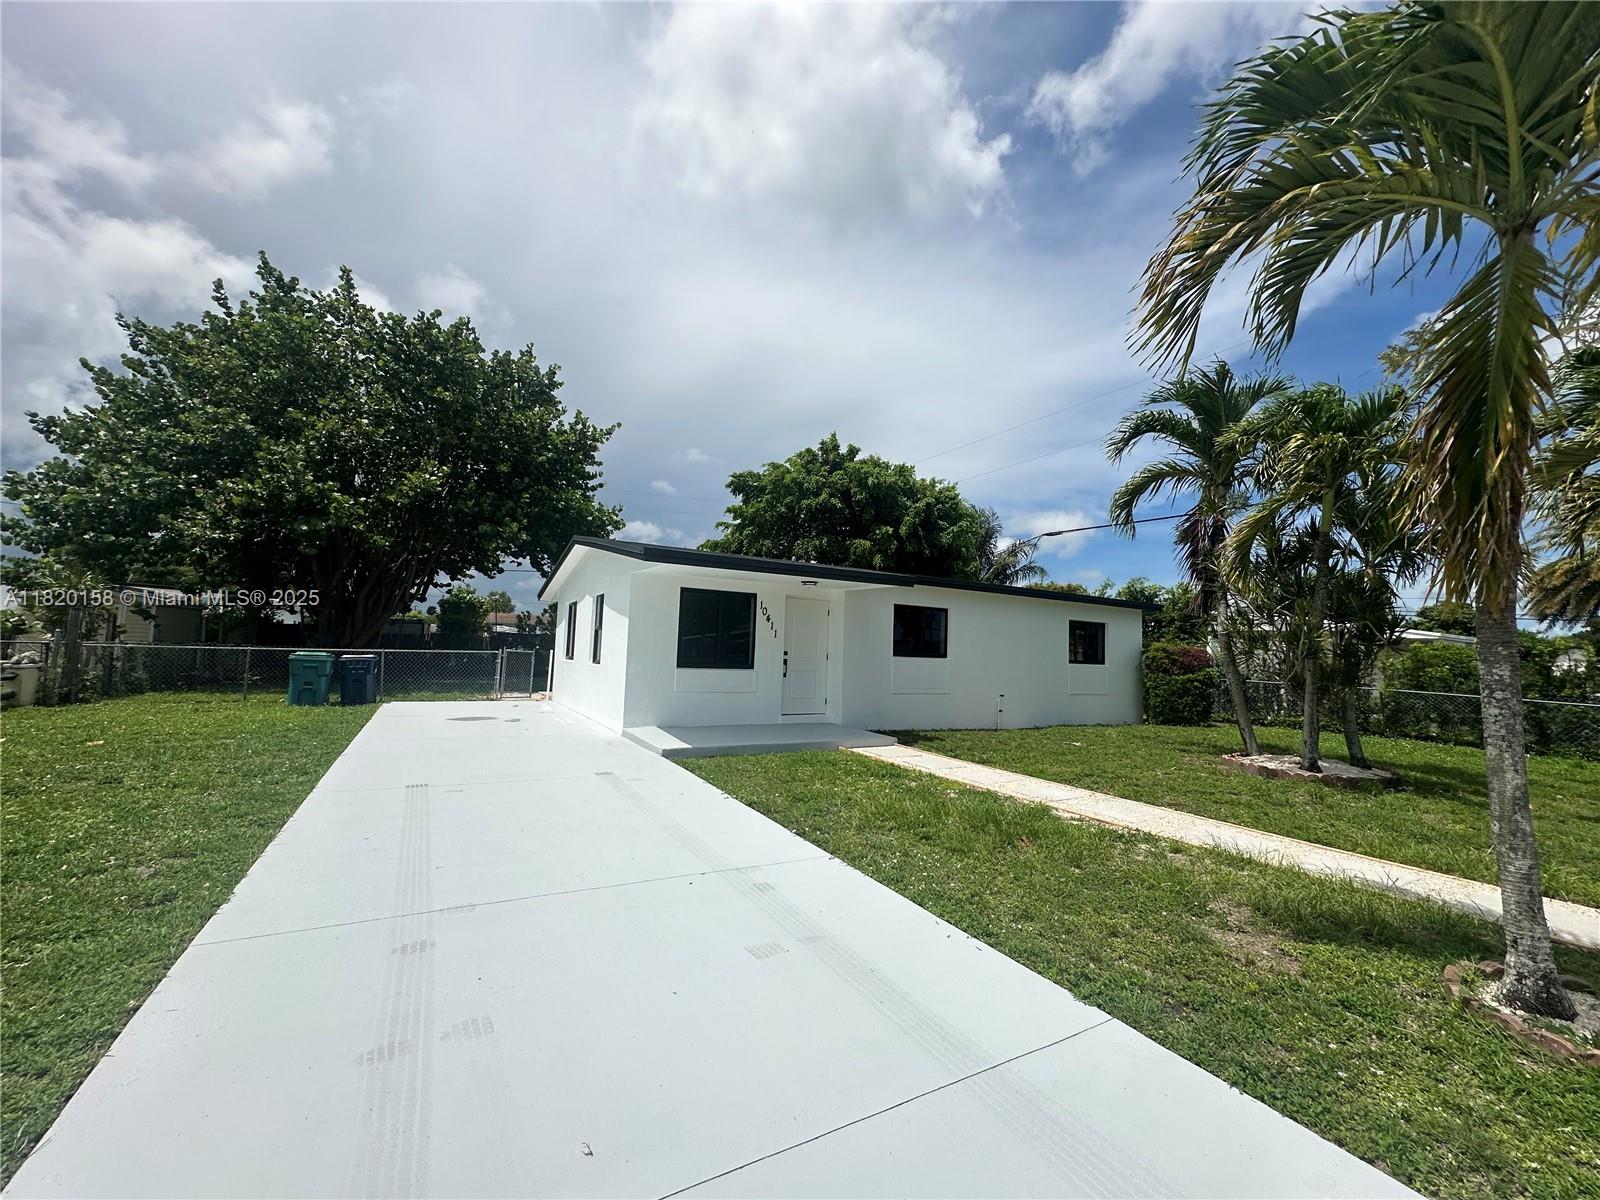
Active
$530,000
3
bds
|
2
ba
|
966
sqft
|
built
1964
10411 SW 151st Ter, Miami, FL 33176
$-1,027
Cash flow
-10.1%
Cash-on-Cash Return
3.8%
Cap rate
0.5%
Rent to Value Ratio
Active
$1,790,000
3
bds
|
3
ba
|
976
sqft
|
built
2022
398 NE 5th St, Miami, FL 33132
$-4,771
Cash flow
-13.9%
Cash-on-Cash Return
2.9%
Cap rate
0.6%
Rent to Value Ratio
Active
$440,000
1
bds
|
1
ba
|
706
sqft
|
built
2007
500 NE 29th St, Miami, FL 33137
$-1,749
Cash flow
-20.7%
Cash-on-Cash Return
1.4%
Cap rate
0.7%
Rent to Value Ratio
Active
$650,000
2
bds
|
3
ba
|
1,274
sqft
|
built
2008
90 SW 3rd St, Miami, FL 33130
$-2,584
Cash flow
-20.7%
Cash-on-Cash Return
1.4%
Cap rate
0.6%
Rent to Value Ratio
Active
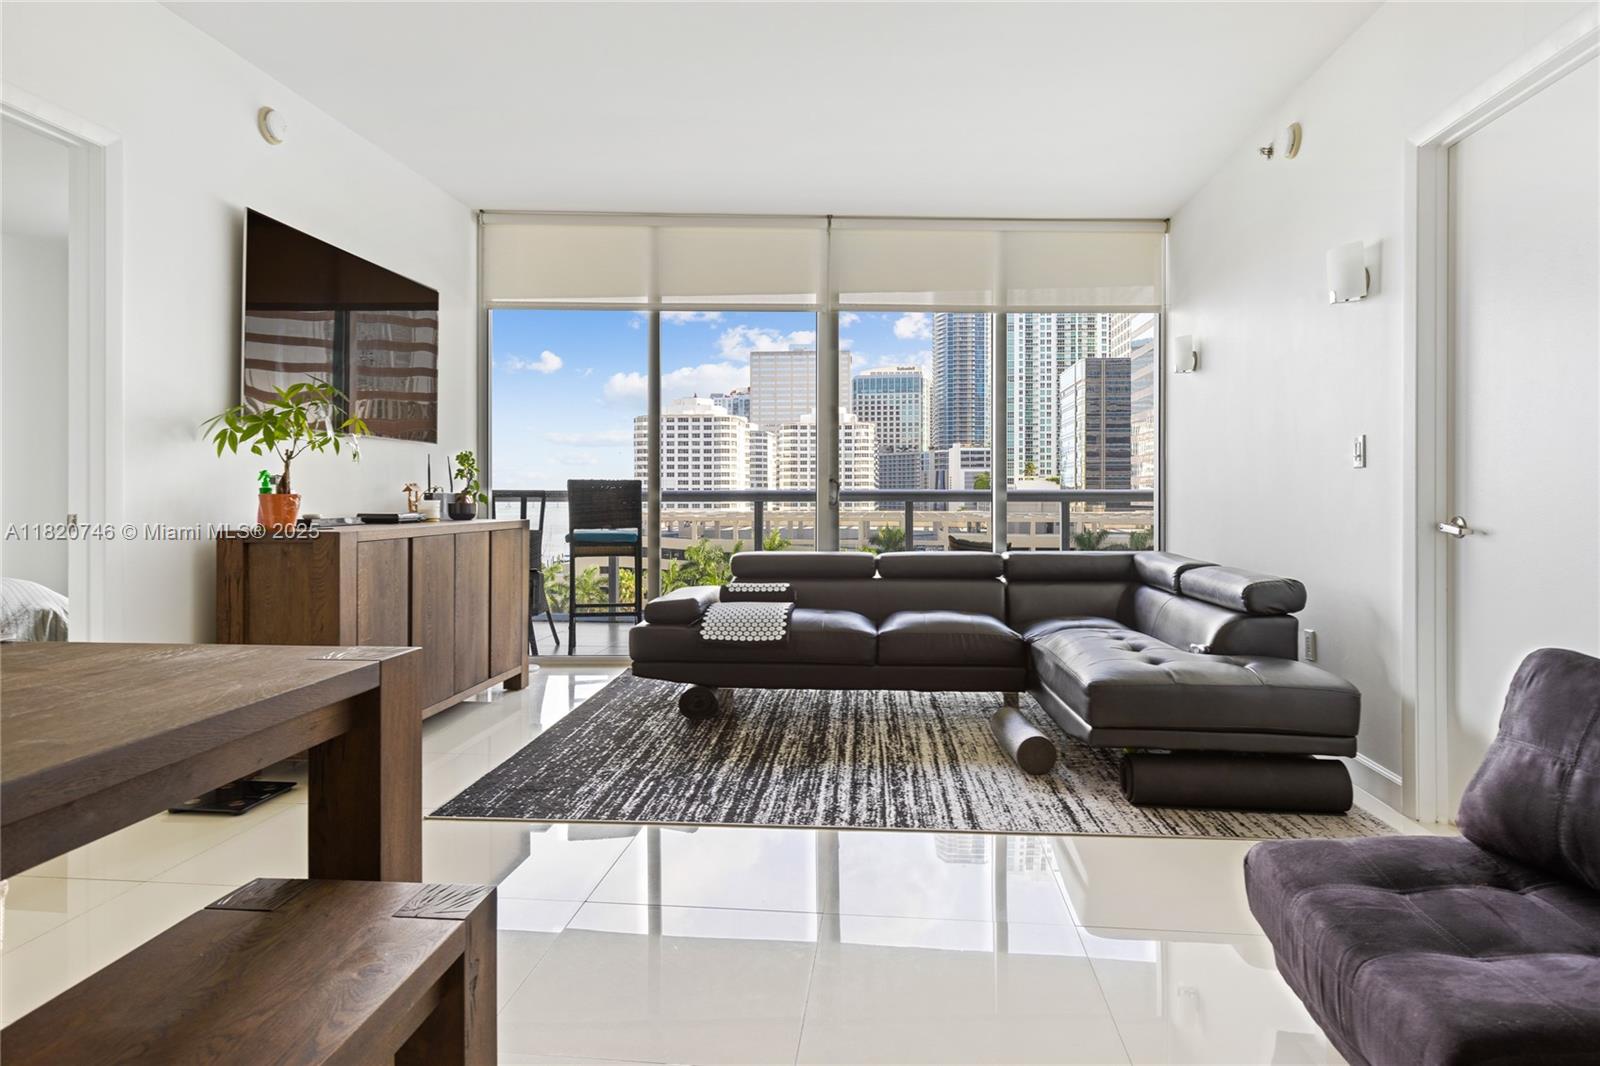
$730,000
2
bds
|
2
ba
|
1,450
sqft
|
built
2009
495 Brickell Ave, Miami, FL 33131
$-2,991
Cash flow
-21.4%
Cash-on-Cash Return
1.2%
Cap rate
0.8%
Rent to Value Ratio
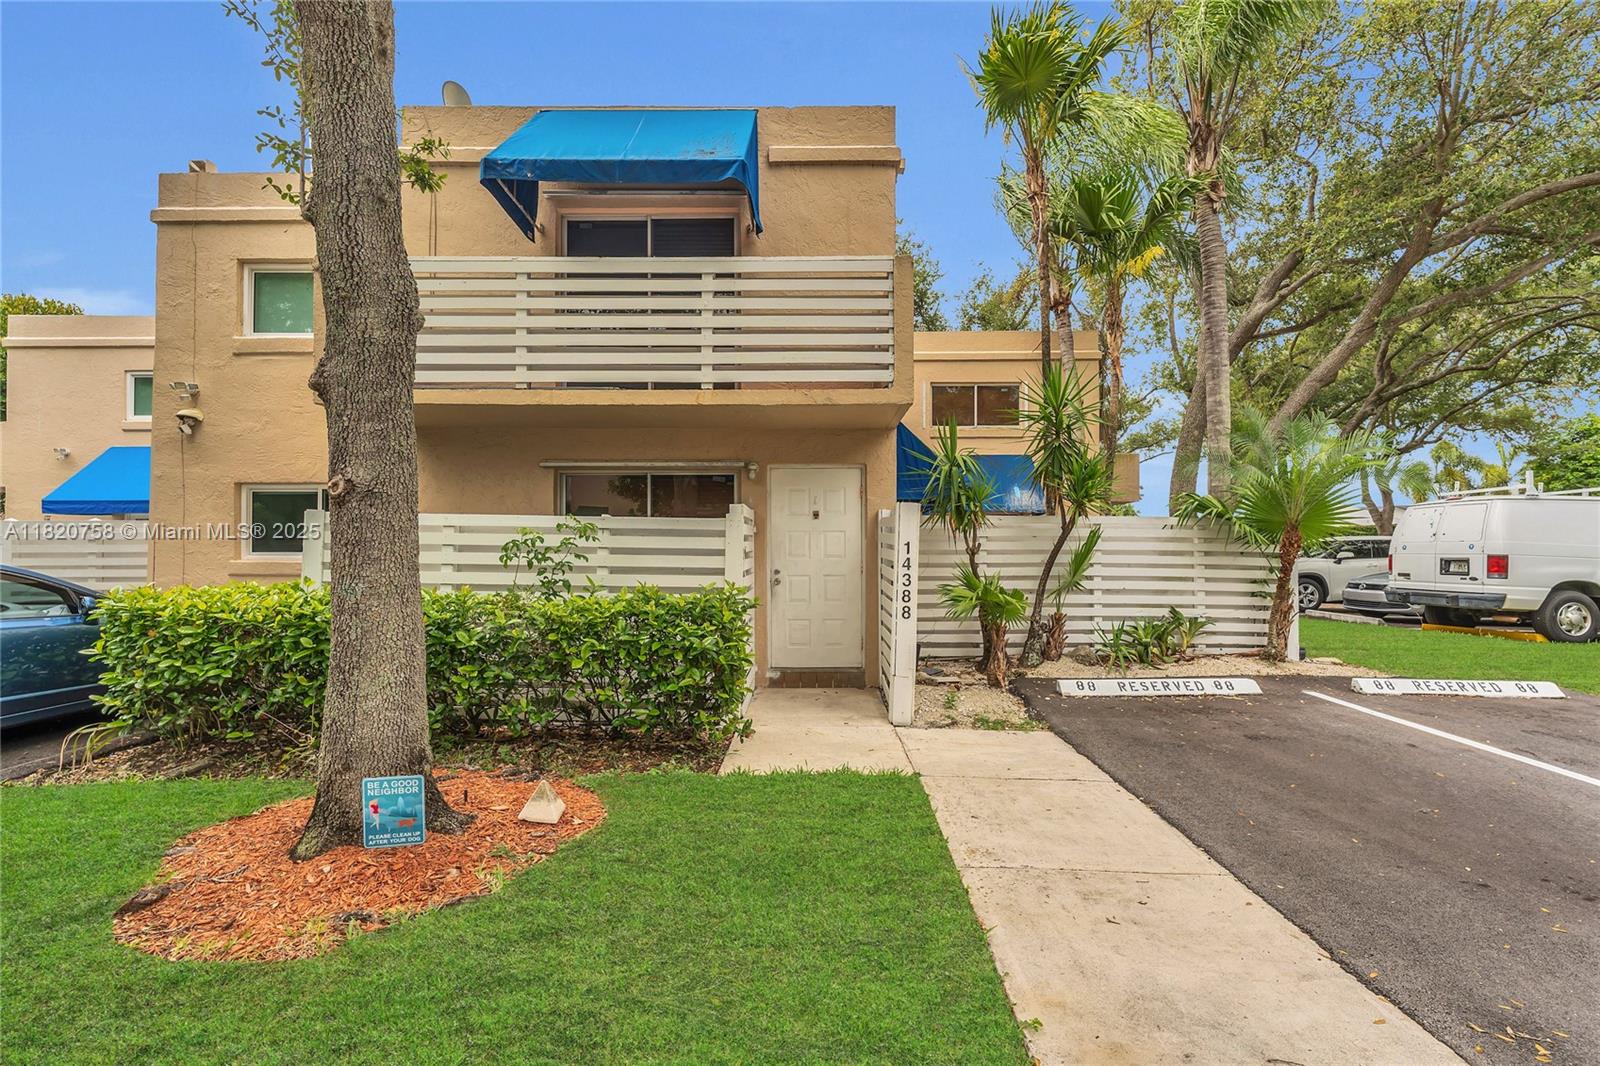
Active
$450,000
2
bds
|
3
ba
|
1,592
sqft
|
built
1985
14388 SW 96th Ln, Miami, FL 33186
$-1,045
Cash flow
-12.1%
Cash-on-Cash Return
3.4%
Cap rate
0.6%
Rent to Value Ratio
Active
$1,395,000
3
bds
|
2
ba
|
1,589
sqft
|
built
1968
6385 SW 25th St, Miami, FL 33155
$-4,300
Cash flow
-16.1%
Cash-on-Cash Return
2.4%
Cap rate
0.3%
Rent to Value Ratio
Active
$749,000
1
bds
|
2
ba
|
940
sqft
|
built
2019
480 NE 31st St, Miami, FL 33137
$-1,884
Cash flow
-13.1%
Cash-on-Cash Return
3.1%
Cap rate
0.7%
Rent to Value Ratio
Active
$800,000
2
bds
|
2
ba
|
1,315
sqft
|
built
2008
888 Biscayne Blvd, Miami, FL 33132
$-2,881
Cash flow
-18.8%
Cash-on-Cash Return
1.8%
Cap rate
0.6%
Rent to Value Ratio