Miami, FL Investment Properties for Sale
Browse homes for sale and investment properties in Miami, FL. Refine your search by price, property type, or more.
Best cash flowing properties in Miami, FL

Active
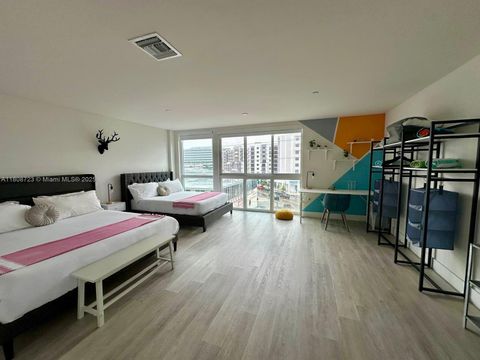
$199,000
1
bds
|
1
ba
|
550
sqft
|
built
1972
4301 NW South Tamiami Canal Dr, Miami, FL 33126
$-6
Cash flow
-0.2%
Cash-on-Cash Return
6.1%
Cap rate
0.9%
Rent to Value Ratio

Active
$280,000
2
bds
|
2
ba
|
1,330
sqft
|
built
1973
6821 SW 147th Ave, Miami, FL 33193
$-331
Cash flow
-6.2%
Cash-on-Cash Return
4.7%
Cap rate
0.9%
Rent to Value Ratio
6,092 out of 6,920 properties for sale in Miami, FL
Limited Results Shown
Create a free account, or log in to reveal all property listings and enjoy the complete experience.

Active
$479,000
1
bds
|
2
ba
|
700
sqft
|
built
1973
3025 Mary St, Miami, FL 33133
$-1,279
Cash flow
-13.9%
Cash-on-Cash Return
2.9%
Cap rate
0.6%
Rent to Value Ratio

Active
$659,500
3
bds
|
3
ba
|
2,104
sqft
|
built
1991
14474 SW 144th Ter, Miami, FL 33186
$-1,800
Cash flow
-14.2%
Cash-on-Cash Return
2.9%
Cap rate
0.5%
Rent to Value Ratio

Active
$595,000
4
bds
|
2
ba
|
1,612
sqft
|
built
1987
10813 SW 158th Ln, Miami, FL 33157
$-1,529
Cash flow
-13.4%
Cash-on-Cash Return
3.1%
Cap rate
0.5%
Rent to Value Ratio

Active
$525,000
3
bds
|
3
ba
|
1,368
sqft
|
built
2009
11921 SW 153rd Pl, Miami, FL 33196
$-1,229
Cash flow
-12.2%
Cash-on-Cash Return
3.3%
Cap rate
0.6%
Rent to Value Ratio

Active
$465,000
2
bds
|
2
ba
|
1,008
sqft
|
built
1981
6933 SW 152nd Ct, Miami, FL 33193
$-1,114
Cash flow
-12.5%
Cash-on-Cash Return
3.3%
Cap rate
0.6%
Rent to Value Ratio

Active
$925,000
3
bds
|
2
ba
|
1,416
sqft
|
built
2005
325 S Biscayne Blvd, Miami, FL 33131
$-3,153
Cash flow
-17.8%
Cash-on-Cash Return
2.1%
Cap rate
0.7%
Rent to Value Ratio

Active
$585,000
3
bds
|
3
ba
|
1,699
sqft
|
built
1997
10054 SW 163rd Ct, Miami, FL 33196
$-1,151
Cash flow
-10.3%
Cash-on-Cash Return
3.8%
Cap rate
0.5%
Rent to Value Ratio
Active
$830,000
3
bds
|
2
ba
|
1,427
sqft
|
built
2004
2000 N Bayshore Dr, Miami, FL 33137
$-1,891
Cash flow
-11.9%
Cash-on-Cash Return
3.4%
Cap rate
0.8%
Rent to Value Ratio

Pending
$415,000
2
bds
|
2
ba
|
1,000
sqft
|
built
2008
7280 SW 90th St, Miami, FL 33156
$-1,572
Cash flow
-19.8%
Cash-on-Cash Return
1.6%
Cap rate
0.7%
Rent to Value Ratio

Active
$585,000
4
bds
|
3
ba
|
1,820
sqft
|
built
2023
12949 NW 23rd Pl, Miami, FL 33167
$-1,524
Cash flow
-13.6%
Cash-on-Cash Return
3.0%
Cap rate
0.6%
Rent to Value Ratio

Active
$439,000
3
bds
|
2
ba
|
1,177
sqft
|
built
2002
9340 Fontainebleau Blvd, Miami, FL 33172
$-1,110
Cash flow
-13.2%
Cash-on-Cash Return
3.1%
Cap rate
0.6%
Rent to Value Ratio

Active
$1,145,000
2
bds
|
2
ba
|
1,088
sqft
|
built
2018
3131 NE 7th Ave, Miami, FL 33137
$-4,489
Cash flow
-20.5%
Cash-on-Cash Return
1.4%
Cap rate
0.5%
Rent to Value Ratio

Active
$349,900
2
bds
|
2
ba
|
1,340
sqft
|
built
1984
9255 SW 125th Ave, Miami, FL 33186
$-1,315
Cash flow
-19.6%
Cash-on-Cash Return
1.6%
Cap rate
0.7%
Rent to Value Ratio

Active
$825,000
4
bds
|
3
ba
|
1,468
sqft
|
built
1976
13320 SW 99th St, Miami, FL 33186
$-2,037
Cash flow
-12.9%
Cash-on-Cash Return
3.2%
Cap rate
0.5%
Rent to Value Ratio

Active
$519,900
3
bds
|
3
ba
|
1,848
sqft
|
built
1996
7081 SW 158th Ct, Miami, FL 33193
$-767
Cash flow
-7.7%
Cash-on-Cash Return
4.4%
Cap rate
0.6%
Rent to Value Ratio
Active
$550,000
3
bds
|
2
ba
|
1,260
sqft
|
built
1950
1200 NW 87th St, Miami, FL 33147
$-1,181
Cash flow
-11.2%
Cash-on-Cash Return
3.6%
Cap rate
0.6%
Rent to Value Ratio

Active
$785,000
4
bds
|
2
ba
|
2,173
sqft
|
built
1987
16361 SW 114th Ct, Miami, FL 33157
$-1,566
Cash flow
-10.4%
Cash-on-Cash Return
3.8%
Cap rate
0.5%
Rent to Value Ratio
Active
$234,900
2
bds
|
2
ba
|
1,350
sqft
|
built
1973
10900 SW 104th St, Miami, FL 33176
$-764
Cash flow
-17.0%
Cash-on-Cash Return
2.2%
Cap rate
1.0%
Rent to Value Ratio

Active
$399,000
2
bds
|
3
ba
|
1,025
sqft
|
built
1986
6870 SW 45th Ln, Miami, FL 33155
$-850
Cash flow
-11.1%
Cash-on-Cash Return
3.6%
Cap rate
0.7%
Rent to Value Ratio

Active
$375,000
1
bds
|
1
ba
|
736
sqft
|
built
2008
90 SW 3rd St, Miami, FL 33130
$-1,185
Cash flow
-16.5%
Cash-on-Cash Return
2.4%
Cap rate
0.7%
Rent to Value Ratio
Active
$280,000
2
bds
|
2
ba
|
1,330
sqft
|
built
1973
6821 SW 147th Ave, Miami, FL 33193
$-331
Cash flow
-6.2%
Cash-on-Cash Return
4.7%
Cap rate
0.9%
Rent to Value Ratio

Active
$748,900
2
bds
|
2
ba
|
1,362
sqft
|
built
1975
1865 Brickell Ave, Miami, FL 33129
$-2,698
Cash flow
-18.8%
Cash-on-Cash Return
1.8%
Cap rate
0.6%
Rent to Value Ratio
Active
$975,000
4
bds
|
3
ba
|
3,083
sqft
|
built
1990
14870 SW 152nd Ct, Miami, FL 33196
$-1,835
Cash flow
-9.8%
Cash-on-Cash Return
3.9%
Cap rate
0.6%
Rent to Value Ratio

Active
$370,000
2
bds
|
2
ba
|
914
sqft
|
built
1989
850 N Miami Ave, Miami, FL 33136
$-1,344
Cash flow
-19.0%
Cash-on-Cash Return
1.8%
Cap rate
0.8%
Rent to Value Ratio

Active
$490,000
1
bds
|
2
ba
|
1,053
sqft
|
built
2008
1060 Brickell Ave, Miami, FL 33131
$-1,971
Cash flow
-21.0%
Cash-on-Cash Return
1.3%
Cap rate
0.7%
Rent to Value Ratio

Active
$660,000
4
bds
|
3
ba
|
1,471
sqft
|
built
1959
12455 SW 187th Ter, Miami, FL 33177
$-1,358
Cash flow
-10.7%
Cash-on-Cash Return
3.7%
Cap rate
0.5%
Rent to Value Ratio

Active
$499,999
4
bds
|
3
ba
|
1,898
sqft
|
built
2016
17612 SW 153rd Ave, Miami, FL 33187
$-1,086
Cash flow
-11.3%
Cash-on-Cash Return
3.5%
Cap rate
0.6%
Rent to Value Ratio

Active
$385,000
3
bds
|
3
ba
|
1,232
sqft
|
built
1987
11890 SW 18th Ter, Miami, FL 33175
$-936
Cash flow
-12.7%
Cash-on-Cash Return
3.2%
Cap rate
0.6%
Rent to Value Ratio
Active
$382,000
bds
|
1
ba
|
964
sqft
|
built
2021
19380 NE 26th Ave, Miami, FL 33180
$-871
Cash flow
-11.9%
Cash-on-Cash Return
3.4%
Cap rate
0.7%
Rent to Value Ratio

Active
$485,000
2
bds
|
2
ba
|
1,340
sqft
|
built
1990
20185 E Country Club Dr, Miami, FL 33180
$-1,965
Cash flow
-21.1%
Cash-on-Cash Return
1.3%
Cap rate
0.7%
Rent to Value Ratio
Active
$1,799,000
3
bds
|
2
ba
|
2,389
sqft
|
built
1947
1771 Wa Kee Na Dr, Miami, FL 33133
$-5,659
Cash flow
-16.4%
Cash-on-Cash Return
2.4%
Cap rate
0.3%
Rent to Value Ratio

Active
$397,000
3
bds
|
3
ba
|
1,330
sqft
|
built
1979
6977 SW 115th Pl, Miami, FL 33173
$-1,182
Cash flow
-15.5%
Cash-on-Cash Return
2.6%
Cap rate
0.8%
Rent to Value Ratio
Active
$400,000
2
bds
|
2
ba
|
975
sqft
|
built
2010
1861 NW South River Dr, Miami, FL 33125
$-52,691
Cash flow
-687.3%
Cash-on-Cash Return
-151.9%
Cap rate
0.7%
Rent to Value Ratio

Active
$239,900
2
bds
|
2
ba
|
1,222
sqft
|
built
1973
665 NE 195th St, Miami, FL 33179
$-468
Cash flow
-10.2%
Cash-on-Cash Return
3.8%
Cap rate
1.0%
Rent to Value Ratio

Active
$1,450,000
3
bds
|
0
ba
|
1,326
sqft
|
built
1952
90 NW 33rd St, Miami, FL 33127
$-5,069
Cash flow
-18.2%
Cash-on-Cash Return
2.0%
Cap rate
0.4%
Rent to Value Ratio

Active
$318,000
2
bds
|
1
ba
|
900
sqft
|
built
1971
1800 SW 25th St, Miami, FL 33133
$-882
Cash flow
-14.5%
Cash-on-Cash Return
2.8%
Cap rate
0.7%
Rent to Value Ratio

Active
$750,000
3
bds
|
2
ba
|
1,777
sqft
|
built
1990
10213 SW 156th Ave, Miami, FL 33196
$-2,001
Cash flow
-13.9%
Cash-on-Cash Return
2.9%
Cap rate
0.5%
Rent to Value Ratio
Active
$199,000
1
bds
|
1
ba
|
550
sqft
|
built
1972
4301 NW South Tamiami Canal Dr, Miami, FL 33126
$-6
Cash flow
-0.2%
Cash-on-Cash Return
6.1%
Cap rate
0.9%
Rent to Value Ratio

Active
$550,000
1
bds
|
2
ba
|
1,064
sqft
|
built
1975
1901 Brickell Ave, Miami, FL 33129
$-1,524
Cash flow
-14.5%
Cash-on-Cash Return
2.8%
Cap rate
0.6%
Rent to Value Ratio

Active
$370,000
0
bds
|
1
ba
|
567
sqft
|
built
2007
50 Biscayne Blvd, Miami, FL 33132
$-985
Cash flow
-13.9%
Cash-on-Cash Return
3.0%
Cap rate
0.8%
Rent to Value Ratio