Miami, FL Investment Properties for Sale
Browse homes for sale and investment properties in Miami, FL. Refine your search by price, property type, or more.
Best cash flowing properties in Miami, FL
Active
$199,000
1
bds
|
1
ba
|
550
sqft
|
built
1972
4301 NW South Tamiami Canal Dr, Miami, FL 33126
$-6
Cash flow
-0.2%
Cash-on-Cash Return
6.1%
Cap rate
0.9%
Rent to Value Ratio
Active
$275,000
2
bds
|
2
ba
|
840
sqft
|
built
1973
9300 W Flagler St, Miami, FL 33174
$-373
Cash flow
-7.1%
Cash-on-Cash Return
4.5%
Cap rate
0.8%
Rent to Value Ratio
6,163 out of 6,996 properties for sale in Miami, FL
Limited Results Shown
Create a free account, or log in to reveal all property listings and enjoy the complete experience.
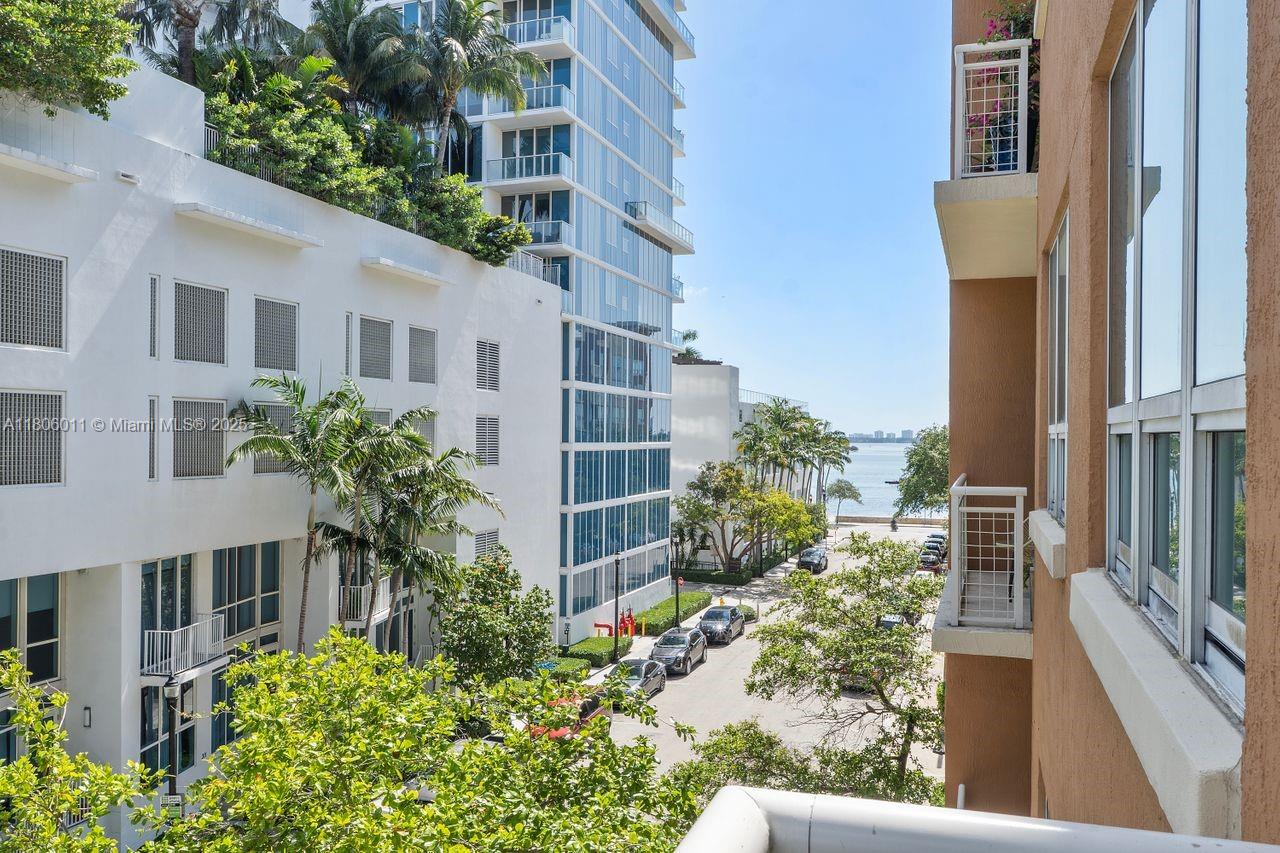
Active
$550,000
1
bds
|
2
ba
|
1,064
sqft
|
built
1975
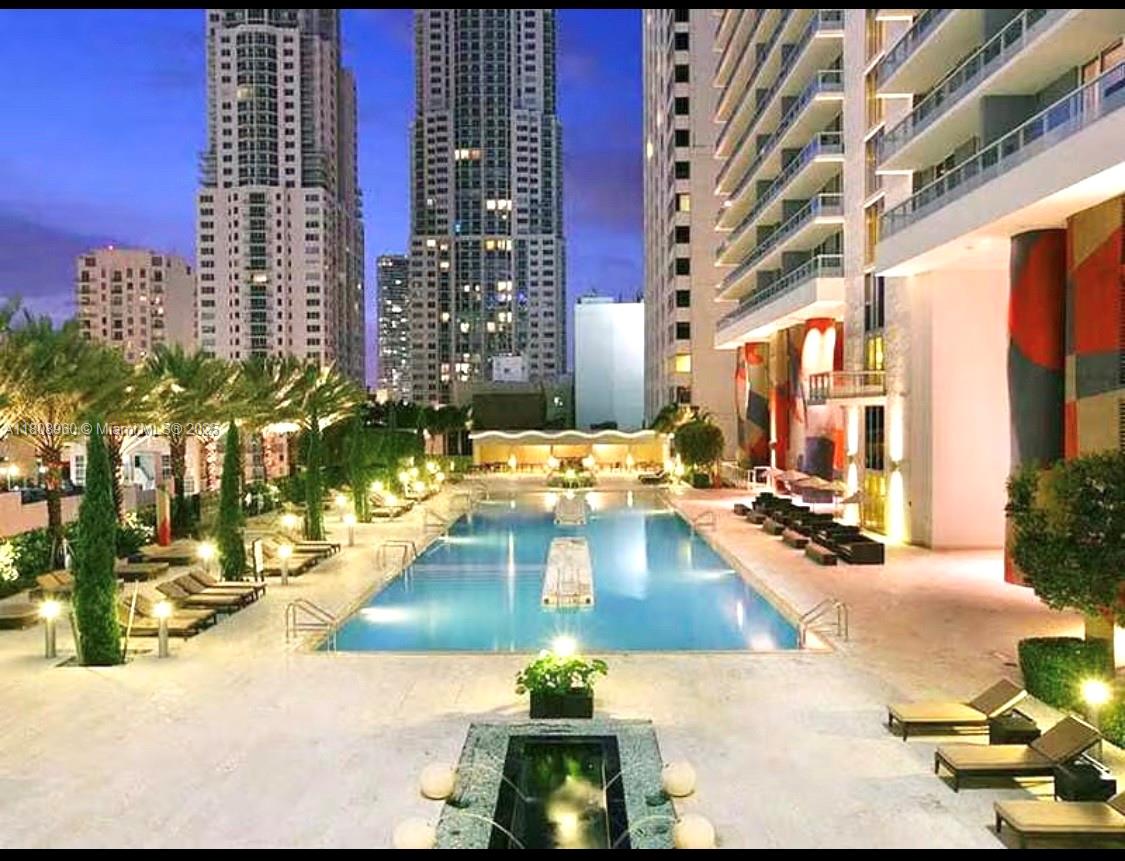
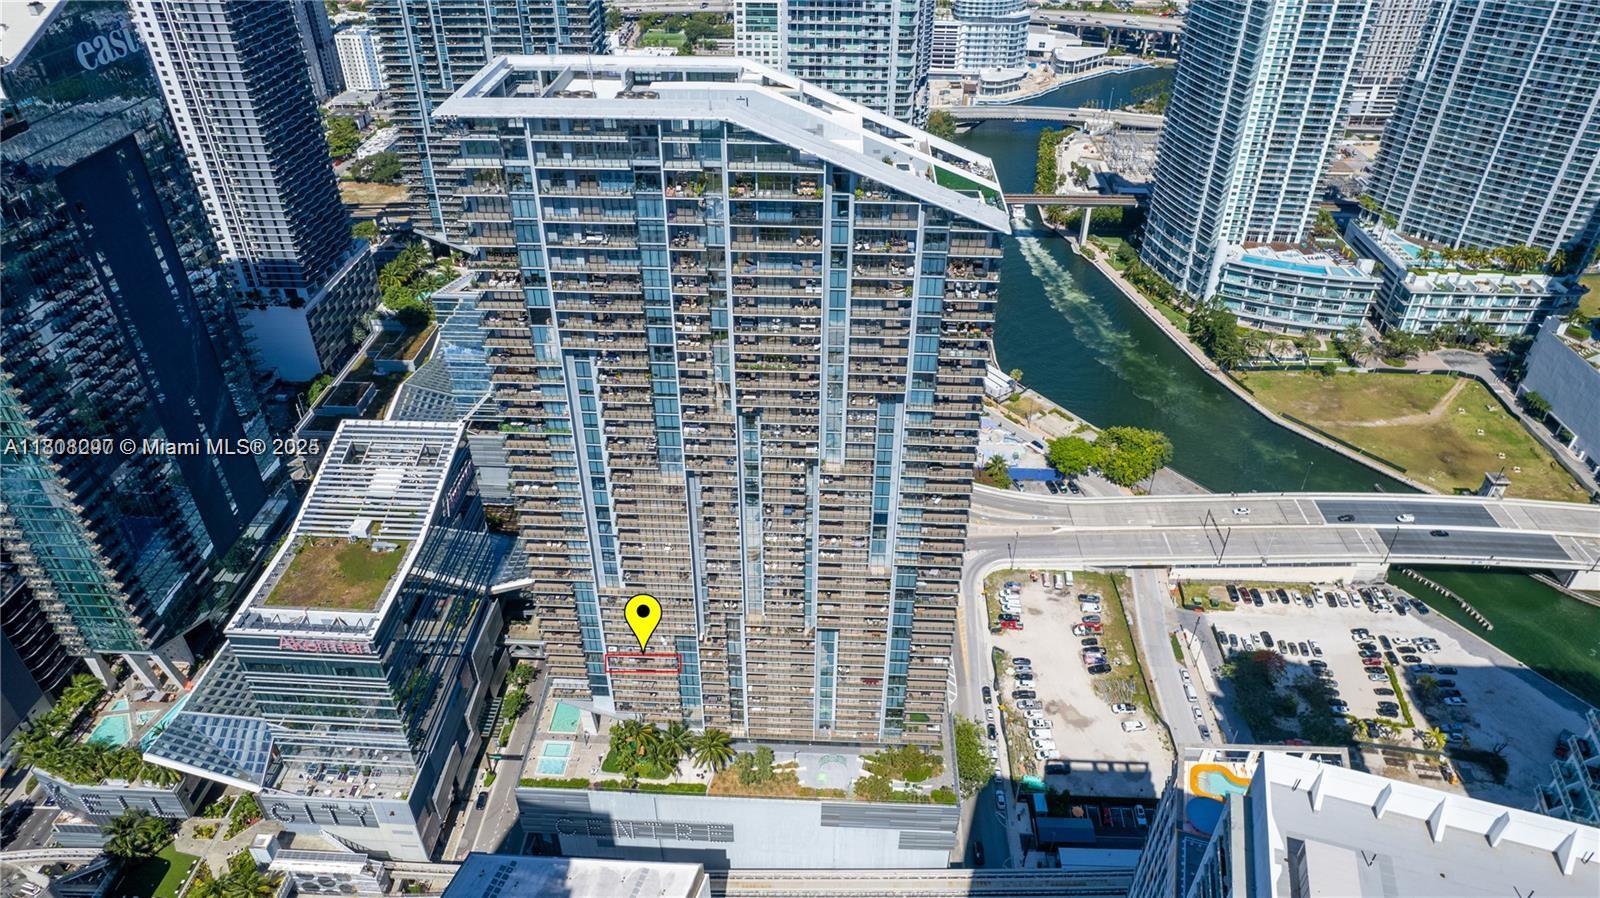
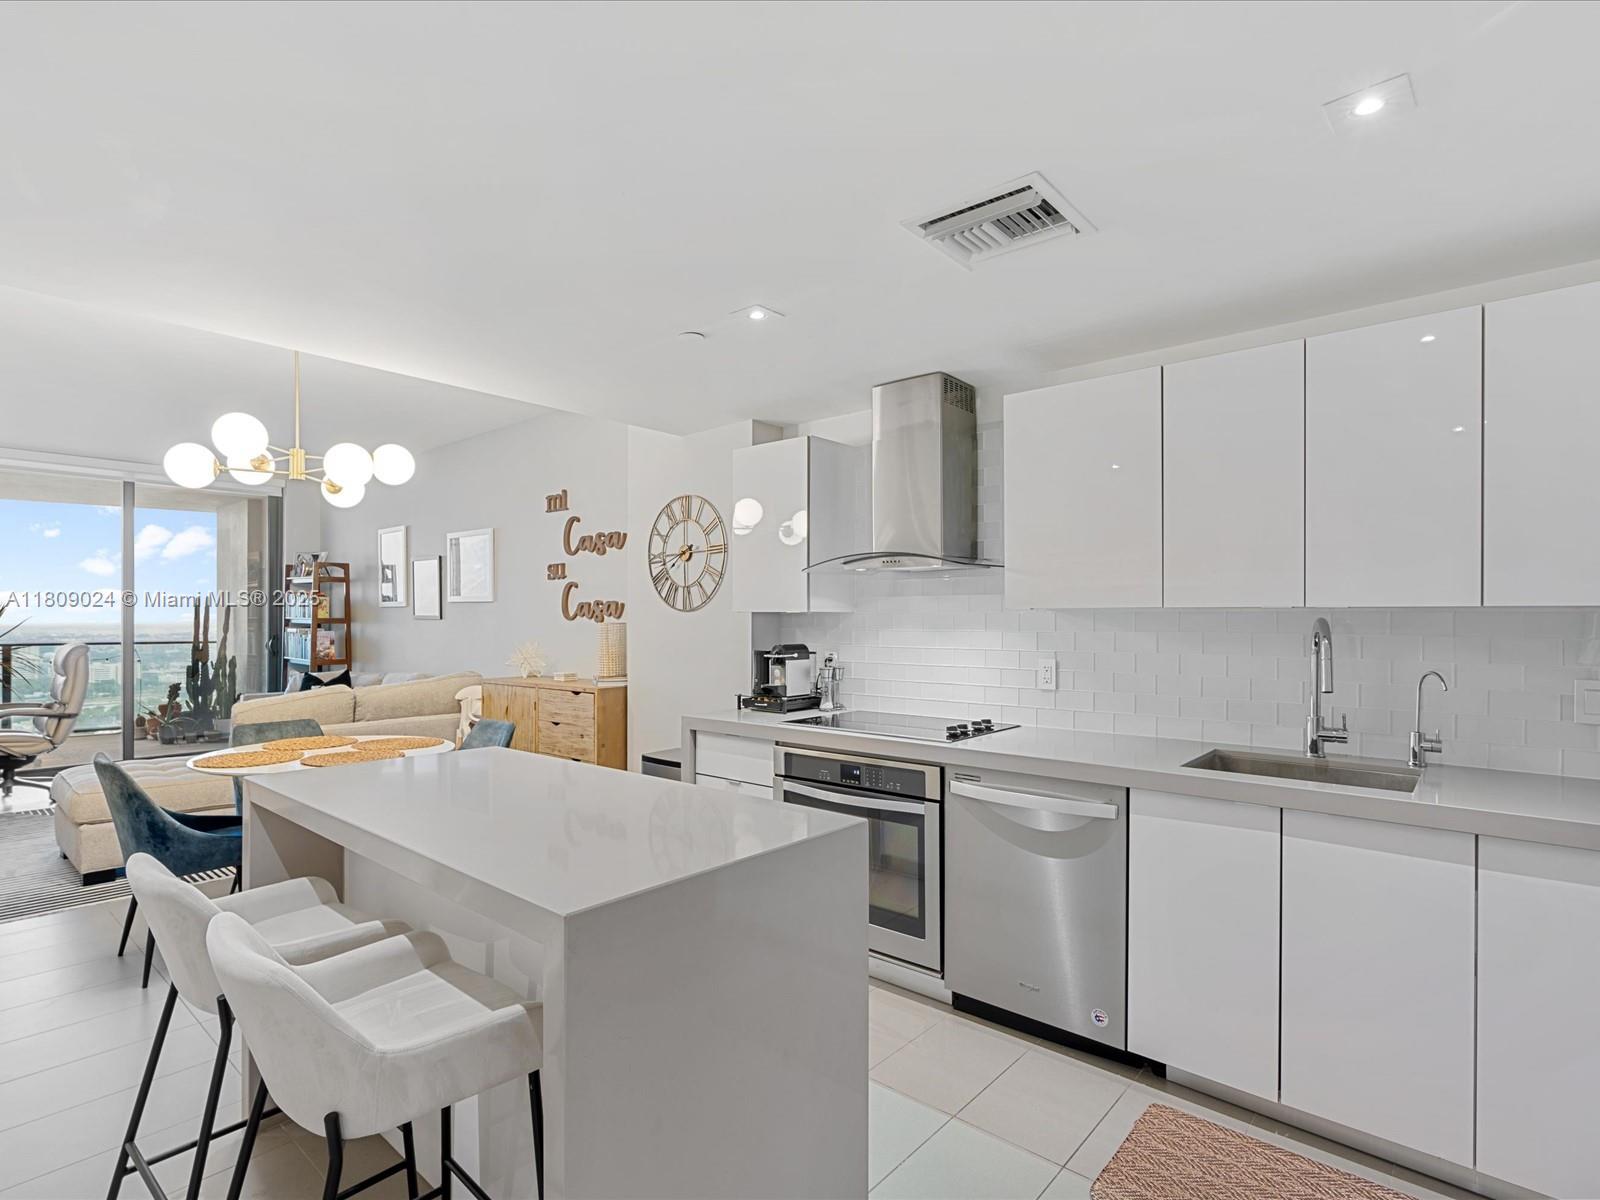
1901 Brickell Ave, Miami, FL 33129
$-1,524
Cash flow
-14.5%
Cash-on-Cash Return
2.8%
Cap rate
0.6%
Rent to Value Ratio
Active
$199,000
1
bds
|
1
ba
|
550
sqft
|
built
1972
4301 NW South Tamiami Canal Dr, Miami, FL 33126
$-6
Cash flow
-0.2%
Cash-on-Cash Return
6.1%
Cap rate
0.9%
Rent to Value Ratio
Active
$750,000
3
bds
|
2
ba
|
1,777
sqft
|
built
1990
10213 SW 156th Ave, Miami, FL 33196
$-2,001
Cash flow
-13.9%
Cash-on-Cash Return
2.9%
Cap rate
0.5%
Rent to Value Ratio
Active
$1,450,000
3
bds
|
0
ba
|
1,326
sqft
|
built
1952
90 NW 33rd St, Miami, FL 33127
$-5,069
Cash flow
-18.2%
Cash-on-Cash Return
2.0%
Cap rate
0.4%
Rent to Value Ratio
Active
$318,000
2
bds
|
1
ba
|
900
sqft
|
built
1971
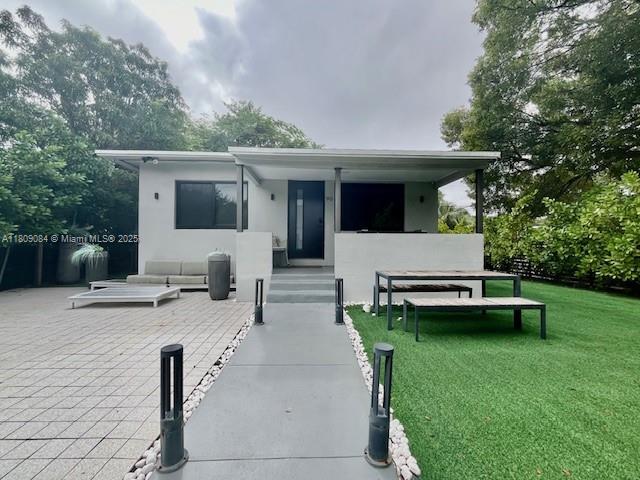
1800 SW 25th St, Miami, FL 33133
$-882
Cash flow
-14.5%
Cash-on-Cash Return
2.8%
Cap rate
0.7%
Rent to Value Ratio
Active
$370,000
0
bds
|
1
ba
|
567
sqft
|
built
2007
50 Biscayne Blvd, Miami, FL 33132
$-985
Cash flow
-13.9%
Cash-on-Cash Return
3.0%
Cap rate
0.8%
Rent to Value Ratio
Active
$379,000
2
bds
|
1
ba
|
840
sqft
|
built
1948
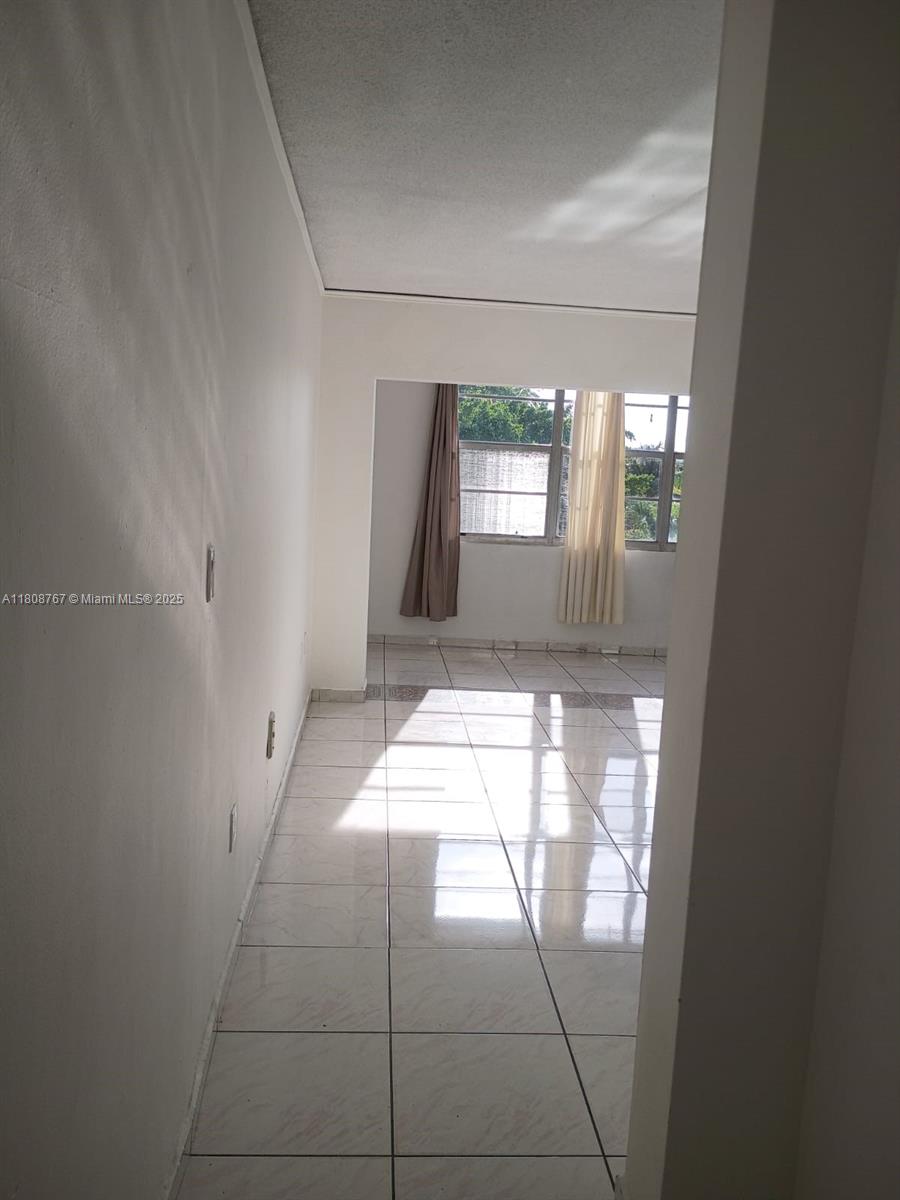
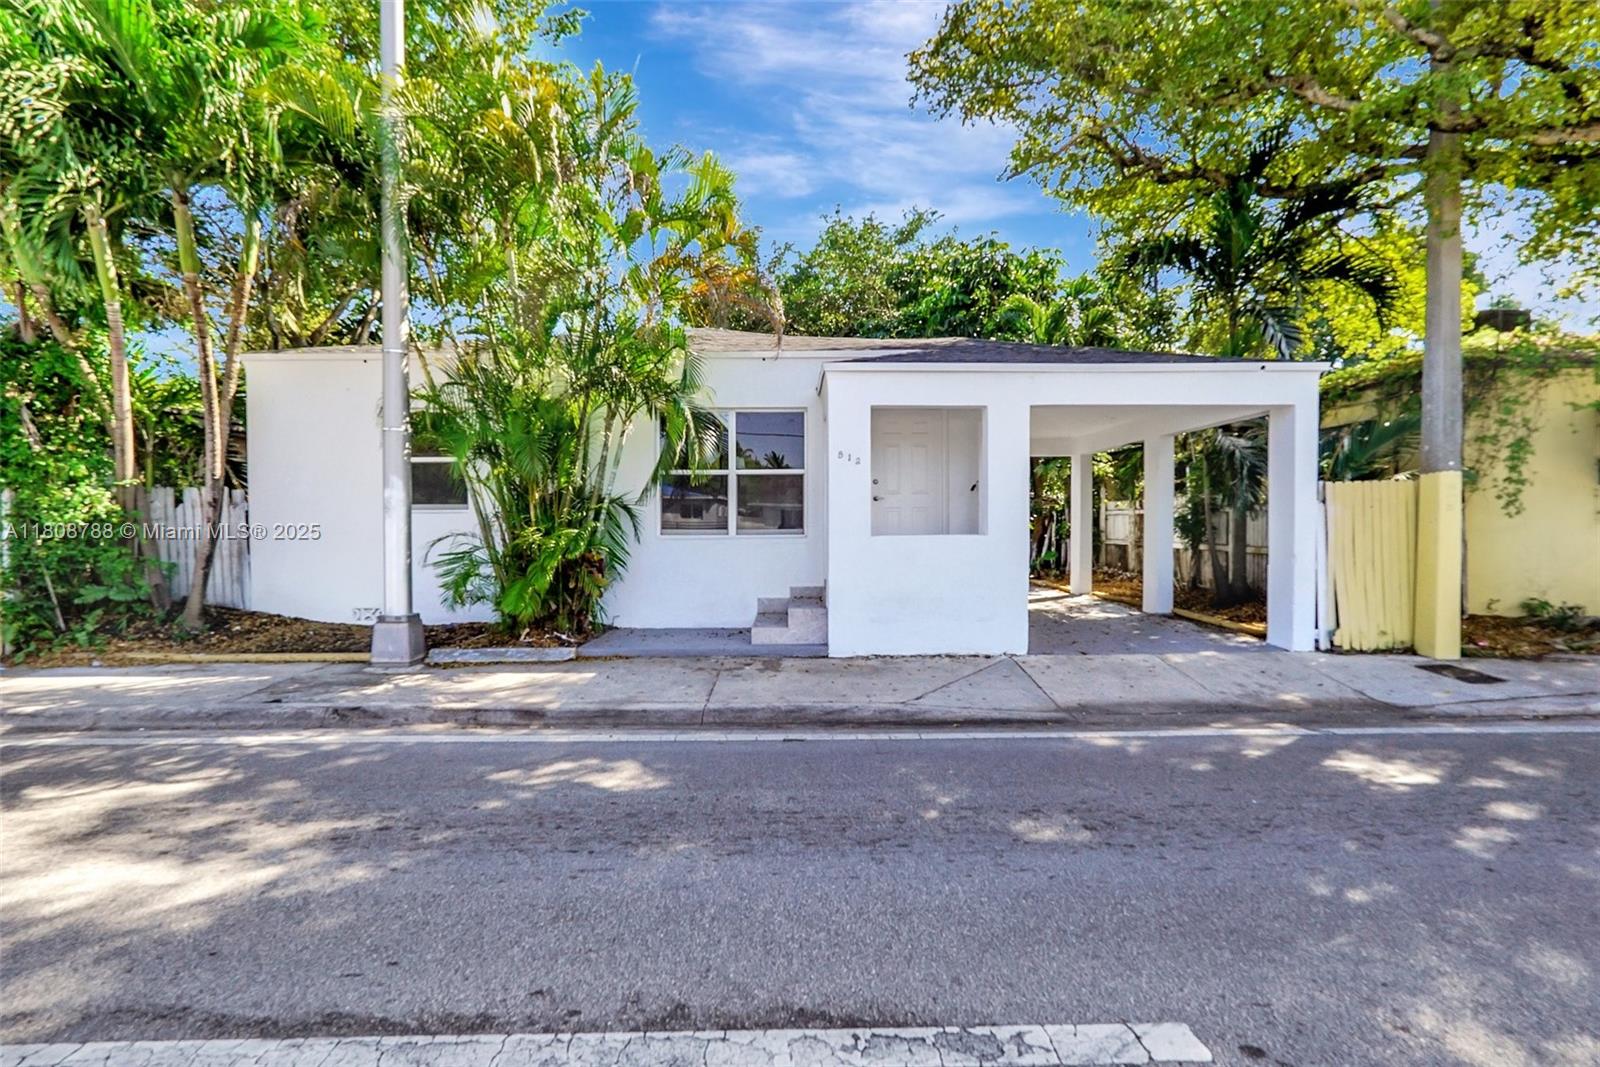
812 NW 103rd St, Miami, FL 33150
$-829
Cash flow
-11.4%
Cash-on-Cash Return
3.5%
Cap rate
0.6%
Rent to Value Ratio

Active
$589,900
2
bds
|
2
ba
|
967
sqft
|
built
1974
200 SE 15th Rd, Miami, FL 33129
$-2,377
Cash flow
-21.0%
Cash-on-Cash Return
1.3%
Cap rate
0.7%
Rent to Value Ratio
Active
$1,690,000
3
bds
|
4
ba
|
1,856
sqft
|
built
2016
68 SE 6th St, Miami, FL 33131
$-7,206
Cash flow
-22.2%
Cash-on-Cash Return
1.0%
Cap rate
0.5%
Rent to Value Ratio
Active
$389,000
bds
|
1
ba
|
980
sqft
|
built
2021
19380 NE 26th Ave, Miami, FL 33180
$-906
Cash flow
-12.2%
Cash-on-Cash Return
3.4%
Cap rate
0.7%
Rent to Value Ratio
Active
$380,000
1
bds
|
2
ba
|
720
sqft
|
built
1991
540 Brickell Key Dr, Miami, FL 33131
$-1,224
Cash flow
-16.8%
Cash-on-Cash Return
2.3%
Cap rate
0.8%
Rent to Value Ratio
Active
$1,885,000
5
bds
|
4
ba
|
3,843
sqft
|
built
1991
9866 SW 111th Ter, Miami, FL 33176
$-4,271
Cash flow
-11.8%
Cash-on-Cash Return
3.4%
Cap rate
0.5%
Rent to Value Ratio

Active
$875,000
2
bds
|
2
ba
|
1,363
sqft
|
built
2008
244 Biscayne Blvd, Miami, FL 33132
$-3,219
Cash flow
-19.2%
Cash-on-Cash Return
1.7%
Cap rate
0.7%
Rent to Value Ratio
Active
$492,500
1
bds
|
1
ba
|
791
sqft
|
built
2004
2101 Brickell Ave, Miami, FL 33129
$-1,728
Cash flow
-18.3%
Cash-on-Cash Return
1.9%
Cap rate
0.6%
Rent to Value Ratio
Active
$489,000
1
bds
|
1
ba
|
754
sqft
|
built
2008
500 Brickell Ave, Miami, FL 33131
$-1,652
Cash flow
-17.6%
Cash-on-Cash Return
2.1%
Cap rate
0.7%
Rent to Value Ratio

Active
$700,000
3
bds
|
2
ba
|
1,541
sqft
|
built
1983
8923 SW 151st Ct, Miami, FL 33196
$-1,988
Cash flow
-14.8%
Cash-on-Cash Return
2.7%
Cap rate
0.5%
Rent to Value Ratio
Active
$900,000
4
bds
|
3
ba
|
1,995
sqft
|
built
1959
9301 SW 16th St, Miami, FL 33165
$-2,316
Cash flow
-13.4%
Cash-on-Cash Return
3.1%
Cap rate
0.4%
Rent to Value Ratio
Active
$630,000
2
bds
|
2
ba
|
1,111
sqft
|
built
2008
55 SE 6th St, Miami, FL 33131
$-1,852
Cash flow
-15.3%
Cash-on-Cash Return
2.6%
Cap rate
0.7%
Rent to Value Ratio
Active
$275,000
2
bds
|
2
ba
|
840
sqft
|
built
1973
9300 W Flagler St, Miami, FL 33174
$-373
Cash flow
-7.1%
Cash-on-Cash Return
4.5%
Cap rate
0.8%
Rent to Value Ratio
Active
$345,500
3
bds
|
2
ba
|
1,277
sqft
|
built
1974
9682 Fontainebleau Blvd, Miami, FL 33172
$-810
Cash flow
-12.2%
Cash-on-Cash Return
3.3%
Cap rate
0.7%
Rent to Value Ratio
Active
$875,000
4
bds
|
3
ba
|
1,732
sqft
|
built
1960
8930 SW 50th Ter, Miami, FL 33165
$-2,113
Cash flow
-12.6%
Cash-on-Cash Return
3.2%
Cap rate
0.5%
Rent to Value Ratio

Active
$640,000
3
bds
|
3
ba
|
1,425
sqft
|
built
1996
13780 SW 160th Ter, Miami, FL 33177
$-1,972
Cash flow
-16.1%
Cash-on-Cash Return
2.4%
Cap rate
0.5%
Rent to Value Ratio
Active
$560,000
1
bds
|
1
ba
|
737
sqft
|
built
2018
121 NE 34th St, Miami, FL 33137
$-2,487
Cash flow
-23.2%
Cash-on-Cash Return
0.8%
Cap rate
0.6%
Rent to Value Ratio
Active
$450,000
2
bds
|
0
ba
|
1,490
sqft
|
built
1930
1741 NW 92nd St, Miami, FL 33147
$-1,206
Cash flow
-14.0%
Cash-on-Cash Return
2.9%
Cap rate
0.4%
Rent to Value Ratio
Active
$1,850,000
3
bds
|
4
ba
|
1,856
sqft
|
built
2016
68 SE 6th St, Miami, FL 33131
$-7,898
Cash flow
-22.3%
Cash-on-Cash Return
1.0%
Cap rate
0.5%
Rent to Value Ratio
Active
$489,900
1
bds
|
2
ba
|
865
sqft
|
built
2018
1600 NE 1st Ave, Miami, FL 33132
$-1,555
Cash flow
-16.6%
Cash-on-Cash Return
2.3%
Cap rate
0.7%
Rent to Value Ratio
Active
$365,000
2
bds
|
3
ba
|
1,160
sqft
|
built
1996
451 NW 82nd Ave, Miami, FL 33126
$-720
Cash flow
-10.3%
Cash-on-Cash Return
3.8%
Cap rate
0.7%
Rent to Value Ratio
Active
$244,500
2
bds
|
2
ba
|
985
sqft
|
built
1983
20105 NE 3rd Ct, Miami, FL 33179
$-564
Cash flow
-12.0%
Cash-on-Cash Return
3.4%
Cap rate
0.9%
Rent to Value Ratio
Active
$382,050
1
bds
|
1
ba
|
707
sqft
|
built
2004
2001 Biscayne Blvd, Miami, FL 33137
$-1,229
Cash flow
-16.8%
Cash-on-Cash Return
2.3%
Cap rate
0.7%
Rent to Value Ratio
Active
$654,500
3
bds
|
2
ba
|
1,361
sqft
|
built
1964
17761 SW 113th Ct, Miami, FL 33157
$-1,427
Cash flow
-11.4%
Cash-on-Cash Return
3.5%
Cap rate
0.5%
Rent to Value Ratio

Active
$619,800
3
bds
|
3
ba
|
1,472
sqft
|
built
1978
12749 SW 71st Ter, Miami, FL 33183
$-1,650
Cash flow
-13.9%
Cash-on-Cash Return
3.0%
Cap rate
0.5%
Rent to Value Ratio
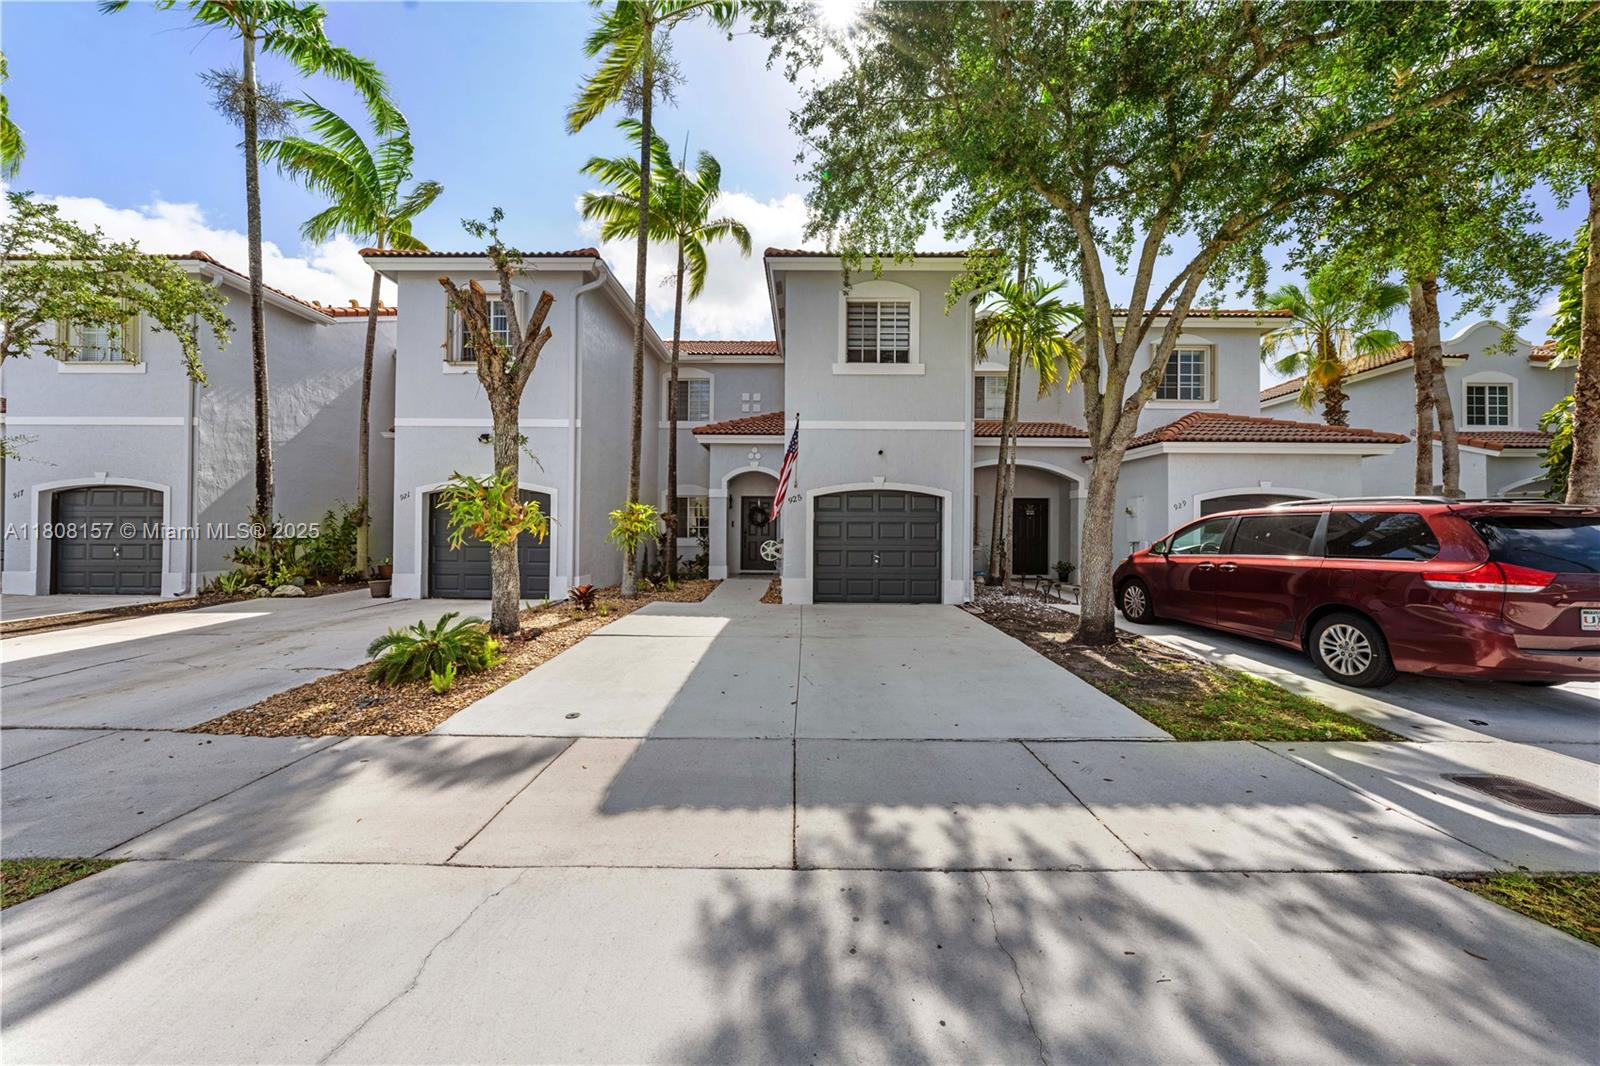
Active
$549,000
3
bds
|
3
ba
|
1,368
sqft
|
built
2002
925 SW 147th Ct, Miami, FL 33194
$-1,397
Cash flow
-13.3%
Cash-on-Cash Return
3.1%
Cap rate
0.6%
Rent to Value Ratio
Active
$429,000
3
bds
|
3
ba
|
1,688
sqft
|
built
1974
19460 NE 26th Ave, Miami, FL 33180
$-1,674
Cash flow
-20.4%
Cash-on-Cash Return
1.5%
Cap rate
0.7%
Rent to Value Ratio
Active
$765,000
5
bds
|
3
ba
|
1,776
sqft
|
built
1960
2530 NW 111th St, Miami, FL 33167
$-2,124
Cash flow
-14.5%
Cash-on-Cash Return
2.8%
Cap rate
0.4%
Rent to Value Ratio
Active
$795,000
3
bds
|
3
ba
|
1,486
sqft
|
built
2007
185 SW 7th St, Miami, FL 33130
$-2,679
Cash flow
-17.6%
Cash-on-Cash Return
2.1%
Cap rate
0.7%
Rent to Value Ratio

Active
$465,000
1
bds
|
2
ba
|
1,058
sqft
|
built
2006
41 SE 5th St, Miami, FL 33131
$-918
Cash flow
-10.3%
Cash-on-Cash Return
3.8%
Cap rate
0.8%
Rent to Value Ratio
Active
$825,000
3
bds
|
2
ba
|
1,229
sqft
|
built
1940
400 NW 45th St, Miami, FL 33127
$-2,485
Cash flow
-15.7%
Cash-on-Cash Return
2.5%
Cap rate
0.4%
Rent to Value Ratio
Active
$275,000
2
bds
|
2
ba
|
827
sqft
|
built
1982
8004 SW 149th Ave, Miami, FL 33193
$-591
Cash flow
-11.2%
Cash-on-Cash Return
3.6%
Cap rate
0.8%
Rent to Value Ratio
Active
$650,000
1
bds
|
1
ba
|
744
sqft
|
built
2019
3900 Biscayne Blvd, Miami, FL 33137
$-2,355
Cash flow
-18.9%
Cash-on-Cash Return
1.8%
Cap rate
0.6%
Rent to Value Ratio
Active
$320,000
2
bds
|
2
ba
|
1,460
sqft
|
built
1975
1800 NE 114th St, Miami, FL 33181
$-2,678
Cash flow
-43.7%
Cash-on-Cash Return
-3.9%
Cap rate
0.9%
Rent to Value Ratio