Miami, FL Investment Properties for Sale
Browse homes for sale and investment properties in Miami, FL. Refine your search by price, property type, or more.
Best cash flowing properties in Miami, FL
Active
$200,000
1
bds
|
1
ba
|
580
sqft
|
built
1949
3621 SW 10th St, Miami, FL 33135
$-164
Cash flow
-4.3%
Cash-on-Cash Return
5.2%
Cap rate
1.0%
Rent to Value Ratio

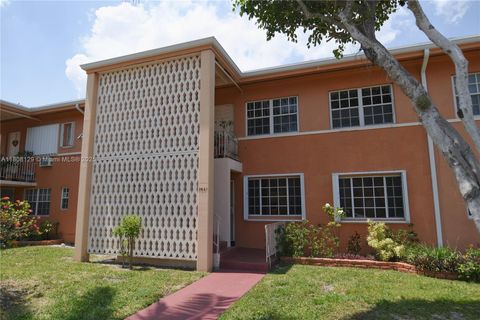
Active
$175,000
2
bds
|
1
ba
|
860
sqft
|
built
1982
650 NE 149th St, Miami, FL 33161
$-292
Cash flow
-8.7%
Cash-on-Cash Return
4.1%
Cap rate
1.1%
Rent to Value Ratio
6,092 out of 6,920 properties for sale in Miami, FL
Limited Results Shown
Create a free account, or log in to reveal all property listings and enjoy the complete experience.

Active
$1,720,000
5
bds
|
4
ba
|
3,379
sqft
|
built
1995
11230 SW 156th Ave, Miami, FL 33196
$-5,284
Cash flow
-16.0%
Cash-on-Cash Return
2.5%
Cap rate
0.4%
Rent to Value Ratio

Active
$700,000
3
bds
|
2
ba
|
1,432
sqft
|
built
1990
14234 SW 49th St, Miami, FL 33175
$-1,372
Cash flow
-10.2%
Cash-on-Cash Return
3.8%
Cap rate
0.5%
Rent to Value Ratio

Active
$440,000
1
bds
|
2
ba
|
840
sqft
|
built
1980
555 NE 15th St, Miami, FL 33132
$-2,095
Cash flow
-24.8%
Cash-on-Cash Return
0.4%
Cap rate
0.6%
Rent to Value Ratio
Pending
$435,000
2
bds
|
0
ba
|
1,254
sqft
|
built
1948
401 NW 81st St, Miami, FL 33150
$-1,188
Cash flow
-14.2%
Cash-on-Cash Return
2.9%
Cap rate
0.5%
Rent to Value Ratio

Active
$364,000
1
bds
|
1
ba
|
821
sqft
|
built
2007
1750 N Bayshore Dr, Miami, FL 33132
$-1,117
Cash flow
-16.0%
Cash-on-Cash Return
2.5%
Cap rate
0.9%
Rent to Value Ratio

Active
$750,000
2
bds
|
2
ba
|
868
sqft
|
built
2016
1300 S Miami Ave, Miami, FL 33130
$-2,521
Cash flow
-17.5%
Cash-on-Cash Return
2.1%
Cap rate
0.7%
Rent to Value Ratio
Active
$975,000
5
bds
|
3
ba
|
2,672
sqft
|
built
1994
15462 SW 147th St, Miami, FL 33196
$-2,813
Cash flow
-15.1%
Cash-on-Cash Return
2.7%
Cap rate
0.4%
Rent to Value Ratio
Active
$625,000
3
bds
|
0
ba
|
1,573
sqft
|
built
1954
11385 NW 12th Ave, Miami, FL 33168
$-2,046
Cash flow
-17.1%
Cash-on-Cash Return
2.2%
Cap rate
0.3%
Rent to Value Ratio

Active
$289,000
1
bds
|
1
ba
|
625
sqft
|
built
1947
1025 SW 7th Ave, Miami, FL 33130
$-848
Cash flow
-15.3%
Cash-on-Cash Return
2.6%
Cap rate
0.7%
Rent to Value Ratio

Active
$1,995,000
4
bds
|
5
ba
|
1,872
sqft
|
built
2018
650 NE 32nd St, Miami, FL 33137
$-8,163
Cash flow
-21.3%
Cash-on-Cash Return
1.2%
Cap rate
0.5%
Rent to Value Ratio

Active
$550,000
2
bds
|
2
ba
|
1,046
sqft
|
built
2004
1401 SW 22nd St, Miami, FL 33145
$-2,082
Cash flow
-19.8%
Cash-on-Cash Return
1.6%
Cap rate
0.6%
Rent to Value Ratio
Active
$200,000
1
bds
|
1
ba
|
580
sqft
|
built
1949
3621 SW 10th St, Miami, FL 33135
$-164
Cash flow
-4.3%
Cash-on-Cash Return
5.2%
Cap rate
1.0%
Rent to Value Ratio

Active
$1,120,000
2
bds
|
3
ba
|
1,223
sqft
|
built
2017
2900 NE 7th Ave, Miami, FL 33137
$-3,895
Cash flow
-18.1%
Cash-on-Cash Return
2.0%
Cap rate
0.6%
Rent to Value Ratio

Active under contract
$490,000
3
bds
|
2
ba
|
1,225
sqft
|
built
1976
12031 SW 191st Ter, Miami, FL 33177
$-504
Cash flow
-5.4%
Cash-on-Cash Return
4.9%
Cap rate
0.6%
Rent to Value Ratio

Active
$289,000
1
bds
|
1
ba
|
625
sqft
|
built
1947
1025 SW 7th Ave, Miami, FL 33130
$-917
Cash flow
-16.6%
Cash-on-Cash Return
2.3%
Cap rate
0.7%
Rent to Value Ratio

Active
$1,100,000
2
bds
|
2
ba
|
1,286
sqft
|
built
2009
485 Brickell Ave, Miami, FL 33131
$-4,075
Cash flow
-19.3%
Cash-on-Cash Return
1.7%
Cap rate
0.6%
Rent to Value Ratio
Active under contract
$380,000
1
bds
|
2
ba
|
968
sqft
|
built
2008
1050 Brickell Ave, Miami, FL 33131
$-1,702
Cash flow
-23.4%
Cash-on-Cash Return
0.8%
Cap rate
0.8%
Rent to Value Ratio

Active
$1,895,000
3
bds
|
1
ba
|
1,068
sqft
|
built
1949
2975 Shipping Ave, Miami, FL 33133
$-6,573
Cash flow
-18.1%
Cash-on-Cash Return
2.0%
Cap rate
0.3%
Rent to Value Ratio
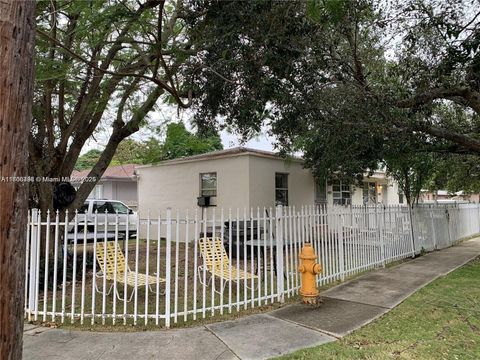
Active
$175,000
2
bds
|
1
ba
|
860
sqft
|
built
1982
650 NE 149th St, Miami, FL 33161
$-292
Cash flow
-8.7%
Cash-on-Cash Return
4.1%
Cap rate
1.1%
Rent to Value Ratio

Active under contract
$875,000
4
bds
|
2
ba
|
2,027
sqft
|
built
1937
2978 SW 14th St, Miami, FL 33145
$-1,325
Cash flow
-7.9%
Cash-on-Cash Return
4.3%
Cap rate
0.7%
Rent to Value Ratio

Active
$525,000
2
bds
|
2
ba
|
1,072
sqft
|
built
2002
2665 SW 37th Ave, Miami, FL 33133
$-1,915
Cash flow
-19.0%
Cash-on-Cash Return
1.8%
Cap rate
0.6%
Rent to Value Ratio

Active
$3,380,000
5
bds
|
5
ba
|
4,611
sqft
|
built
1924
1870 S Bayshore Dr, Miami, FL 33133
$-16,726
Cash flow
-25.8%
Cash-on-Cash Return
0.2%
Cap rate
0.2%
Rent to Value Ratio

Active
$455,000
2
bds
|
1
ba
|
1,025
sqft
|
built
1979
6817 SW 127th Ct, Miami, FL 33183
$-1,248
Cash flow
-14.3%
Cash-on-Cash Return
2.9%
Cap rate
0.6%
Rent to Value Ratio

Active
$834,900
2
bds
|
2
ba
|
986
sqft
|
built
2008
950 Brickell Bay Dr, Miami, FL 33131
$-3,172
Cash flow
-19.8%
Cash-on-Cash Return
1.6%
Cap rate
0.6%
Rent to Value Ratio

Active
$1,080,000
2
bds
|
3
ba
|
1,747
sqft
|
built
1982
520 Brickell Key Dr, Miami, FL 33131
$-3,484
Cash flow
-16.8%
Cash-on-Cash Return
2.3%
Cap rate
0.7%
Rent to Value Ratio

Active
$375,000
2
bds
|
2
ba
|
872
sqft
|
built
1976
677 NE 24th St, Miami, FL 33137
$-920
Cash flow
-12.8%
Cash-on-Cash Return
3.2%
Cap rate
0.7%
Rent to Value Ratio

Active
$435,000
2
bds
|
2
ba
|
866
sqft
|
built
2002
3500 Coral Way, Miami, FL 33145
$-1,361
Cash flow
-16.3%
Cash-on-Cash Return
2.4%
Cap rate
0.7%
Rent to Value Ratio

Active
$200,000
2
bds
|
2
ba
|
870
sqft
|
built
1983
771 NE 199th St, Miami, FL 33179
$-507
Cash flow
-13.2%
Cash-on-Cash Return
3.1%
Cap rate
1.0%
Rent to Value Ratio
Active
$580,000
2
bds
|
2
ba
|
1,007
sqft
|
built
2006
480 NE 30th St, Miami, FL 33137
$-1,950
Cash flow
-17.5%
Cash-on-Cash Return
2.1%
Cap rate
0.7%
Rent to Value Ratio
Active
$910,000
4
bds
|
4
ba
|
2,537
sqft
|
built
1997
16560 SW 144th Ave, Miami, FL 33177
$-1,986
Cash flow
-11.4%
Cash-on-Cash Return
3.5%
Cap rate
0.5%
Rent to Value Ratio

Active
$280,000
2
bds
|
1
ba
|
770
sqft
|
built
1973
200 NW 107th Ave, Miami, FL 33172
$-529
Cash flow
-9.9%
Cash-on-Cash Return
3.9%
Cap rate
0.7%
Rent to Value Ratio

Active
$592,000
4
bds
|
2
ba
|
1,216
sqft
|
built
1951
14015 Madison St, Miami, FL 33176
$-1,450
Cash flow
-12.8%
Cash-on-Cash Return
3.2%
Cap rate
0.5%
Rent to Value Ratio

Active
$1,000,000
3
bds
|
2
ba
|
1,438
sqft
|
built
2015
999 SW 1st Ave, Miami, FL 33130
$-3,945
Cash flow
-20.6%
Cash-on-Cash Return
1.4%
Cap rate
0.6%
Rent to Value Ratio

Active
$3,150,000
3
bds
|
4
ba
|
2,825
sqft
|
built
1993
2127 Brickell Ave, Miami, FL 33129
$-16,688
Cash flow
-27.6%
Cash-on-Cash Return
-0.2%
Cap rate
0.3%
Rent to Value Ratio
Active
$575,000
2
bds
|
2
ba
|
1,470
sqft
|
built
1984
20281 E Country Club Dr, Miami, FL 33180
$-2,469
Cash flow
-22.4%
Cash-on-Cash Return
1.0%
Cap rate
0.7%
Rent to Value Ratio

Active
$739,900
4
bds
|
3
ba
|
1,982
sqft
|
built
2004
5972 SW 163rd Pl, Miami, FL 33193
$-1,685
Cash flow
-11.9%
Cash-on-Cash Return
3.4%
Cap rate
0.5%
Rent to Value Ratio

Active
$1,625,000
4
bds
|
3
ba
|
2,605
sqft
|
built
1973
13501 SW 107th Ave, Miami, FL 33176
$-5,062
Cash flow
-16.3%
Cash-on-Cash Return
2.4%
Cap rate
0.4%
Rent to Value Ratio

Active
$389,000
3
bds
|
2
ba
|
1,544
sqft
|
built
1950
1230 NW 113th Ter, Miami, FL 33167
$-384
Cash flow
-5.2%
Cash-on-Cash Return
5.0%
Cap rate
0.7%
Rent to Value Ratio

Active
$315,000
2
bds
|
1
ba
|
762
sqft
|
built
1947
2655 NW 14th Ave, Miami, FL 33142
$-493
Cash flow
-8.2%
Cash-on-Cash Return
4.3%
Cap rate
0.6%
Rent to Value Ratio

Active
$525,000
2
bds
|
2
ba
|
1,180
sqft
|
built
2007
3232 SW 22nd Ter, Miami, FL 33145
$-1,781
Cash flow
-17.7%
Cash-on-Cash Return
2.1%
Cap rate
0.7%
Rent to Value Ratio