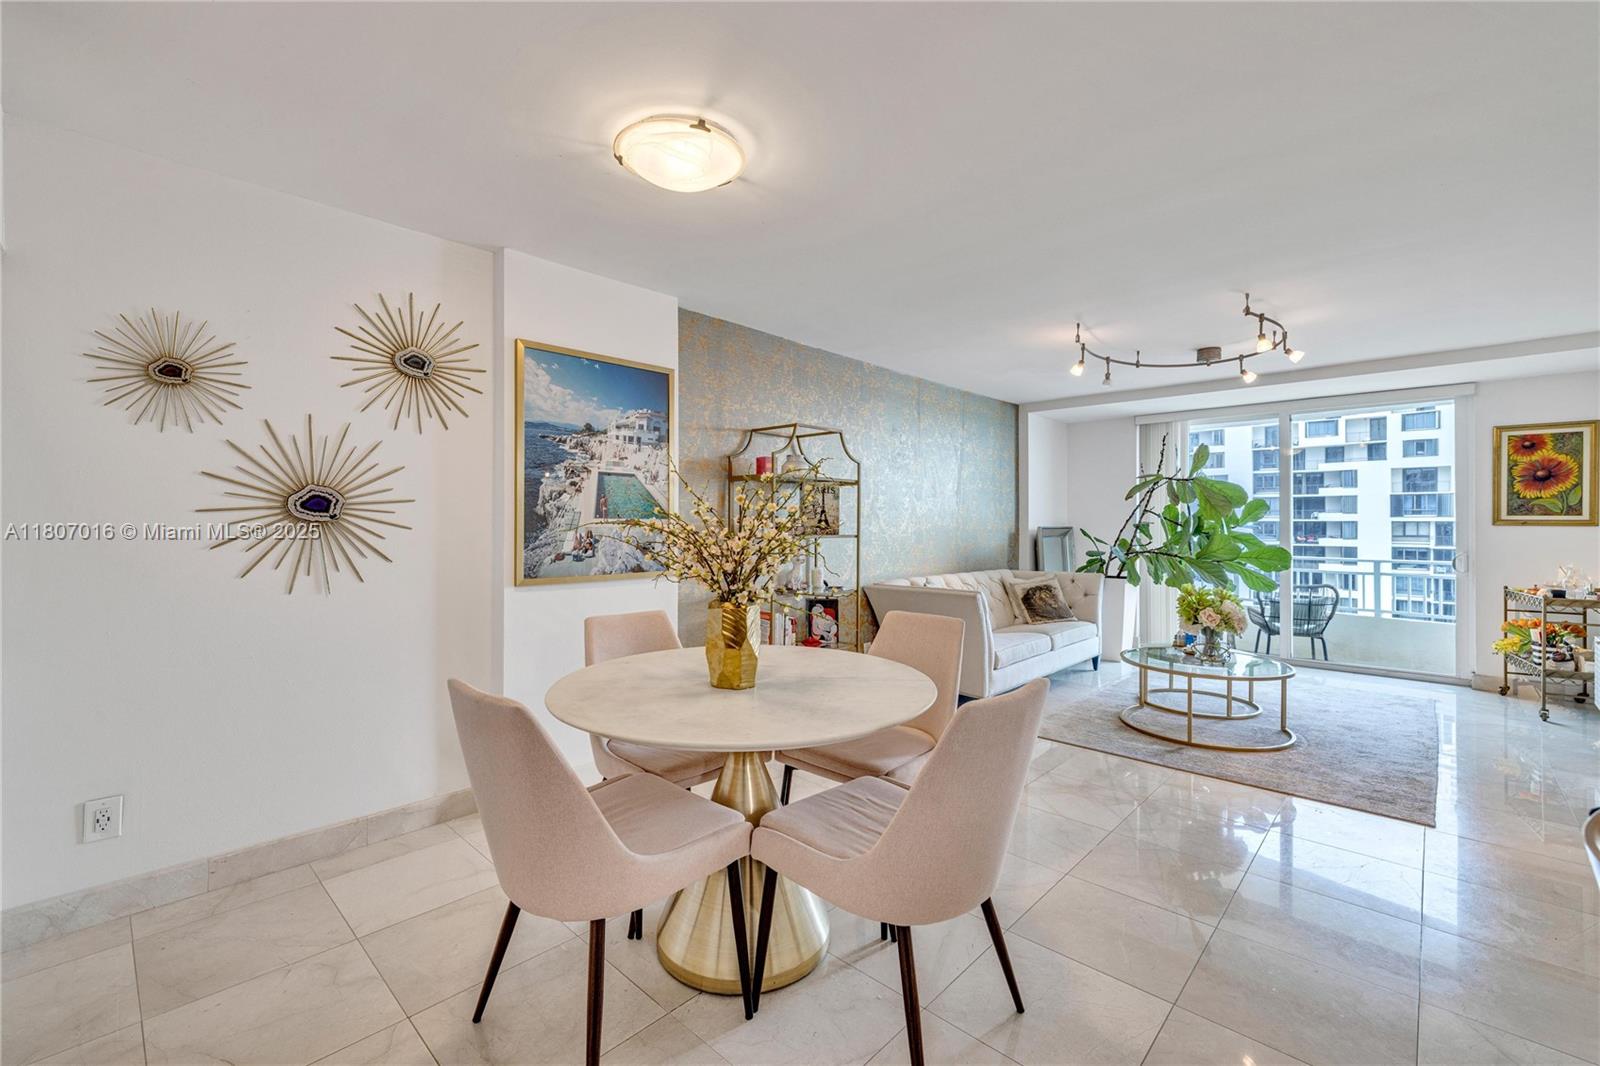
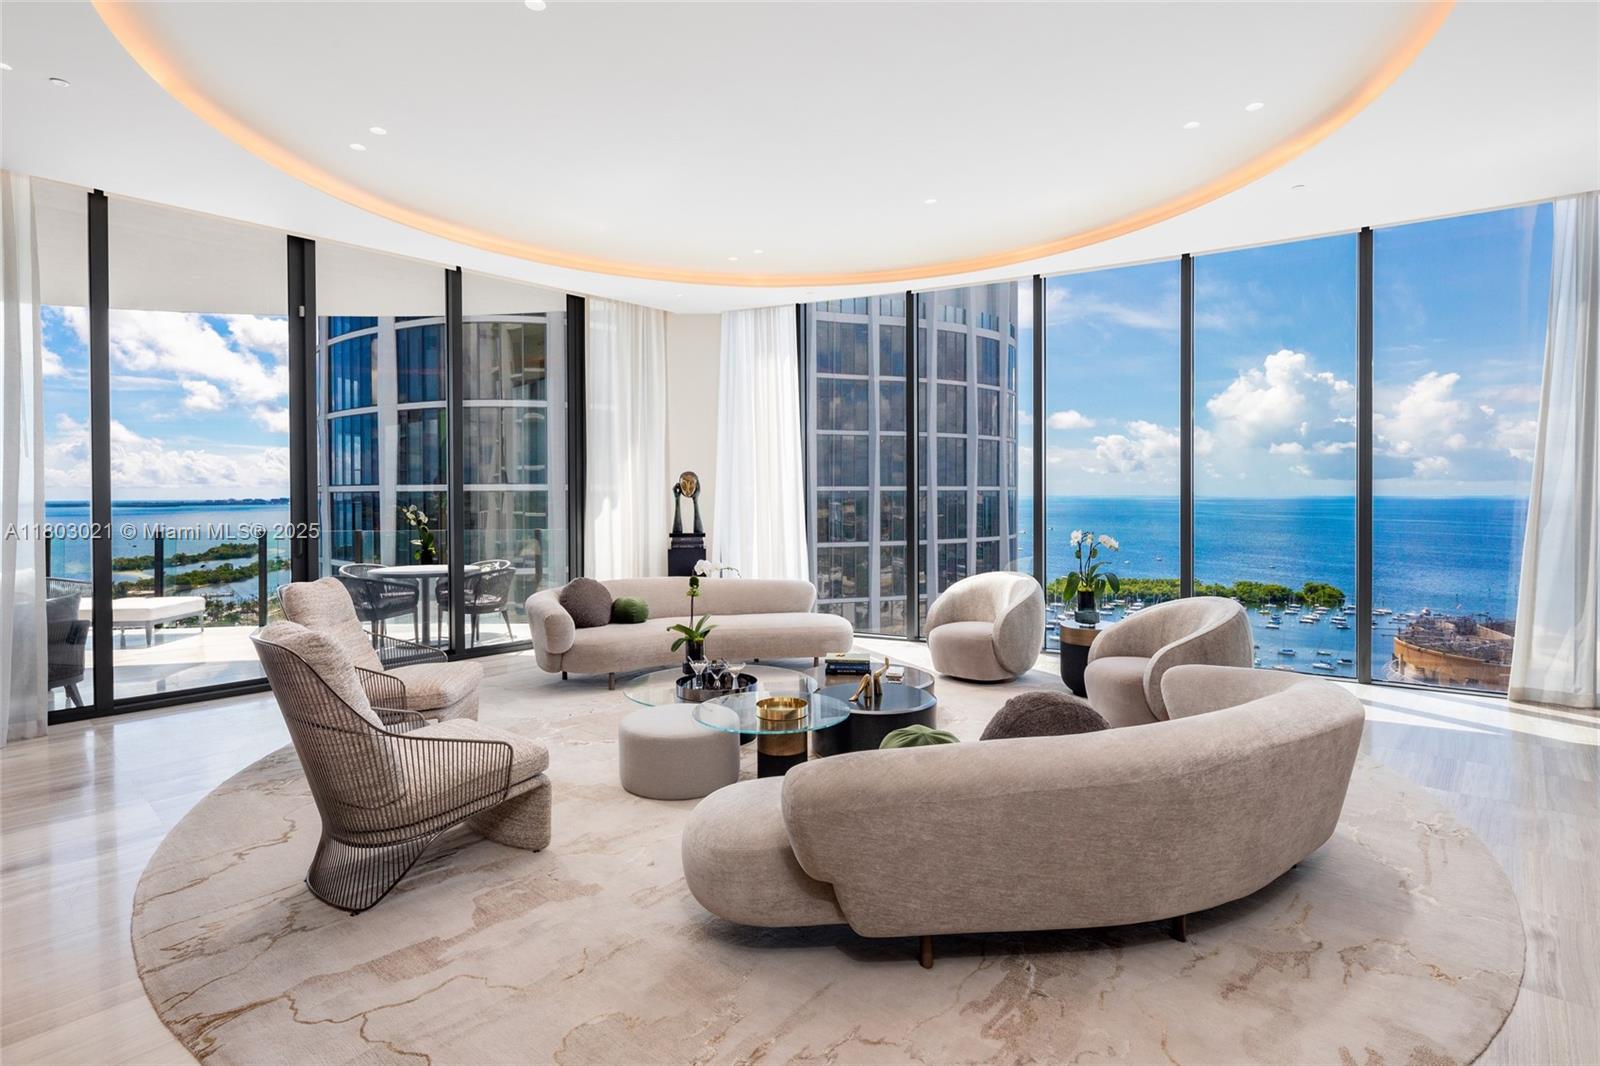
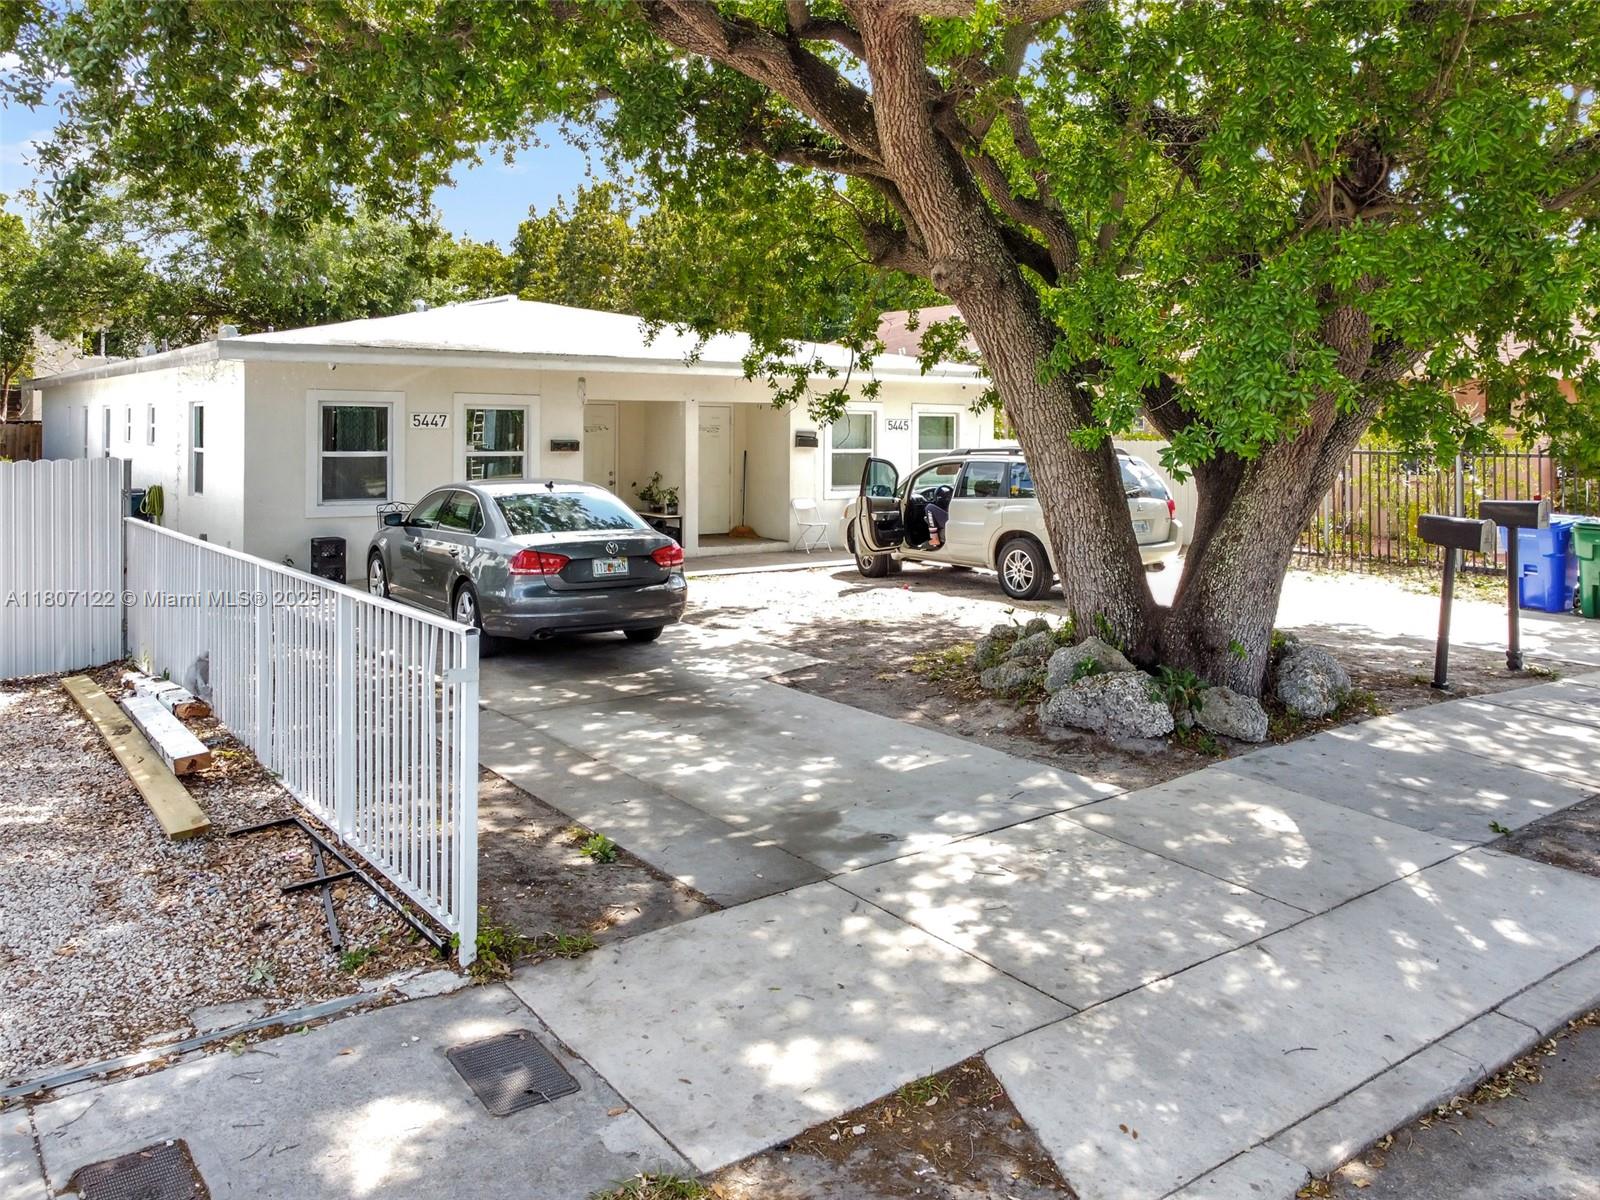
Miami, FL Investment Properties for Sale
Browse homes for sale and investment properties in Miami, FL. Refine your search by price, property type, or more.
Best cash flowing properties in Miami, FL
Active
$199,900
1
bds
|
1
ba
|
0
sqft
|
built
1949
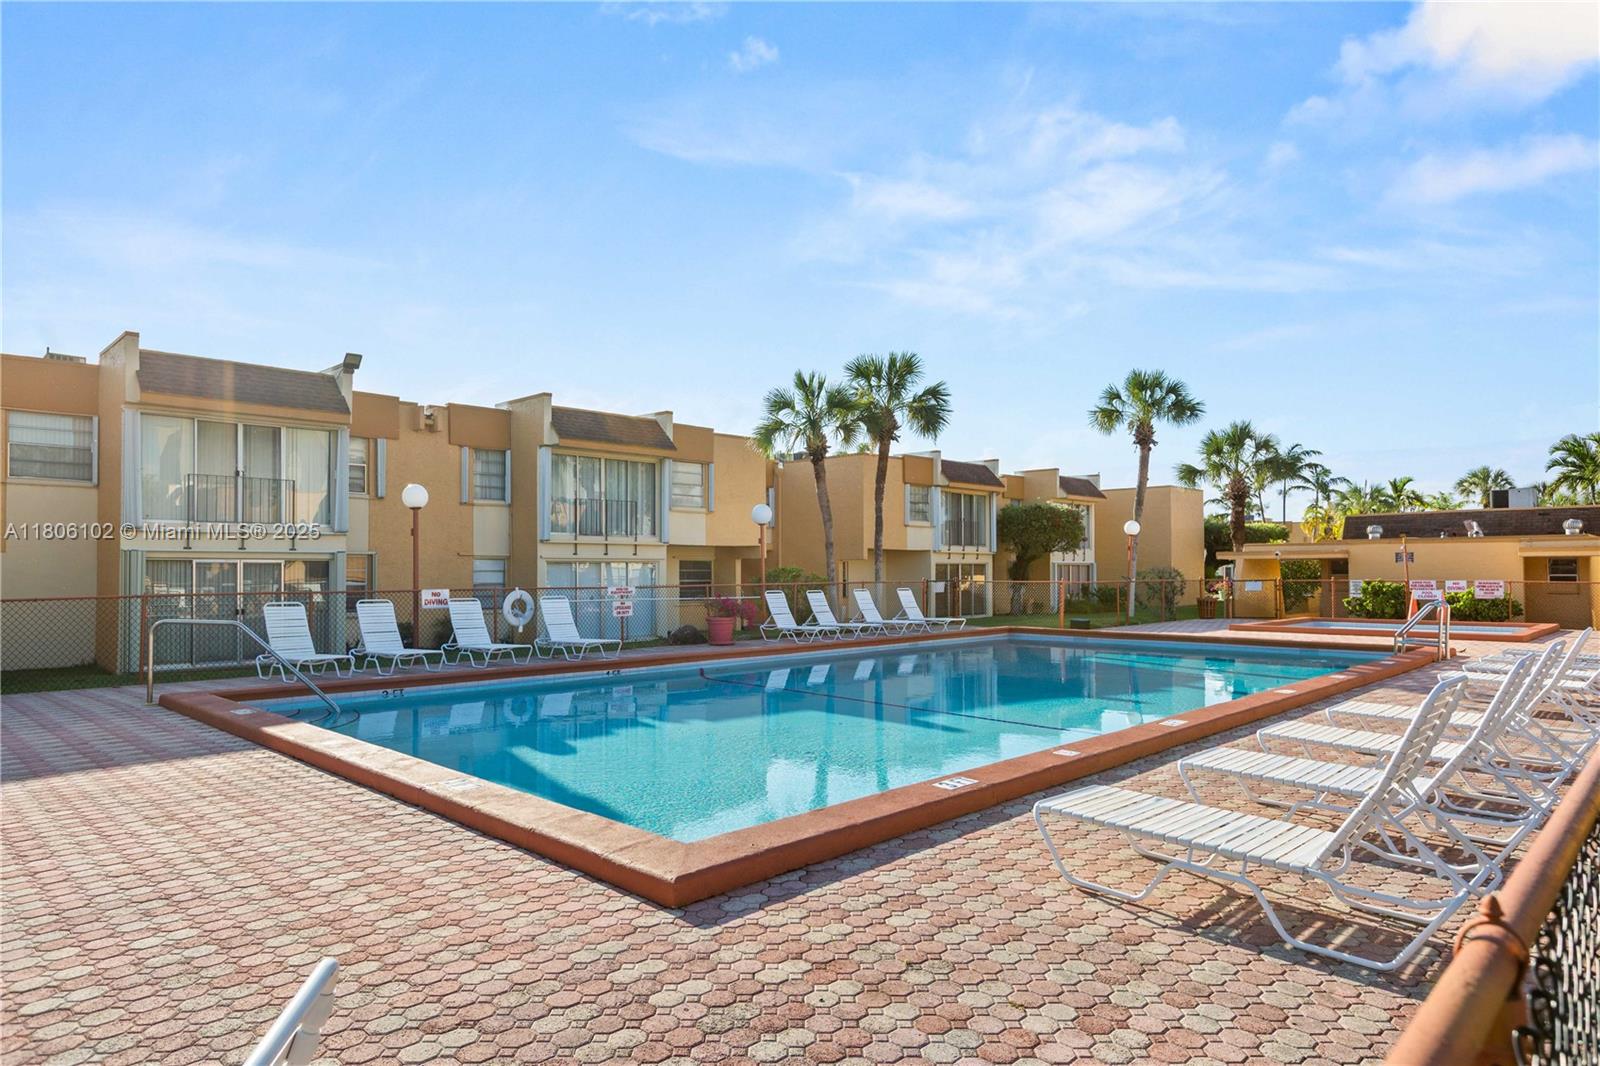
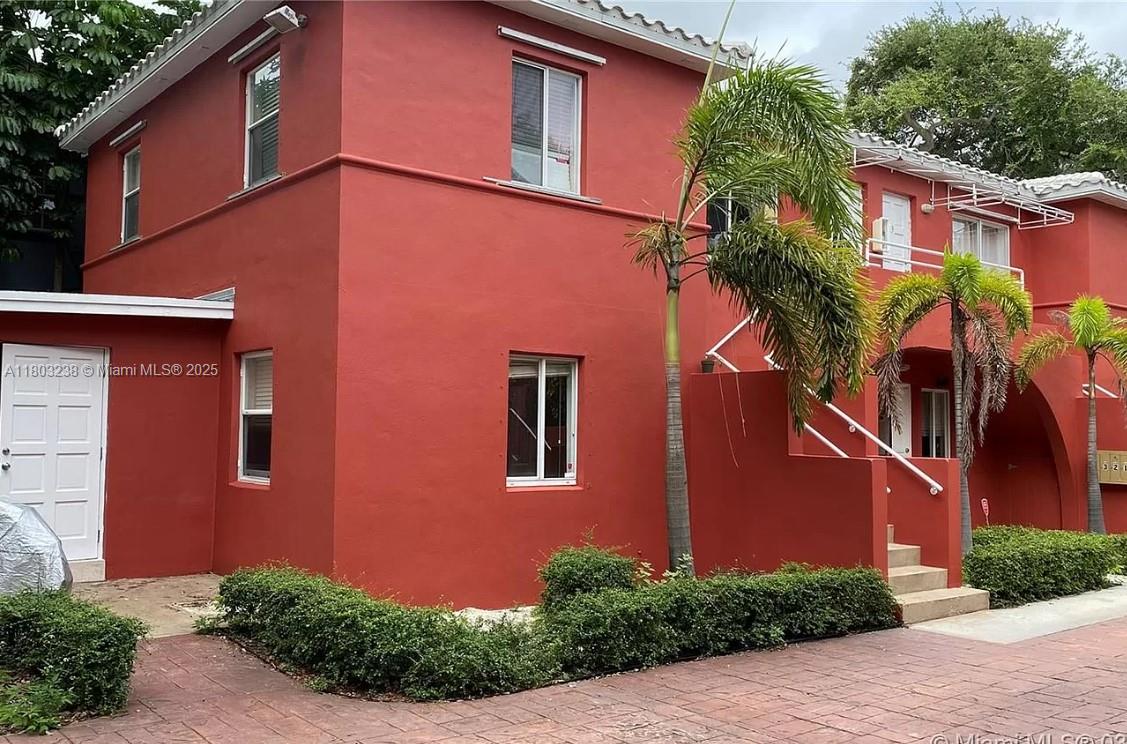
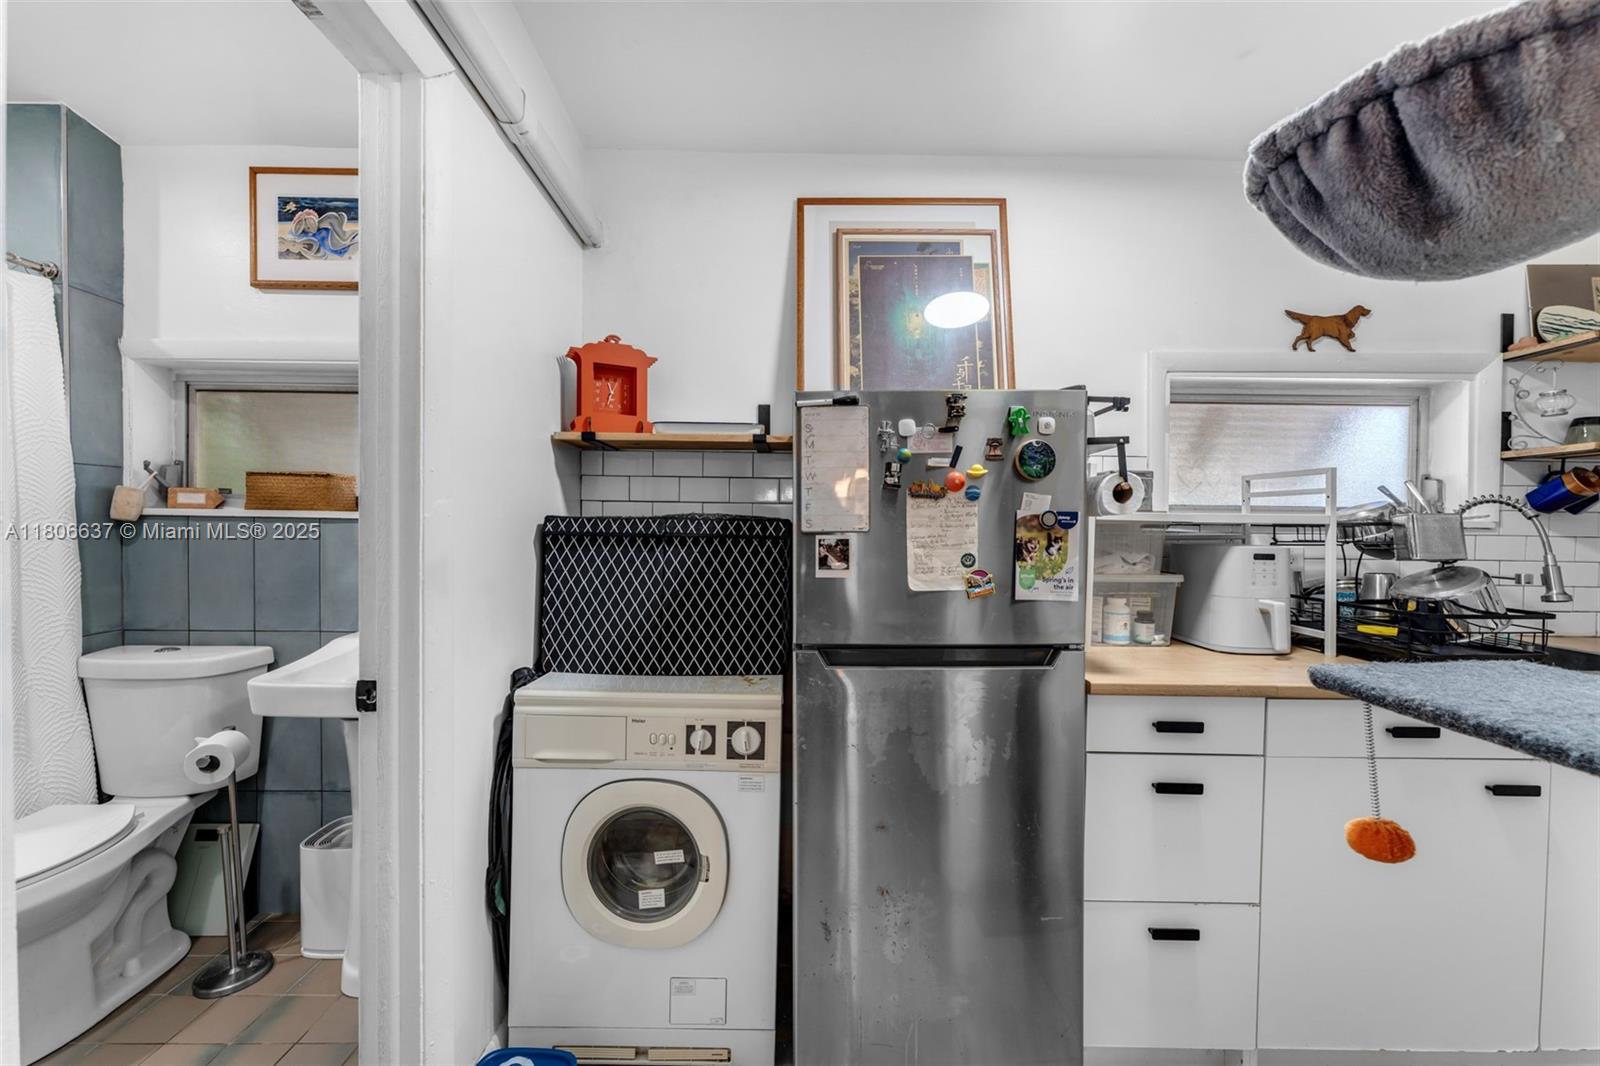
3698 William Ave, Miami, FL 33133
$44
Cash flow
1.1%
Cash-on-Cash Return
6.4%
Cap rate
0.9%
Rent to Value Ratio
Active
$224,800
1
bds
|
1
ba
|
614
sqft
|
built
1973
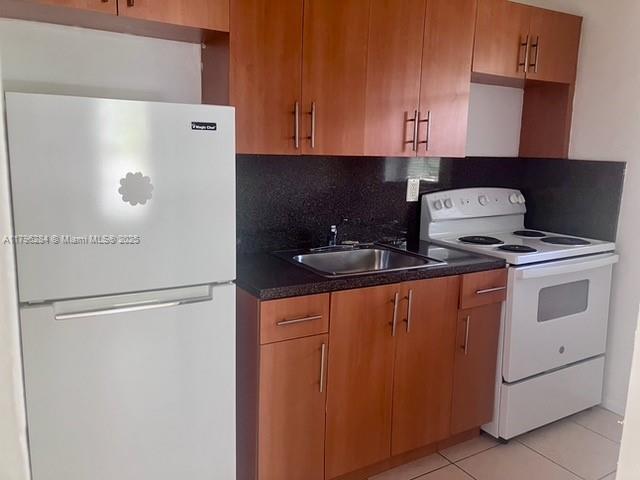
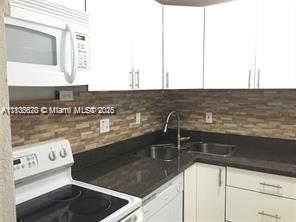
9310 W Flagler St, Miami, FL 33174
$-8
Cash flow
-0.2%
Cash-on-Cash Return
6.1%
Cap rate
0.9%
Rent to Value Ratio
6,122 out of 6,953 properties for sale in Miami, FL
Limited Results Shown
Create a free account, or log in to reveal all property listings and enjoy the complete experience.
Active
$485,000
3
bds
|
3
ba
|
1,483
sqft
|
built
2022
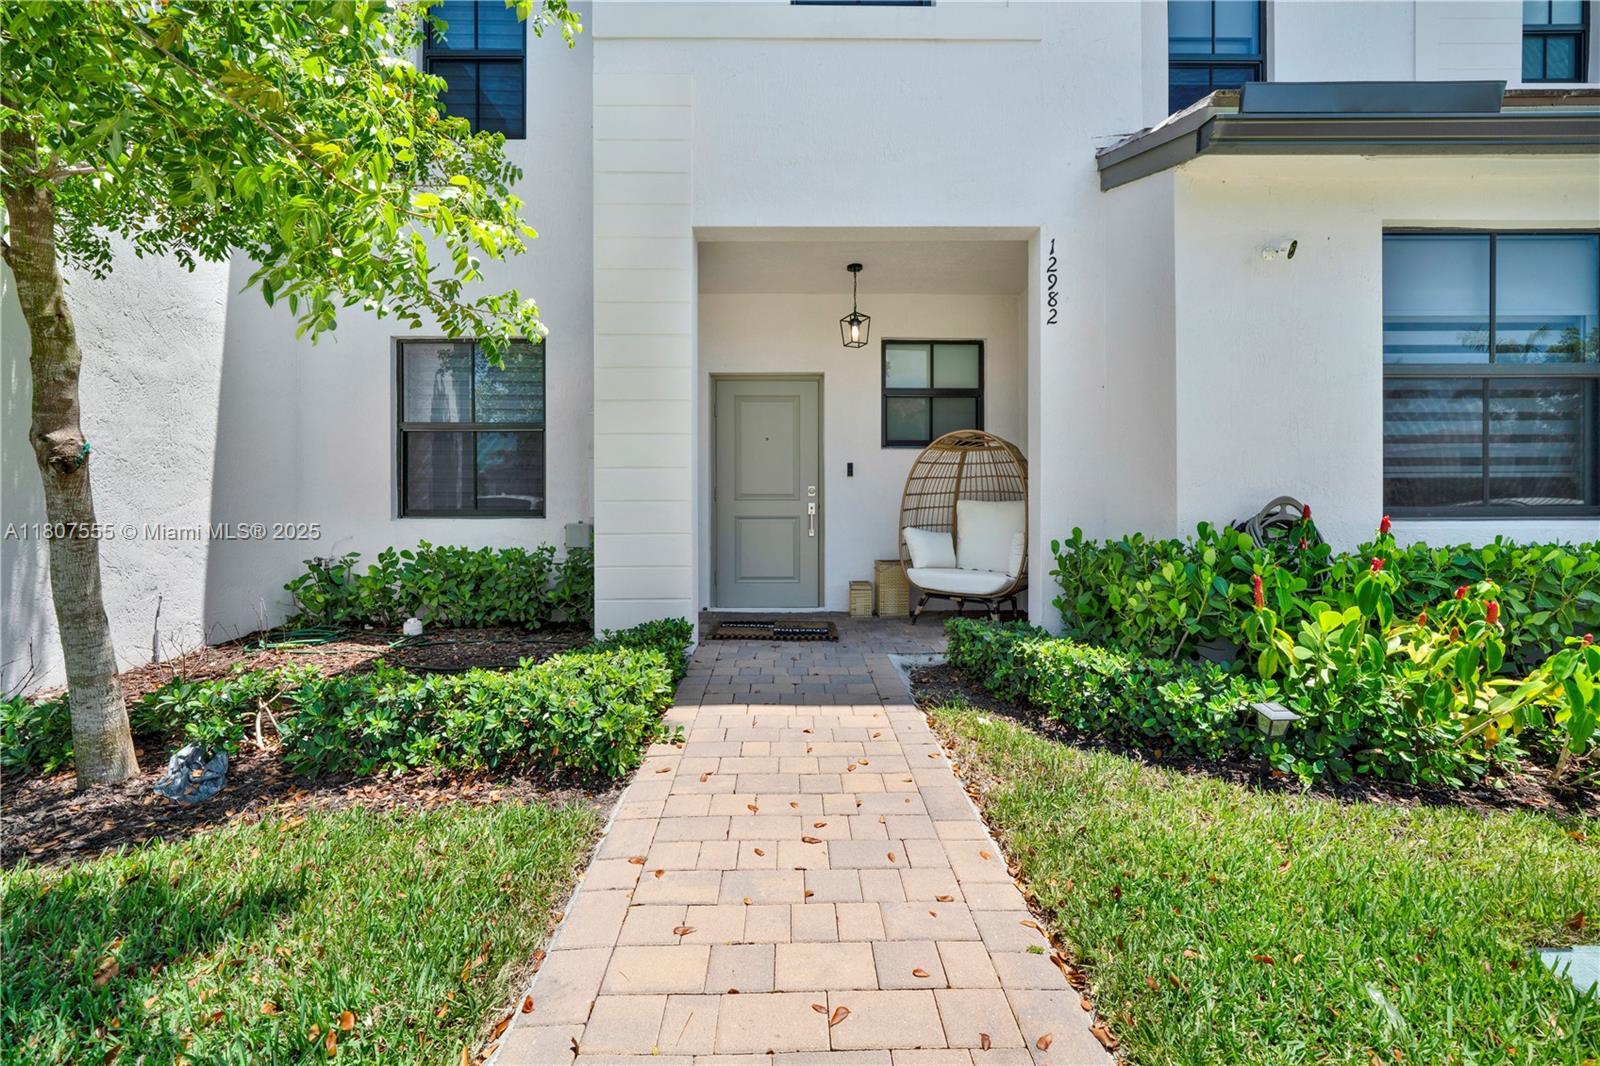
12982 SW 232nd St, Miami, FL 33170
$-1,261
Cash flow
-13.6%
Cash-on-Cash Return
3.0%
Cap rate
0.6%
Rent to Value Ratio
Active
$550,000
4
bds
|
0
ba
|
1,056
sqft
|
built
1954
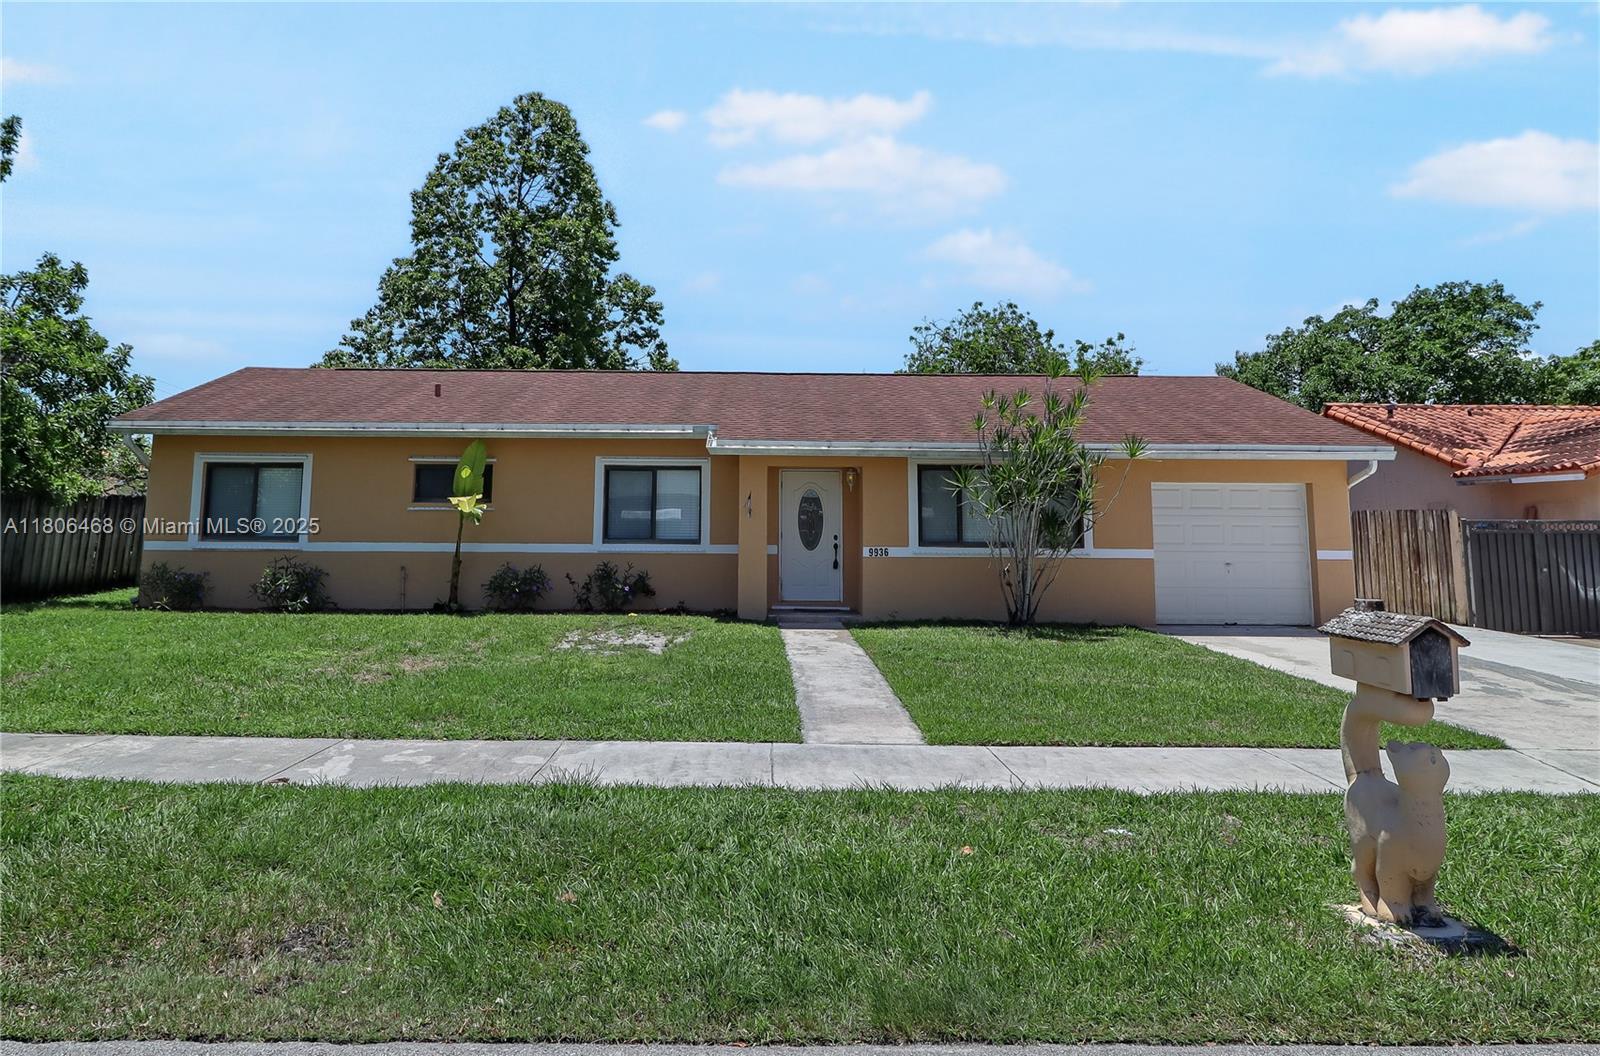
10601 SW 172nd St, Miami, FL 33157
$-1,996
Cash flow
-18.9%
Cash-on-Cash Return
1.8%
Cap rate
0.4%
Rent to Value Ratio
Active
$500,000
2
bds
|
2
ba
|
1,173
sqft
|
built
1978
13244 SW 108th Street Cir, Miami, FL 33186
$-1,401
Cash flow
-14.6%
Cash-on-Cash Return
2.8%
Cap rate
0.6%
Rent to Value Ratio
Active
$2,600,000
6
bds
|
5
ba
|
5,115
sqft
|
built
1959
12200 SW 51st St, Miami, FL 33175
$-10,772
Cash flow
-21.6%
Cash-on-Cash Return
1.2%
Cap rate
0.2%
Rent to Value Ratio
Pending
$499,900
4
bds
|
2
ba
|
1,390
sqft
|
built
1958
2034 NW 69th Ter, Miami, FL 33147
$-1,032
Cash flow
-10.8%
Cash-on-Cash Return
3.7%
Cap rate
0.6%
Rent to Value Ratio
Active
$925,000
3
bds
|
2
ba
|
1,558
sqft
|
built
1984
6911 SW 83rd Ct, Miami, FL 33143
$-1,875
Cash flow
-10.6%
Cash-on-Cash Return
3.7%
Cap rate
0.5%
Rent to Value Ratio
Active
$165,000
bds
|
1
ba
|
338
sqft
|
built
1946
544 NE 62nd St, Miami, FL 33138
$-358
Cash flow
-11.3%
Cash-on-Cash Return
3.5%
Cap rate
0.8%
Rent to Value Ratio
Active
$635,000
3
bds
|
2
ba
|
1,291
sqft
|
built
1993
9936 SW 155th St, Miami, FL 33157
$-1,025
Cash flow
-8.4%
Cash-on-Cash Return
4.2%
Cap rate
0.6%
Rent to Value Ratio
Active
$537,000
2
bds
|
2
ba
|
1,430
sqft
|
built
1991
3640 Yacht Club Dr, Miami, FL 33180
$-550
Cash flow
-5.3%
Cash-on-Cash Return
4.9%
Cap rate
0.7%
Rent to Value Ratio
Pending
$184,900
2
bds
|
1
ba
|
825
sqft
|
built
1965
1723 NE Miami Gardens Dr, Miami, FL 33179
$-174
Cash flow
-4.9%
Cash-on-Cash Return
5.0%
Cap rate
1.1%
Rent to Value Ratio
Active
$1,000,000
4
bds
|
3
ba
|
2,596
sqft
|
built
2007
15375 SW 93rd Ln, Miami, FL 33196
$-3,215
Cash flow
-16.8%
Cash-on-Cash Return
2.3%
Cap rate
0.4%
Rent to Value Ratio

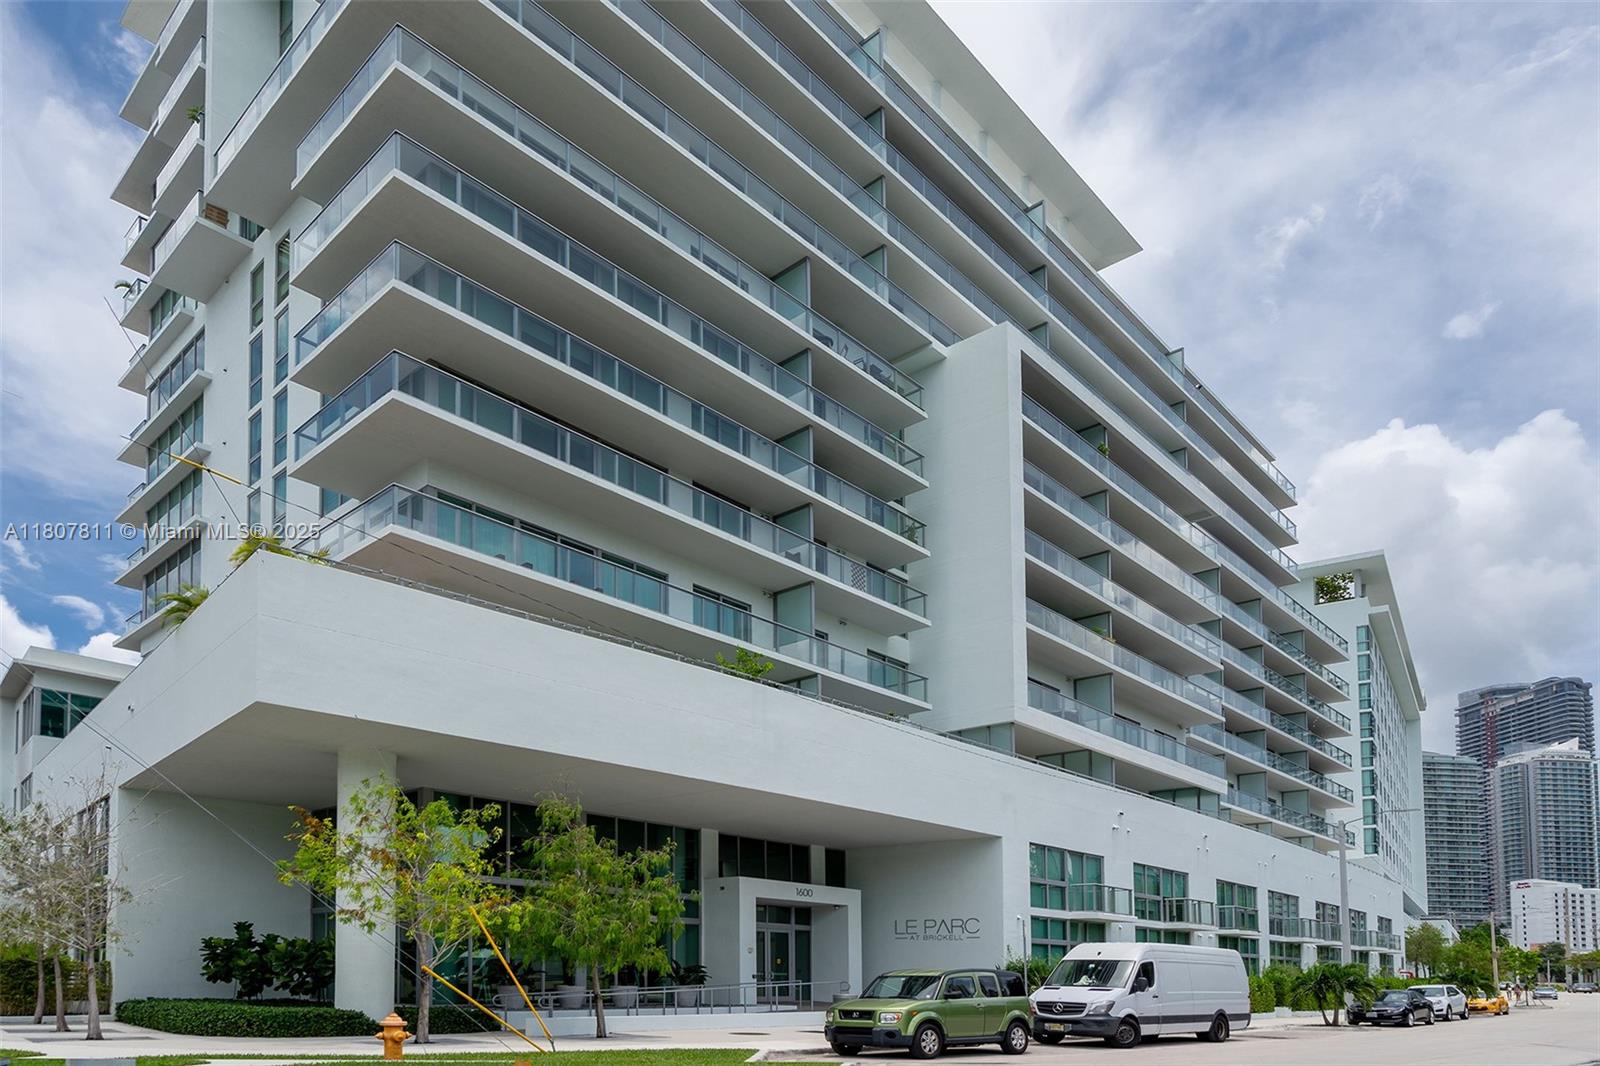
Active
$549,000
2
bds
|
2
ba
|
880
sqft
|
built
2018
1600 NE 1st Ave, Miami, FL 33132
$-2,009
Cash flow
-19.1%
Cash-on-Cash Return
1.8%
Cap rate
0.7%
Rent to Value Ratio
Active
$639,900
3
bds
|
2
ba
|
1,810
sqft
|
built
1992
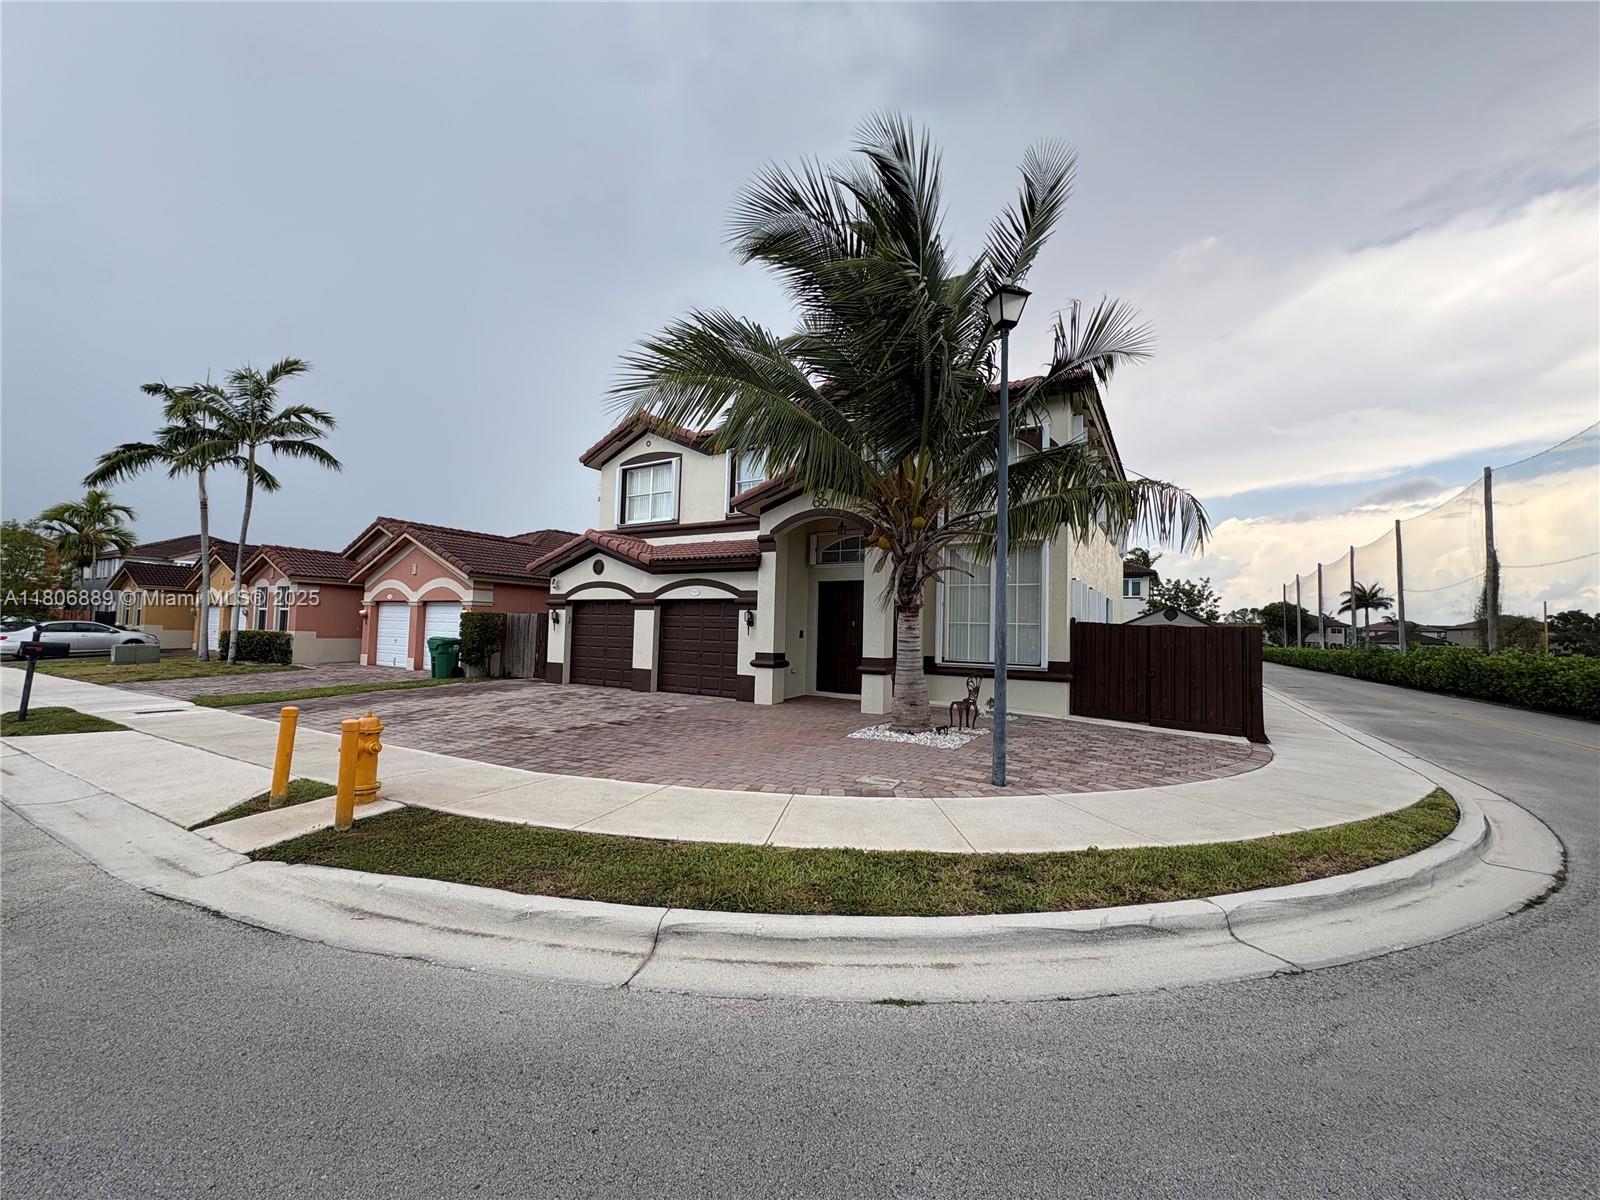
14226 SW 90th Ter, Miami, FL 33186
$-1,757
Cash flow
-14.3%
Cash-on-Cash Return
2.9%
Cap rate
0.5%
Rent to Value Ratio
Active
$489,000
2
bds
|
3
ba
|
1,792
sqft
|
built
1980
20033 NE 2nd Pl, Miami, FL 33179
$-917
Cash flow
-9.8%
Cash-on-Cash Return
3.9%
Cap rate
0.7%
Rent to Value Ratio
Active
$995,000
5
bds
|
3
ba
|
3,074
sqft
|
built
1980
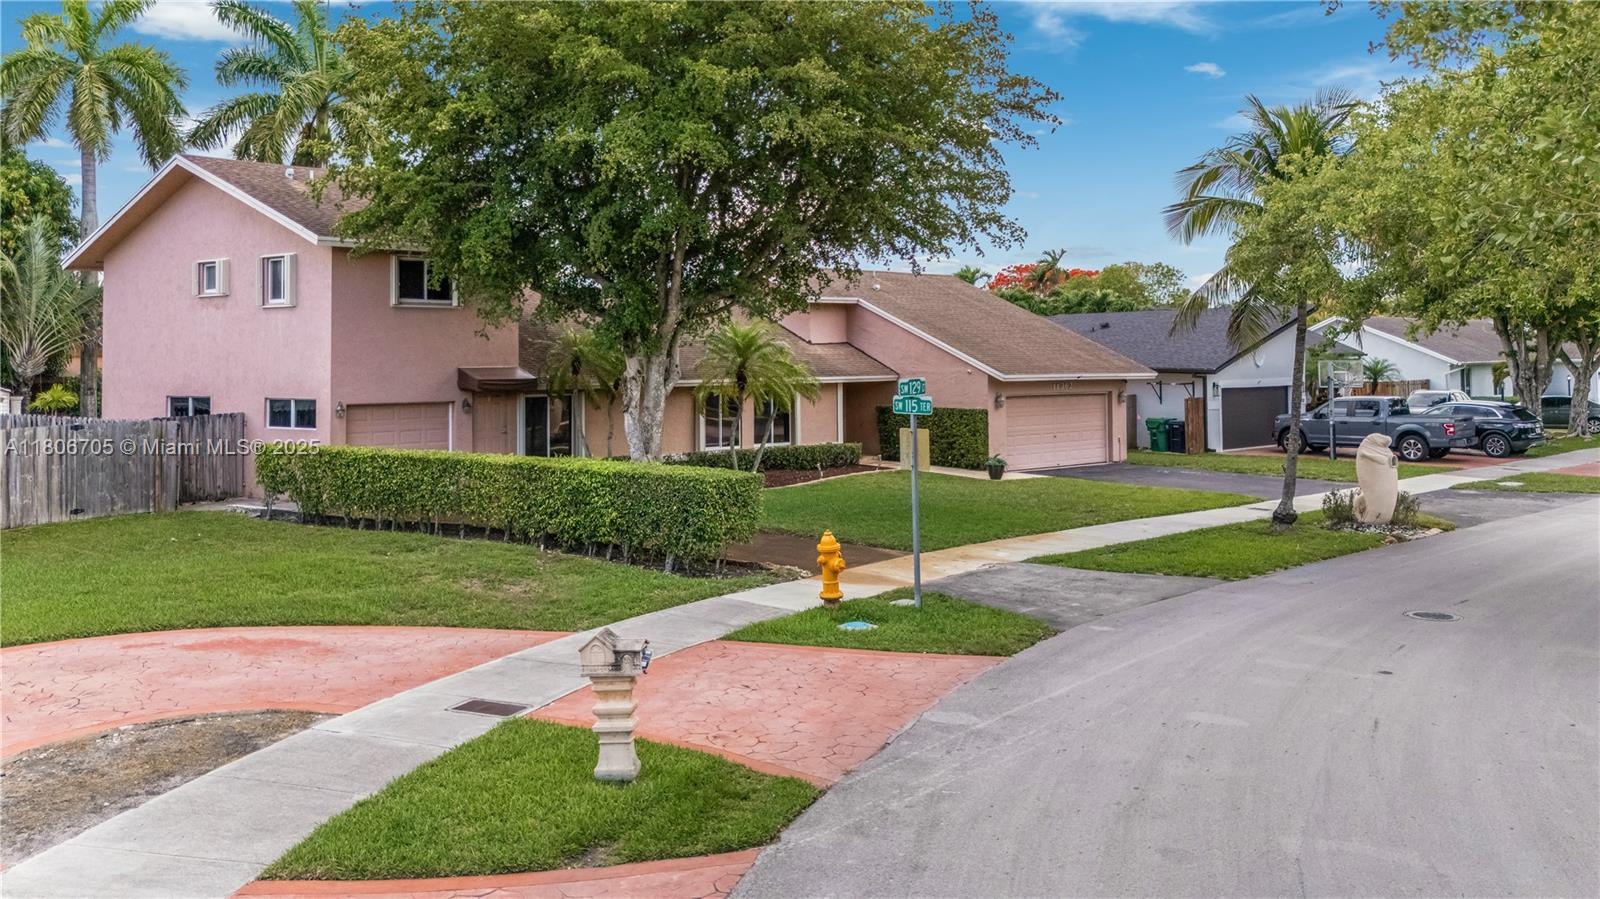
11362 SW 129th Ct, Miami, FL 33186
$-2,425
Cash flow
-12.7%
Cash-on-Cash Return
3.2%
Cap rate
0.5%
Rent to Value Ratio

Active
$460,000
1
bds
|
1
ba
|
837
sqft
|
built
2008
1900 N Bayshore Dr, Miami, FL 33132
$-1,612
Cash flow
-18.3%
Cash-on-Cash Return
1.9%
Cap rate
0.7%
Rent to Value Ratio
Active
$299,999
3
bds
|
2
ba
|
1,180
sqft
|
built
1971
7825 Miller Dr, Miami, FL 33155
$-625
Cash flow
-10.9%
Cash-on-Cash Return
3.6%
Cap rate
0.9%
Rent to Value Ratio

Active
$1,450,000
2
bds
|
2
ba
|
1,253
sqft
|
built
2018
801 S Miami Ave, Miami, FL 33130
$-5,829
Cash flow
-21.0%
Cash-on-Cash Return
1.3%
Cap rate
0.5%
Rent to Value Ratio
Active
$1,199,000
3
bds
|
3
ba
|
2,288
sqft
|
built
1971
18900 SW 186th St, Miami, FL 33187
$-4,223
Cash flow
-18.4%
Cash-on-Cash Return
1.9%
Cap rate
0.3%
Rent to Value Ratio
Active
$465,000
2
bds
|
2
ba
|
1,173
sqft
|
built
2004
2000 N Bayshore Dr, Miami, FL 33137
$-1,685
Cash flow
-18.9%
Cash-on-Cash Return
1.8%
Cap rate
0.8%
Rent to Value Ratio

Active
$1,250,000
2
bds
|
2
ba
|
1,400
sqft
|
built
2016
88 SW 7th St, Miami, FL 33130
$-4,805
Cash flow
-20.1%
Cash-on-Cash Return
1.5%
Cap rate
0.6%
Rent to Value Ratio
Active
$1,399,000
4
bds
|
3
ba
|
3,035
sqft
|
built
1935
1727 SW 11th Ter, Miami, FL 33135
$-6,612
Cash flow
-24.7%
Cash-on-Cash Return
0.5%
Cap rate
0.2%
Rent to Value Ratio
Active
$445,000
3
bds
|
3
ba
|
1,255
sqft
|
built
1995
17479 SW 140th Ct, Miami, FL 33177
$-879
Cash flow
-10.3%
Cash-on-Cash Return
3.8%
Cap rate
0.6%
Rent to Value Ratio
Active
$680,000
3
bds
|
2
ba
|
1,981
sqft
|
built
1972
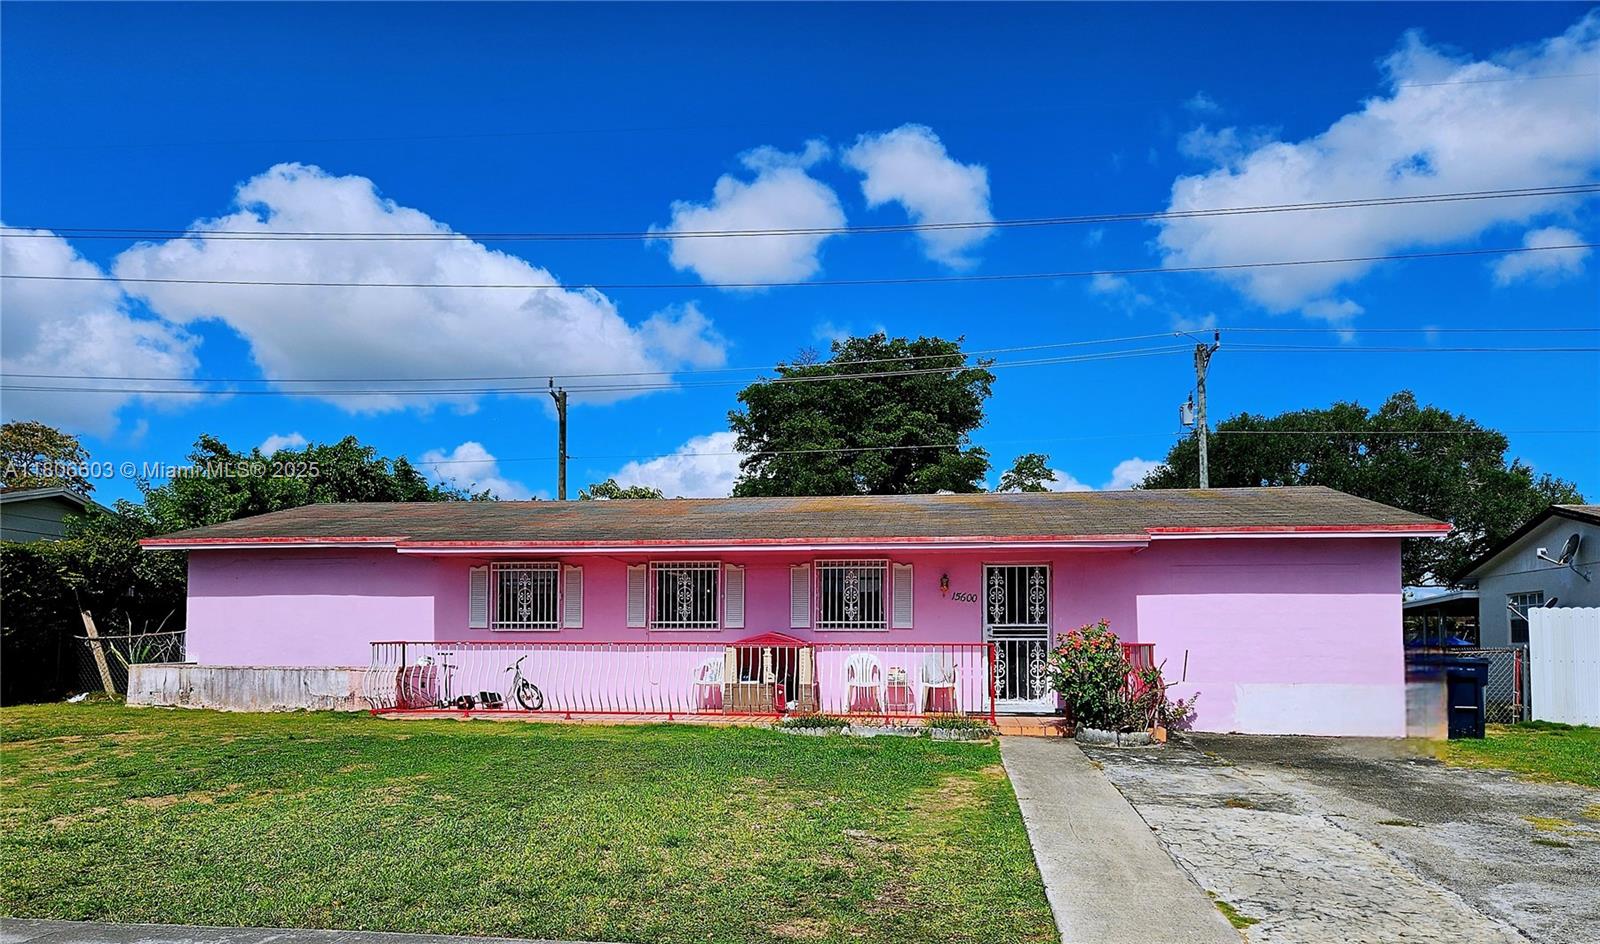
15600 SW 106th Ave, Miami, FL 33157
$-1,738
Cash flow
-13.3%
Cash-on-Cash Return
3.1%
Cap rate
0.5%
Rent to Value Ratio
Active
$2,500,000
3
bds
|
4
ba
|
2,520
sqft
|
built
1998
808 Brickell Key Dr, Miami, FL 33131
$-9,133
Cash flow
-19.1%
Cash-on-Cash Return
1.8%
Cap rate
0.5%
Rent to Value Ratio
Active
$1,699,000
3
bds
|
4
ba
|
1,698
sqft
|
built
2017
2900 NE 7th Ave, Miami, FL 33137
$-5,649
Cash flow
-17.3%
Cash-on-Cash Return
2.2%
Cap rate
0.5%
Rent to Value Ratio
Active
$799,000
1
bds
|
2
ba
|
994
sqft
|
built
2016
88 SW 7th St, Miami, FL 33130
$-2,847
Cash flow
-18.6%
Cash-on-Cash Return
1.9%
Cap rate
0.6%
Rent to Value Ratio
Active
$224,800
1
bds
|
1
ba
|
614
sqft
|
built
1973
9310 W Flagler St, Miami, FL 33174
$-8
Cash flow
-0.2%
Cash-on-Cash Return
6.1%
Cap rate
0.9%
Rent to Value Ratio
Active
$450,000
2
bds
|
2
ba
|
1,175
sqft
|
built
2002
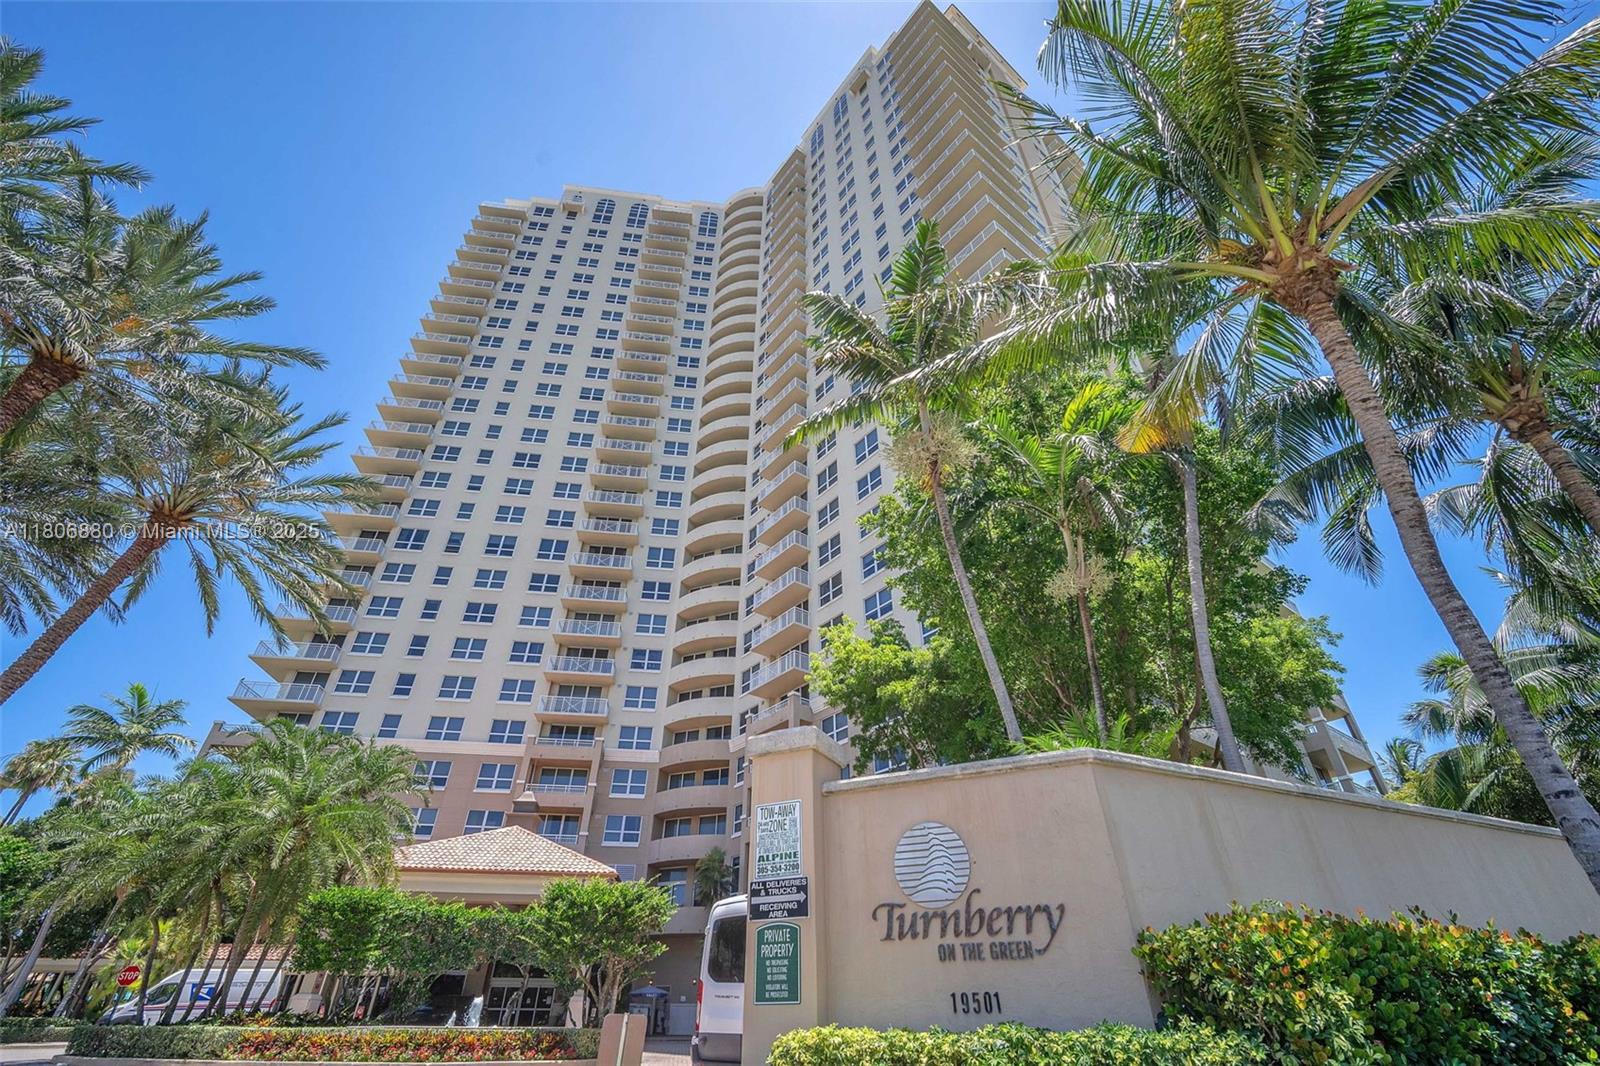
19501 E Country Club Dr, Miami, FL 33180
$-2,060
Cash flow
-23.9%
Cash-on-Cash Return
0.7%
Cap rate
0.6%
Rent to Value Ratio
Active
$465,000
3
bds
|
2
ba
|
1,241
sqft
|
built
1986
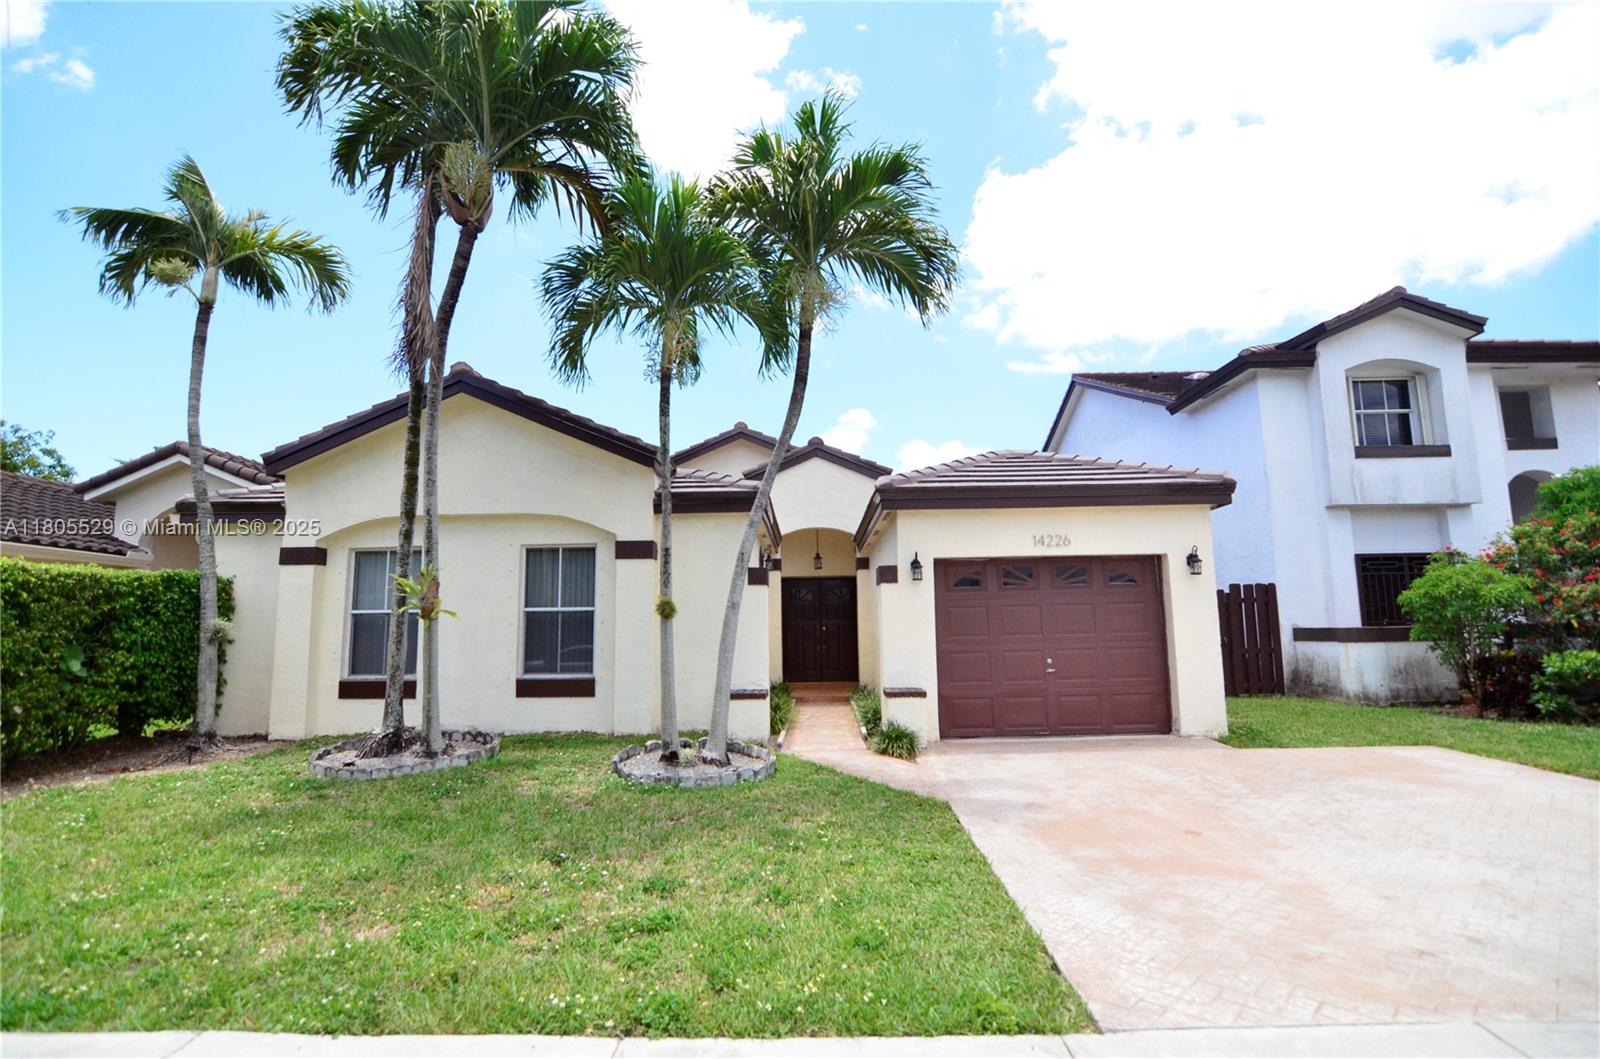
13338 SW 113th Pl, Miami, FL 33176
$-543
Cash flow
-6.1%
Cash-on-Cash Return
4.7%
Cap rate
0.7%
Rent to Value Ratio
Active
$2,699,000
5
bds
|
5
ba
|
2,690
sqft
|
built
2025
63 NW 47th Ter, Miami, FL 33127
$-11,502
Cash flow
-22.2%
Cash-on-Cash Return
1.0%
Cap rate
0.2%
Rent to Value Ratio
Active
$1,299,000
3
bds
|
3
ba
|
1,854
sqft
|
built
1950
1895 SW 25th St, Miami, FL 33133
$-3,510
Cash flow
-14.1%
Cash-on-Cash Return
2.9%
Cap rate
0.4%
Rent to Value Ratio
Active
$395,000
0
bds
|
1
ba
|
565
sqft
|
built
2016
1600 SW 1st Ave, Miami, FL 33129
$-1,366
Cash flow
-18.0%
Cash-on-Cash Return
2.0%
Cap rate
0.7%
Rent to Value Ratio
Active
$265,000
2
bds
|
2
ba
|
870
sqft
|
built
1972
9320 Fontainebleau Blvd, Miami, FL 33172
$-532
Cash flow
-10.5%
Cash-on-Cash Return
3.7%
Cap rate
0.9%
Rent to Value Ratio

Active
$380,000
0
bds
|
1
ba
|
507
sqft
|
built
2005
335 S Biscayne Blvd, Miami, FL 33131
$-1,024
Cash flow
-14.1%
Cash-on-Cash Return
2.9%
Cap rate
0.7%
Rent to Value Ratio
Active
$999,000
3
bds
|
3
ba
|
1,624
sqft
|
built
1982
520 Brickell Key Dr, Miami, FL 33131
$-2,526
Cash flow
-13.2%
Cash-on-Cash Return
3.1%
Cap rate
0.8%
Rent to Value Ratio
Active
$385,000
1
bds
|
1
ba
|
735
sqft
|
built
1990
770 Claughton Island Dr, Miami, FL 33131
$-1,369
Cash flow
-18.6%
Cash-on-Cash Return
1.9%
Cap rate
0.8%
Rent to Value Ratio
Active
$16,250,000
5
bds
|
7
ba
|
6,476
sqft
|
built
2018
2821 S Bayshore Dr, Miami, FL 33133
$-100,232
Cash flow
-32.2%
Cash-on-Cash Return
-1.3%
Cap rate
0.0%
Rent to Value Ratio
Active
$790,000
6
bds
|
0
ba
|
2,534
sqft
|
built
2021
5445 NW 5th Ct, Miami, FL 33127
$-3,013
Cash flow
-19.9%
Cash-on-Cash Return
1.6%
Cap rate
0.4%
Rent to Value Ratio
Active
$199,900
1
bds
|
1
ba
|
0
sqft
|
built
1949
3698 William Ave, Miami, FL 33133
$44
Cash flow
1.1%
Cash-on-Cash Return
6.4%
Cap rate
0.9%
Rent to Value Ratio