Miami, FL Investment Properties for Sale
Browse homes for sale and investment properties in Miami, FL. Refine your search by price, property type, or more.
Best cash flowing properties in Miami, FL
Active
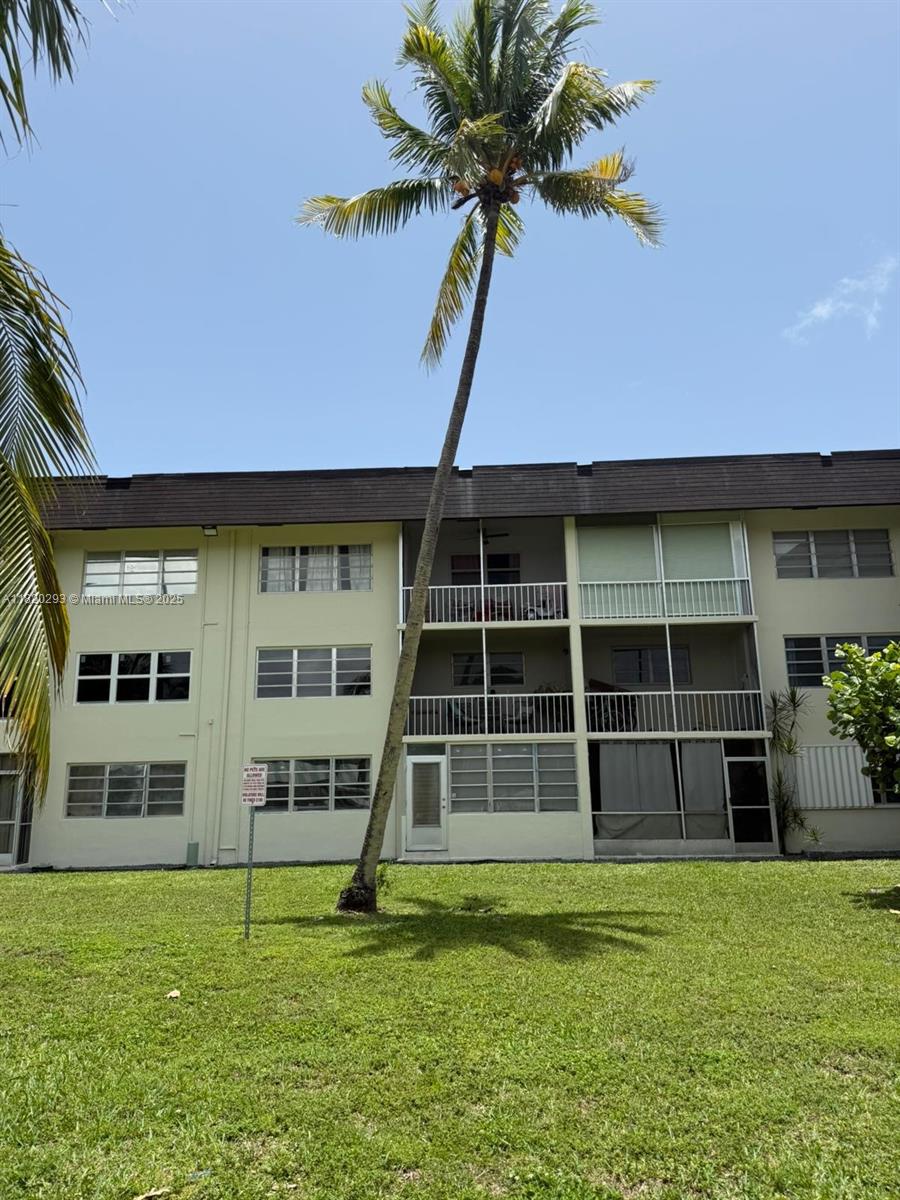
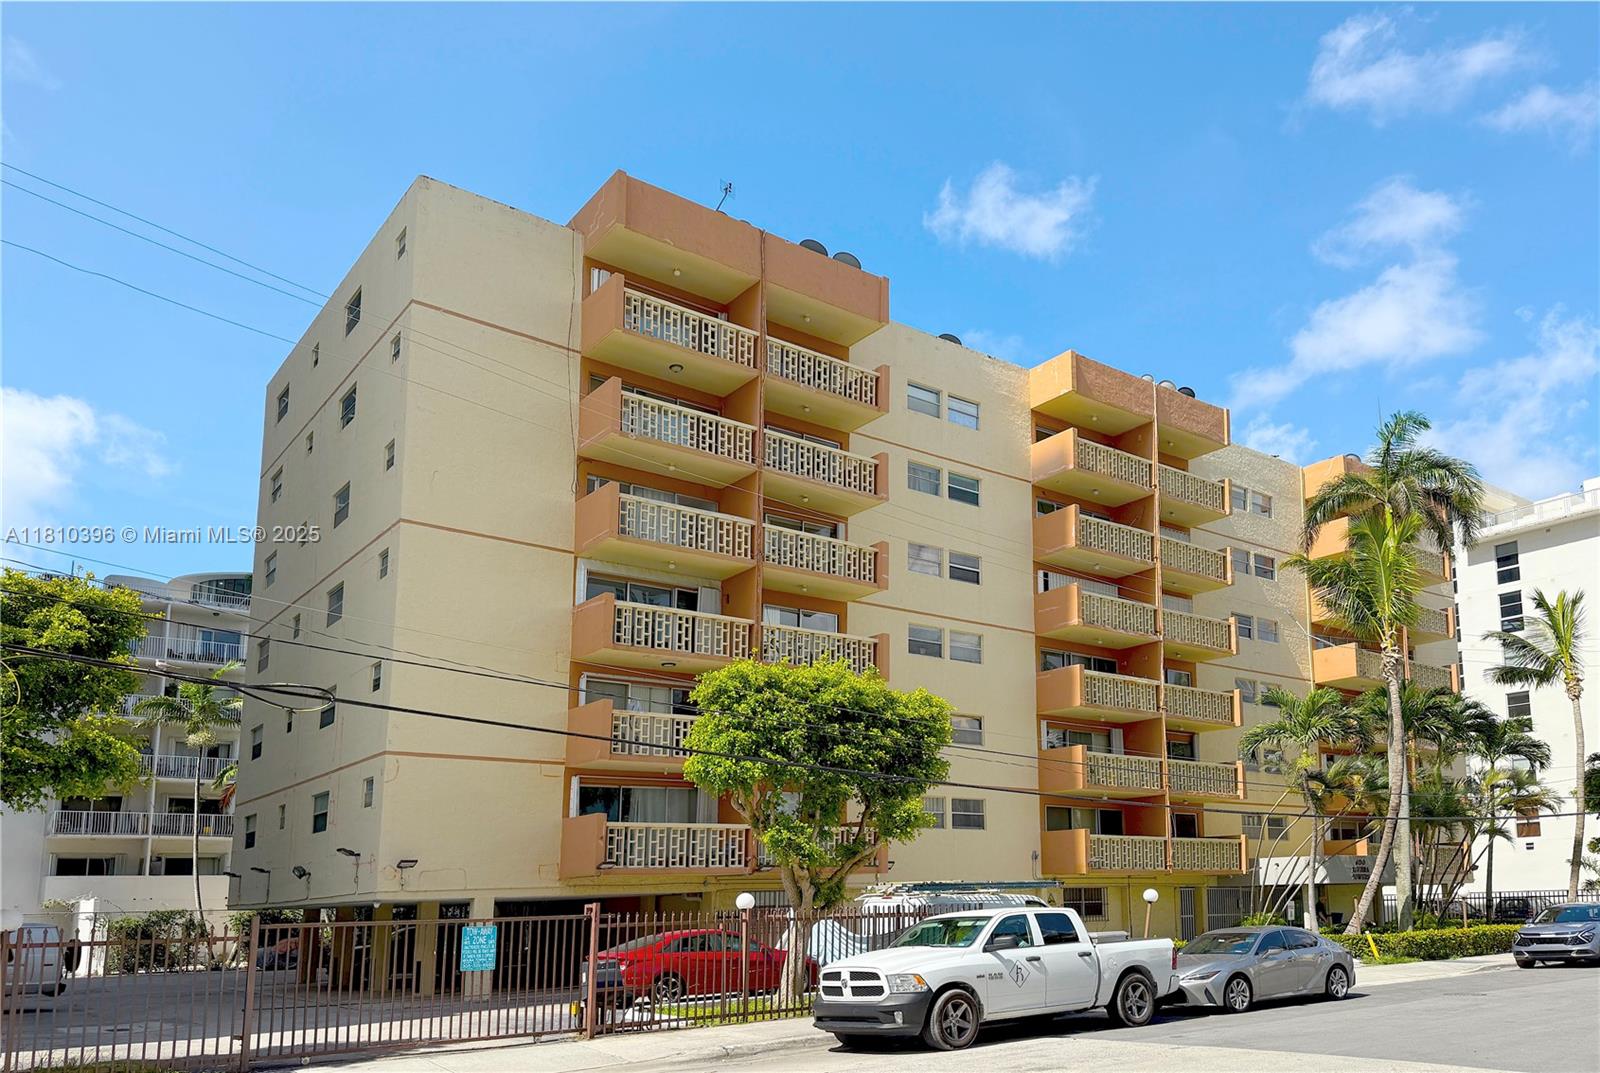
$140,000
1
bds
|
2
ba
|
954
sqft
|
built
1967
1540 NE 191st St, Miami, FL 33179
$-272
Cash flow
-10.1%
Cash-on-Cash Return
4.0%
Cap rate
1.3%
Rent to Value Ratio
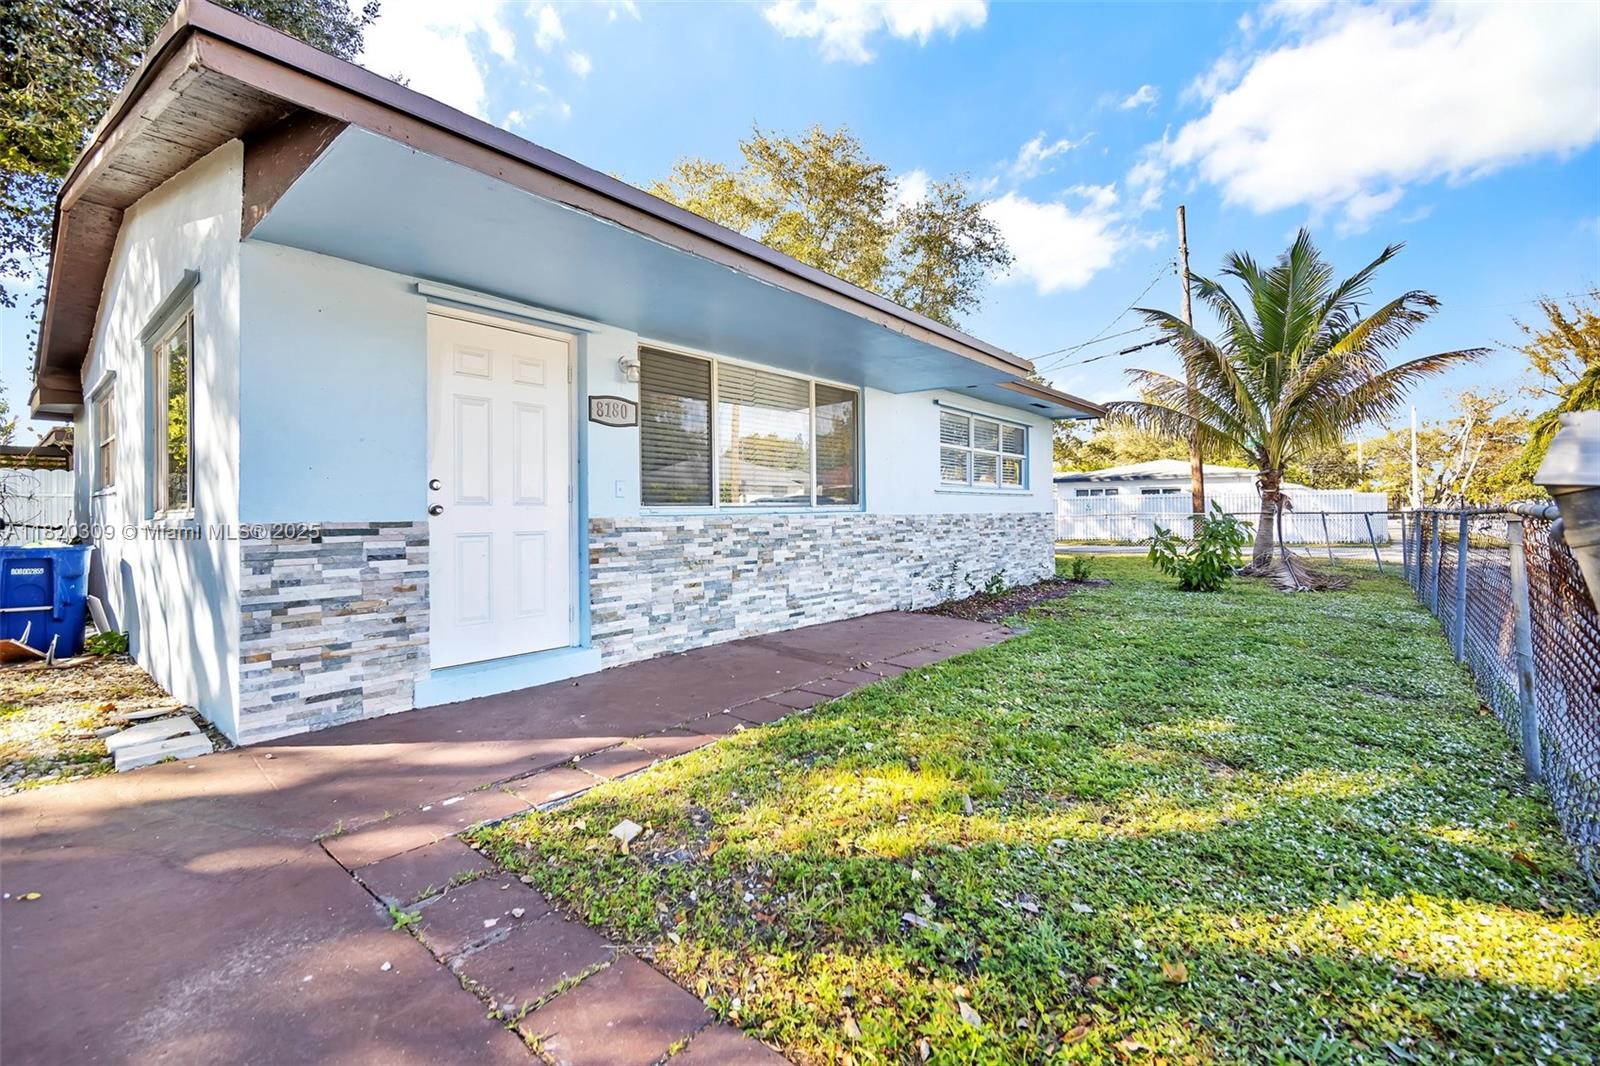
Active
$375,000
2
bds
|
1
ba
|
875
sqft
|
built
1964
8180 NW 13th Ave, Miami, FL 33147
$-283
Cash flow
-3.9%
Cash-on-Cash Return
5.4%
Cap rate
0.7%
Rent to Value Ratio
6,349 out of 7,208 properties for sale in Miami, FL
Limited Results Shown
Create a free account, or log in to reveal all property listings and enjoy the complete experience.
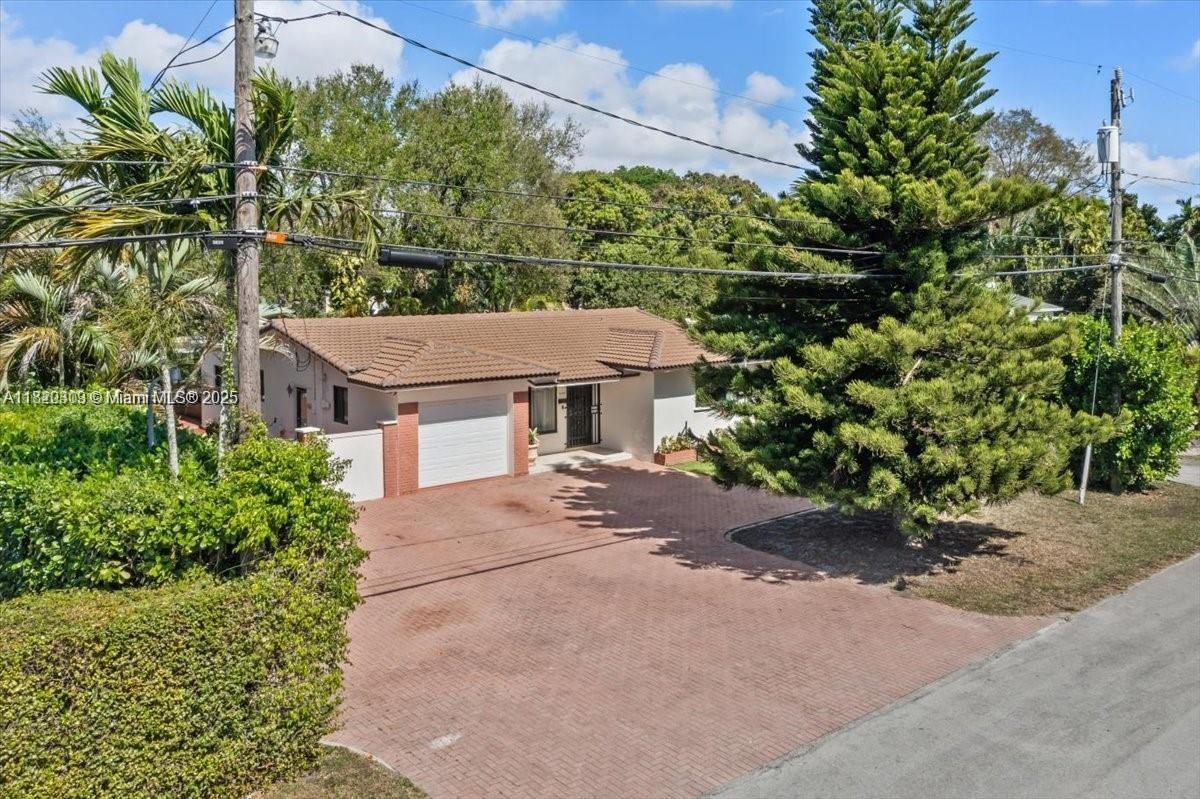
Active
$1,395,000
3
bds
|
2
ba
|
1,589
sqft
|
built
1968
6385 SW 25th St, Miami, FL 33155
$-4,467
Cash flow
-16.7%
Cash-on-Cash Return
2.4%
Cap rate
0.3%
Rent to Value Ratio
Active
$375,000
2
bds
|
1
ba
|
875
sqft
|
built
1964
8180 NW 13th Ave, Miami, FL 33147
$-283
Cash flow
-3.9%
Cash-on-Cash Return
5.4%
Cap rate
0.7%
Rent to Value Ratio
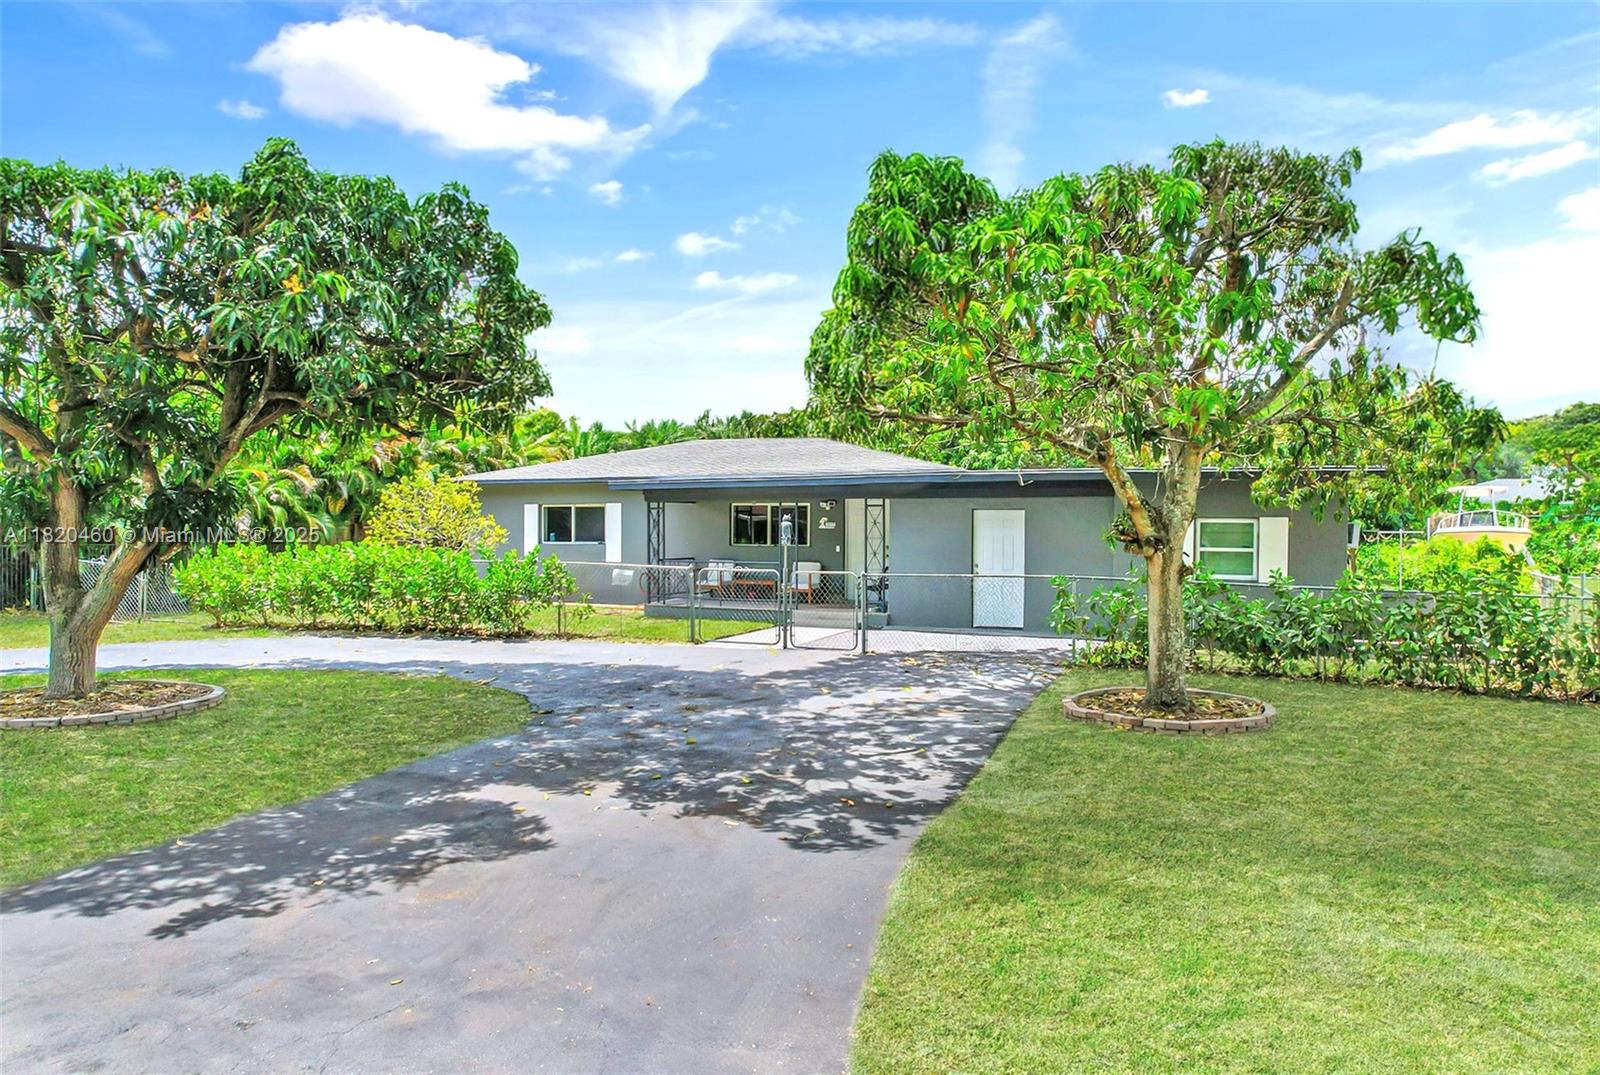
Active
$585,000
2
bds
|
0
ba
|
1,469
sqft
|
built
1953
13320 N Miami Ave, Miami, FL 33168
$-1,254
Cash flow
-11.2%
Cash-on-Cash Return
3.7%
Cap rate
0.5%
Rent to Value Ratio

Active
$269,000
2
bds
|
2
ba
|
935
sqft
|
built
1965
1719 NE Miami Gardens Dr, Miami, FL 33179
$-712
Cash flow
-13.8%
Cash-on-Cash Return
3.1%
Cap rate
0.7%
Rent to Value Ratio
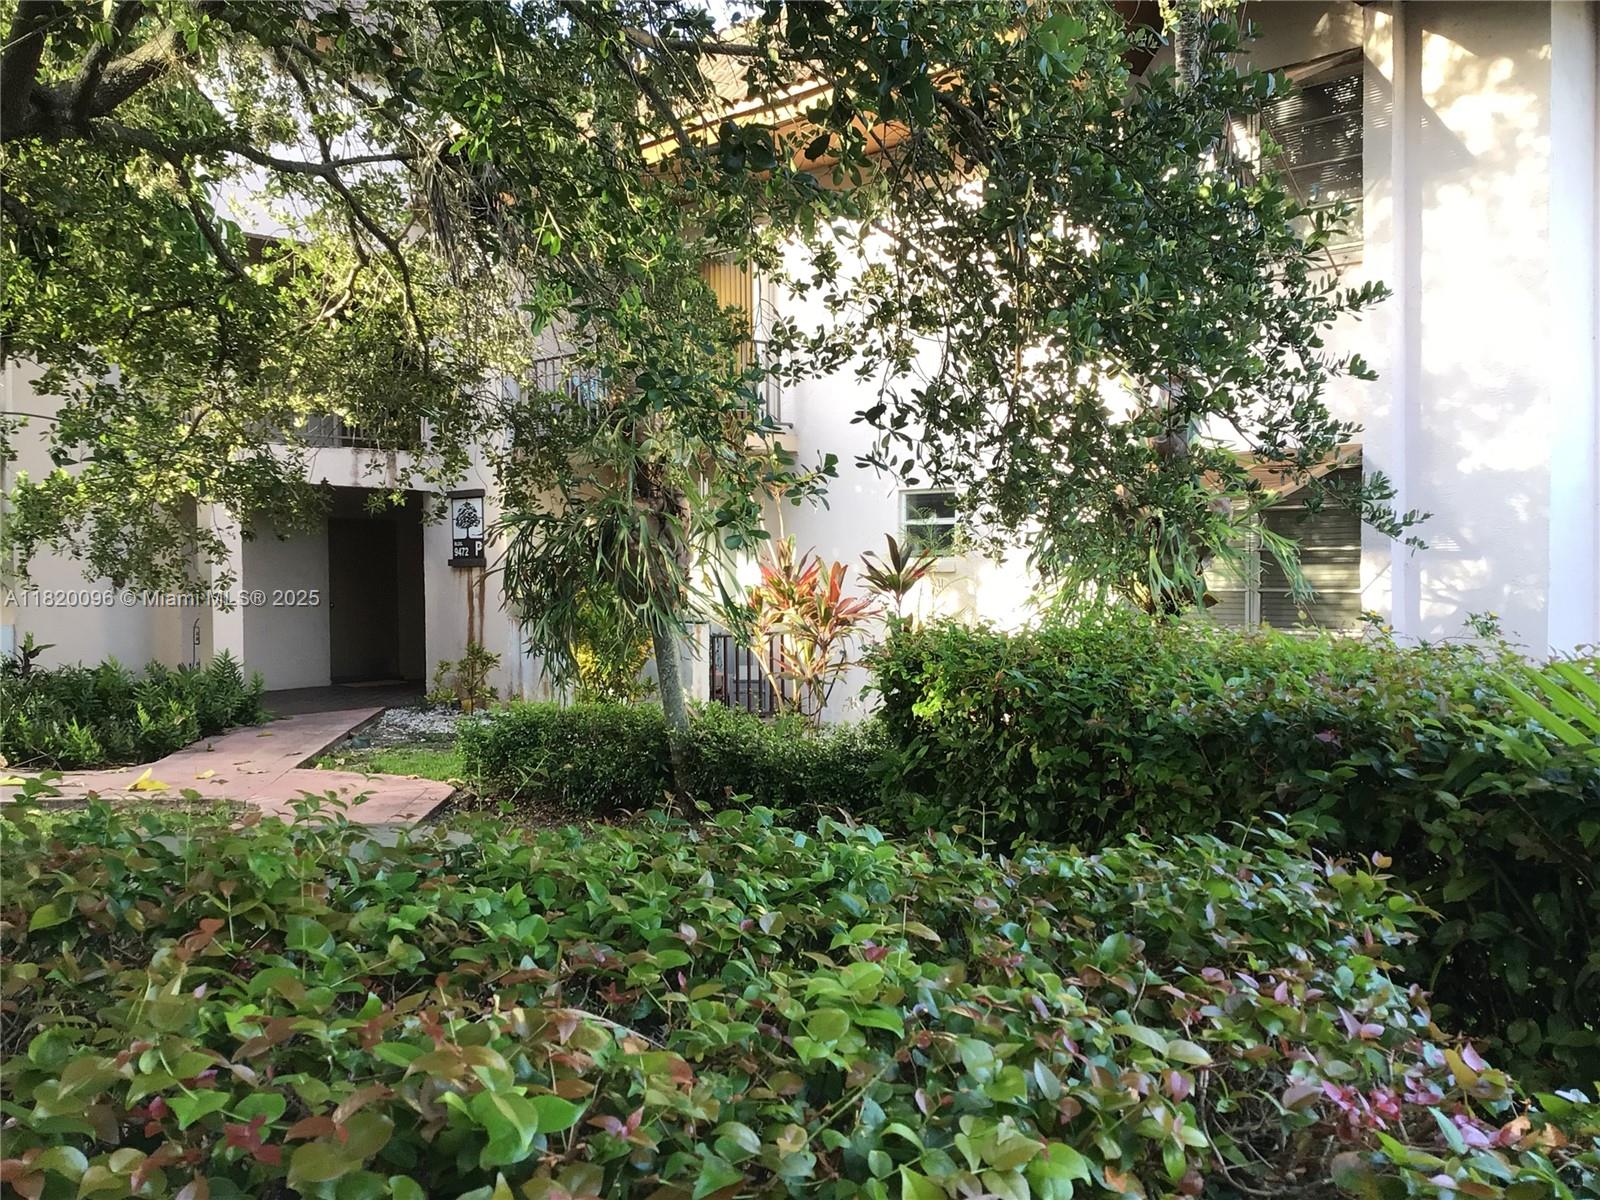
Active
$350,000
2
bds
|
2
ba
|
1,092
sqft
|
built
1967
9472 SW 77th Ave, Miami, FL 33156
$-716
Cash flow
-10.7%
Cash-on-Cash Return
3.8%
Cap rate
0.7%
Rent to Value Ratio
Active
$4,800,000
4
bds
|
3
ba
|
2,171
sqft
|
built
1949
520 Bay Point Rd, Miami, FL 33137
$-25,752
Cash flow
-28.0%
Cash-on-Cash Return
-0.1%
Cap rate
0.1%
Rent to Value Ratio
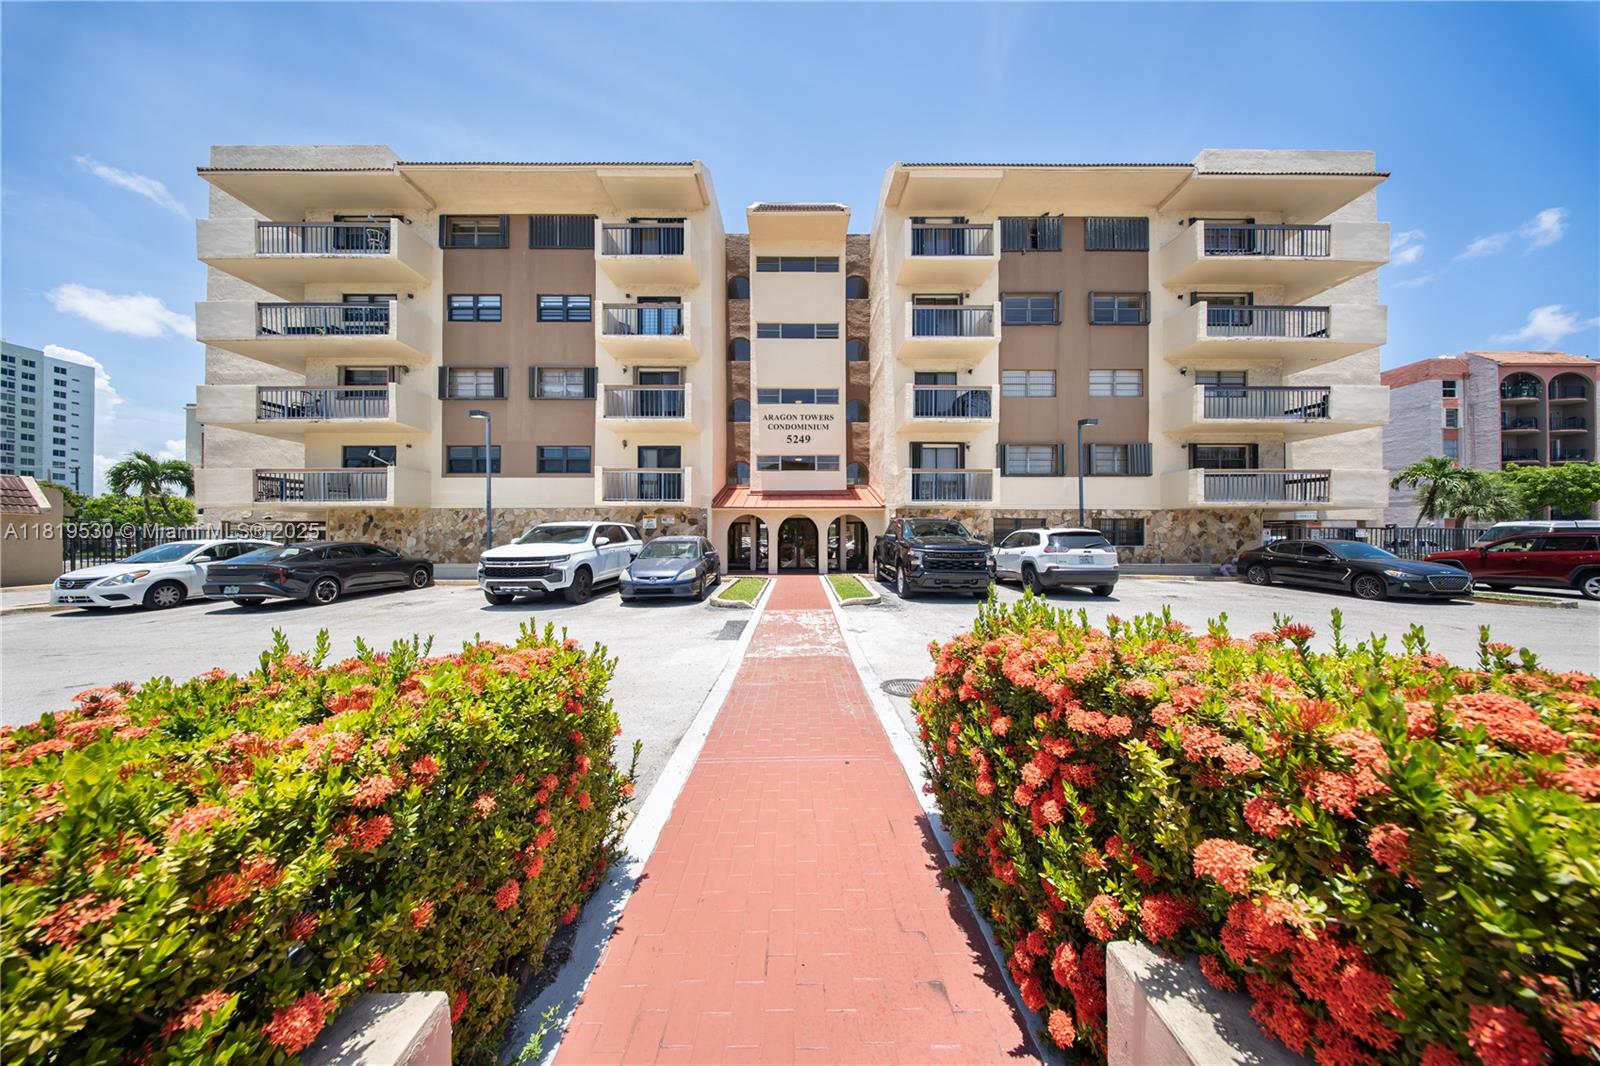
Active
$285,000
2
bds
|
2
ba
|
848
sqft
|
built
1985
5249 NW 7th St, Miami, FL 33126
$-745
Cash flow
-13.6%
Cash-on-Cash Return
3.2%
Cap rate
0.8%
Rent to Value Ratio
Active
$140,000
1
bds
|
2
ba
|
954
sqft
|
built
1967
1540 NE 191st St, Miami, FL 33179
$-272
Cash flow
-10.1%
Cash-on-Cash Return
4.0%
Cap rate
1.3%
Rent to Value Ratio
Active
$699,999
3
bds
|
2
ba
|
1,641
sqft
|
built
1999
14848 SW 181st Ter, Miami, FL 33187
$-1,914
Cash flow
-14.3%
Cash-on-Cash Return
3.0%
Cap rate
0.5%
Rent to Value Ratio
Active
$449,000
2
bds
|
1
ba
|
692
sqft
|
built
1966
3240 Mary St, Miami, FL 33133
$-1,481
Cash flow
-17.2%
Cash-on-Cash Return
2.3%
Cap rate
0.6%
Rent to Value Ratio
Active
$949,999
5
bds
|
3
ba
|
1,599
sqft
|
built
1954
225 NE 150th St, Miami, FL 33161
$-841
Cash flow
-4.6%
Cash-on-Cash Return
5.2%
Cap rate
0.7%
Rent to Value Ratio
Active
$315,000
2
bds
|
2
ba
|
993
sqft
|
built
1985
9810 Hammocks Blvd, Miami, FL 33196
$-788
Cash flow
-13.1%
Cash-on-Cash Return
3.3%
Cap rate
0.7%
Rent to Value Ratio
Active
$450,000
1
bds
|
2
ba
|
838
sqft
|
built
2004
1250 S Miami Ave, Miami, FL 33130
$-1,816
Cash flow
-21.1%
Cash-on-Cash Return
1.4%
Cap rate
0.6%
Rent to Value Ratio
Active
$700,000
2
bds
|
2
ba
|
1,424
sqft
|
built
1980
1925 Brickell Ave, Miami, FL 33129
$-3,019
Cash flow
-22.5%
Cash-on-Cash Return
1.1%
Cap rate
0.6%
Rent to Value Ratio
Active
$1,790,000
3
bds
|
3
ba
|
1,708
sqft
|
built
2010
2020 N Bayshore Dr, Miami, FL 33137
$-6,871
Cash flow
-20.0%
Cash-on-Cash Return
1.7%
Cap rate
0.6%
Rent to Value Ratio
Active
$1,449,900
4
bds
|
3
ba
|
3,475
sqft
|
built
1999
9753 SW 93rd Ter, Miami, FL 33176
$-3,011
Cash flow
-10.8%
Cash-on-Cash Return
3.8%
Cap rate
0.6%
Rent to Value Ratio
Active
$460,000
2
bds
|
2
ba
|
1,229
sqft
|
built
1982
780 NE 69th St, Miami, FL 33138
$-2,050
Cash flow
-23.3%
Cash-on-Cash Return
0.9%
Cap rate
0.7%
Rent to Value Ratio
Active
$568,500
2
bds
|
2
ba
|
986
sqft
|
built
1978
1440 Brickell Bay Dr, Miami, FL 33131
$-1,761
Cash flow
-16.2%
Cash-on-Cash Return
2.6%
Cap rate
0.7%
Rent to Value Ratio
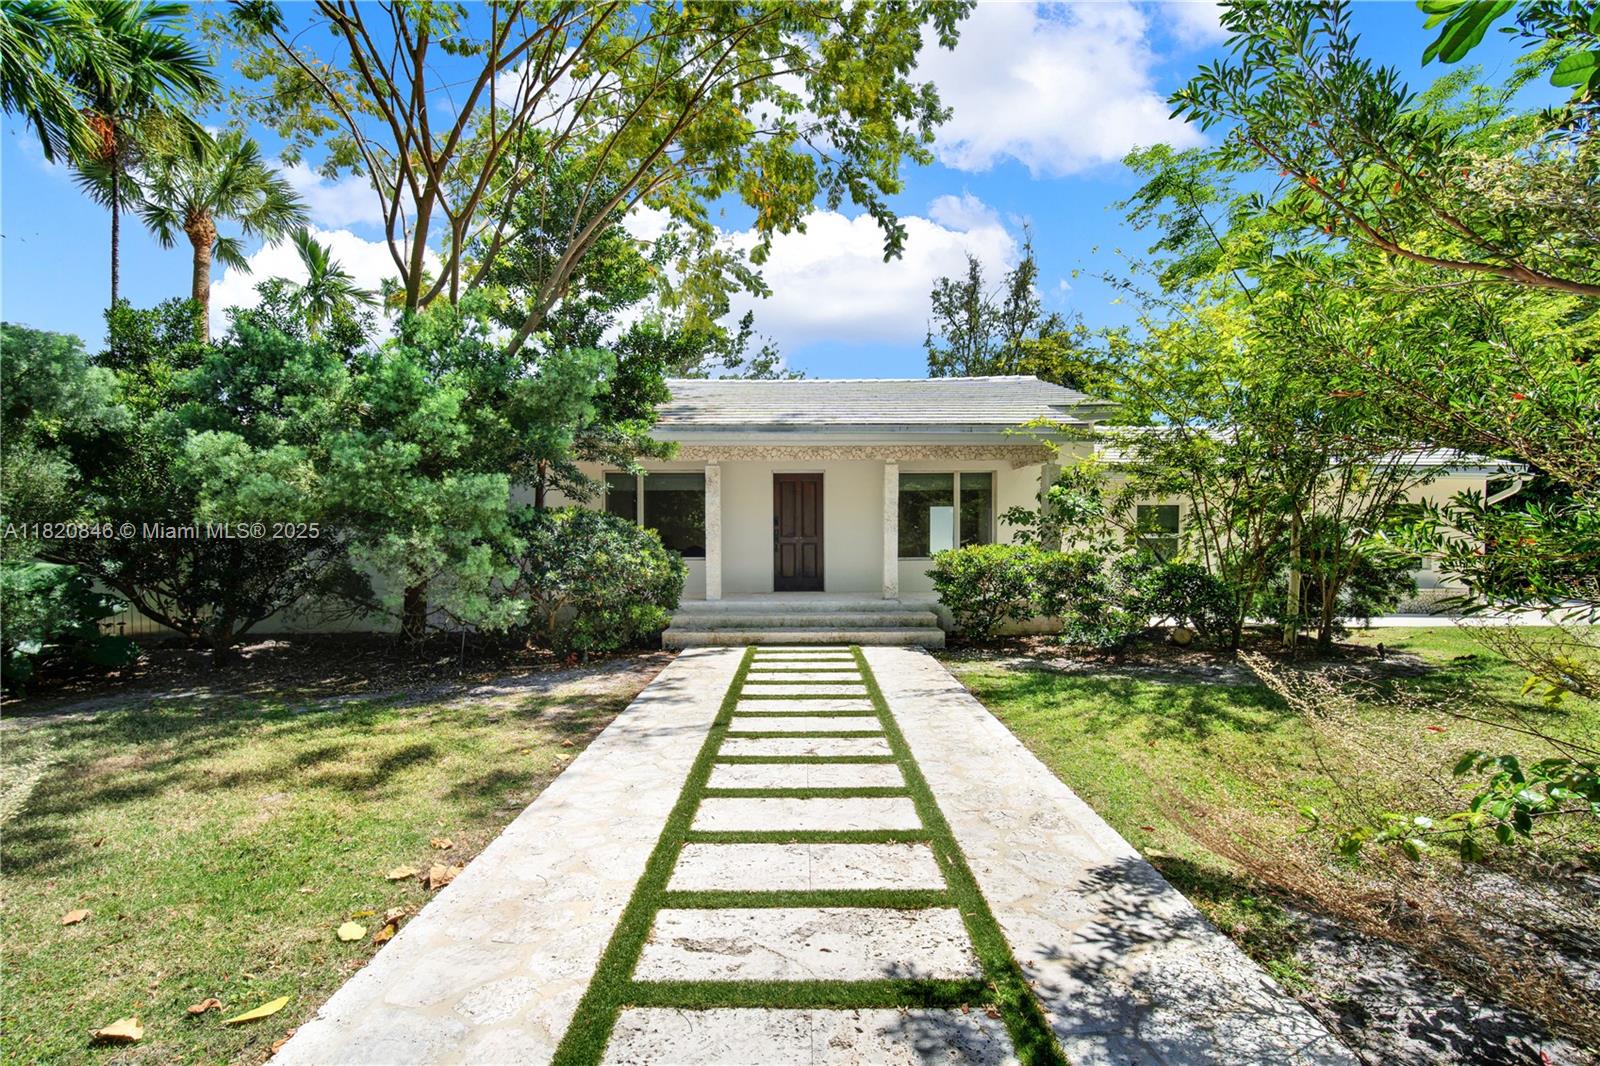
Active
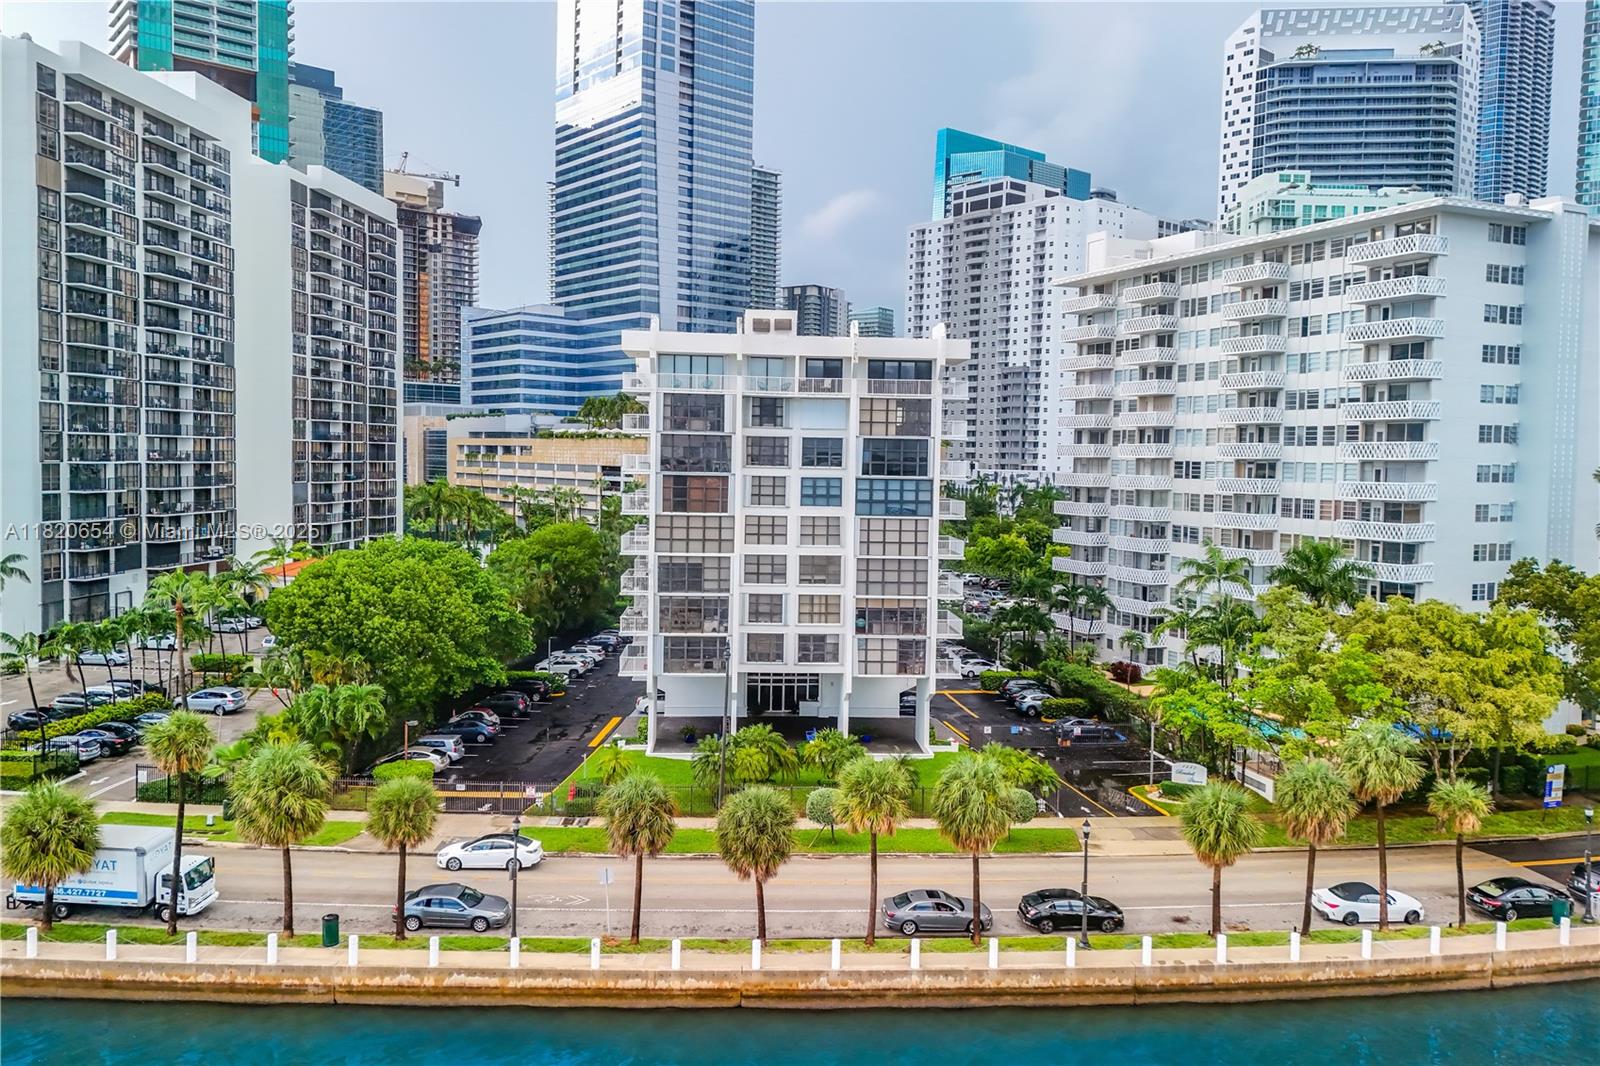
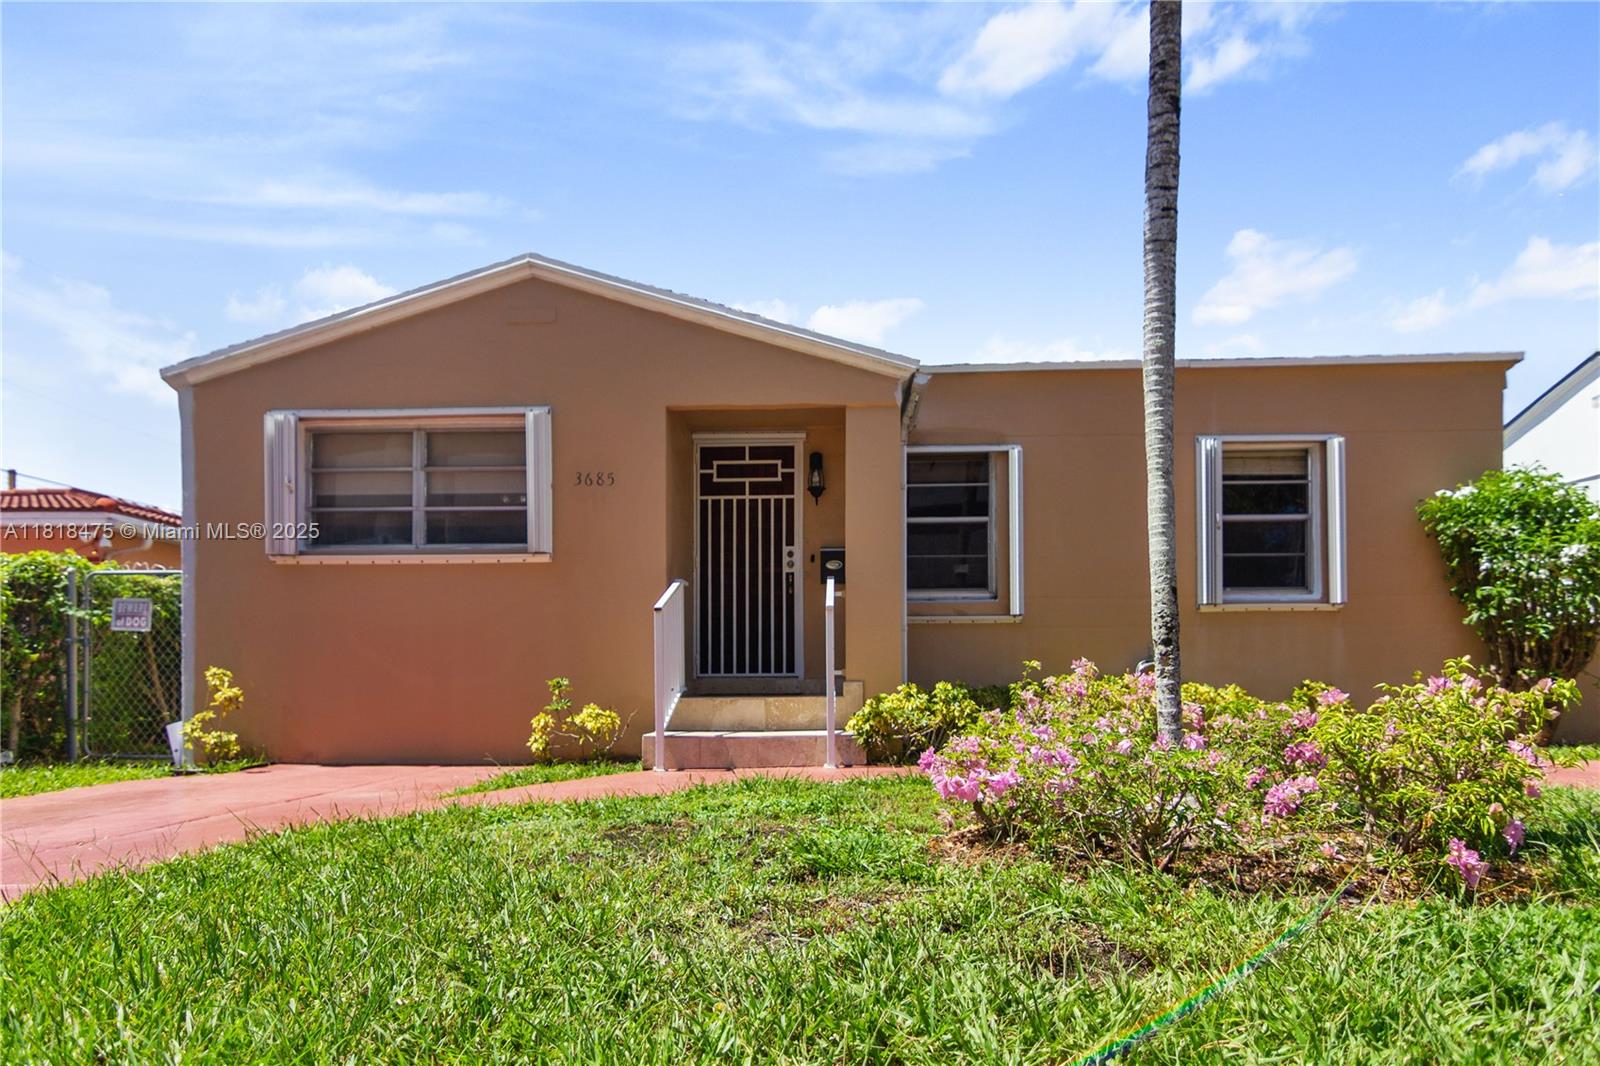
$750,000
3
bds
|
2
ba
|
1,263
sqft
|
built
1940
3685 SW 26th St, Miami, FL 33133
$-1,404
Cash flow
-9.8%
Cash-on-Cash Return
4.0%
Cap rate
0.5%
Rent to Value Ratio
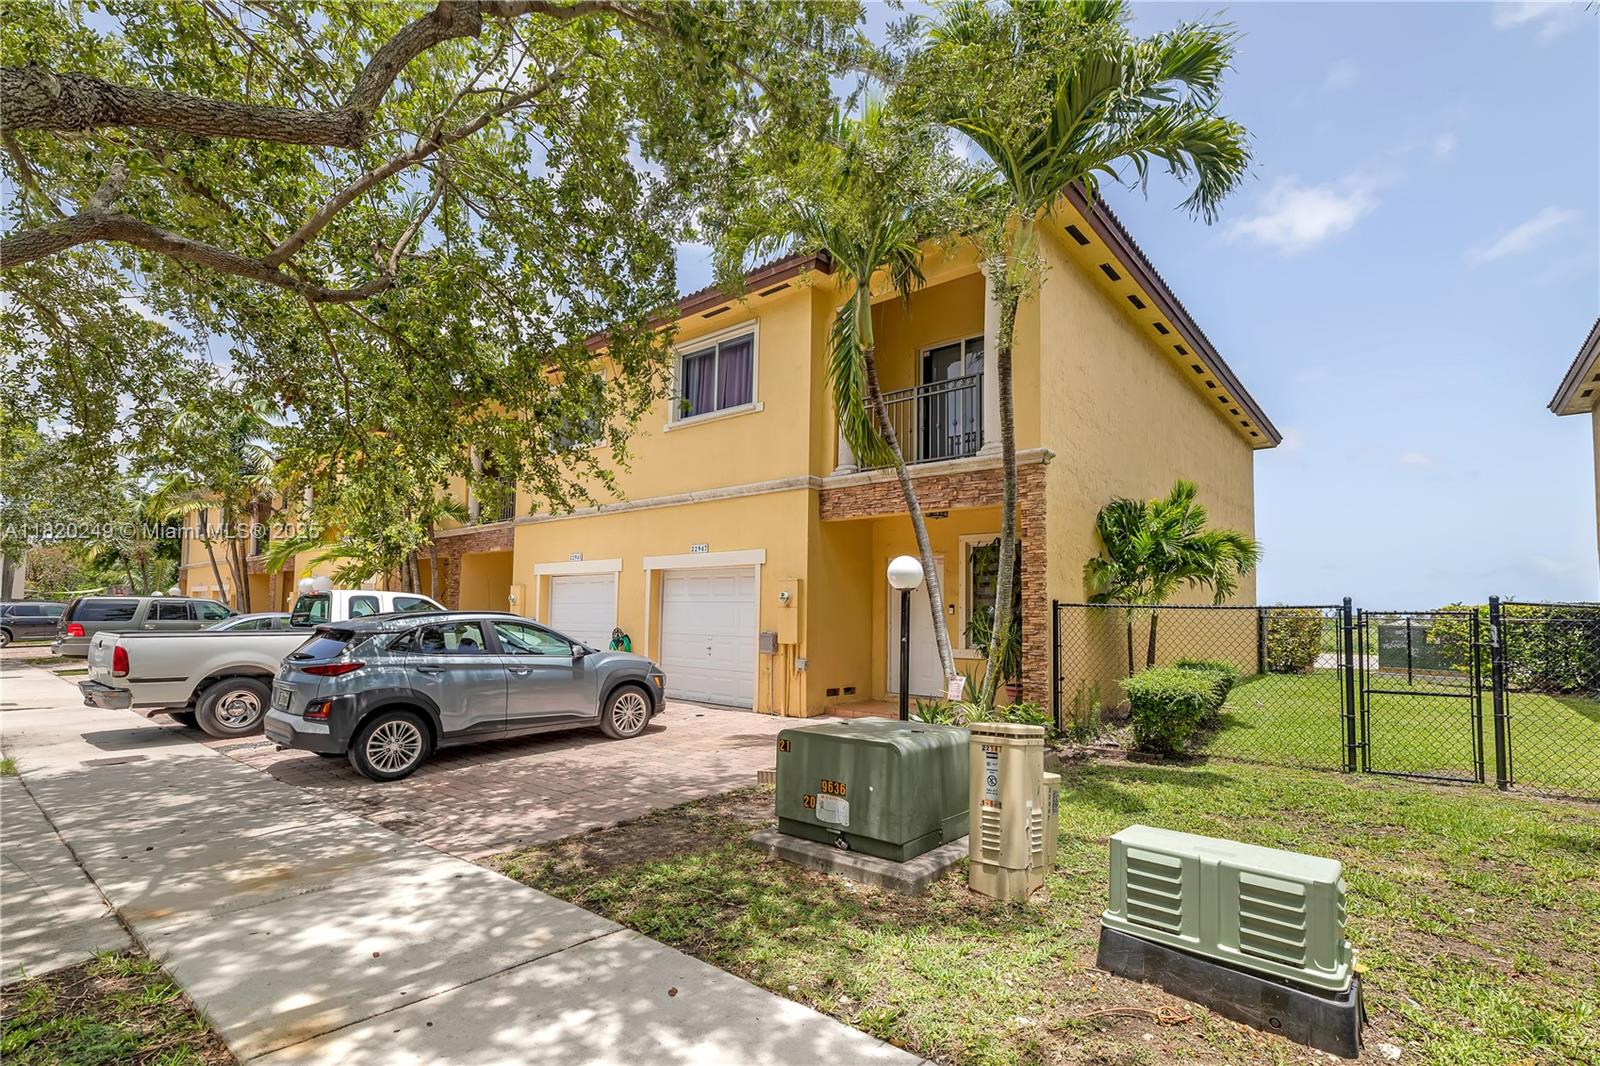
Active
$420,000
4
bds
|
3
ba
|
1,698
sqft
|
built
2006
22947 SW 112th Ct, Miami, FL 33170
$-673
Cash flow
-8.4%
Cash-on-Cash Return
4.4%
Cap rate
0.7%
Rent to Value Ratio
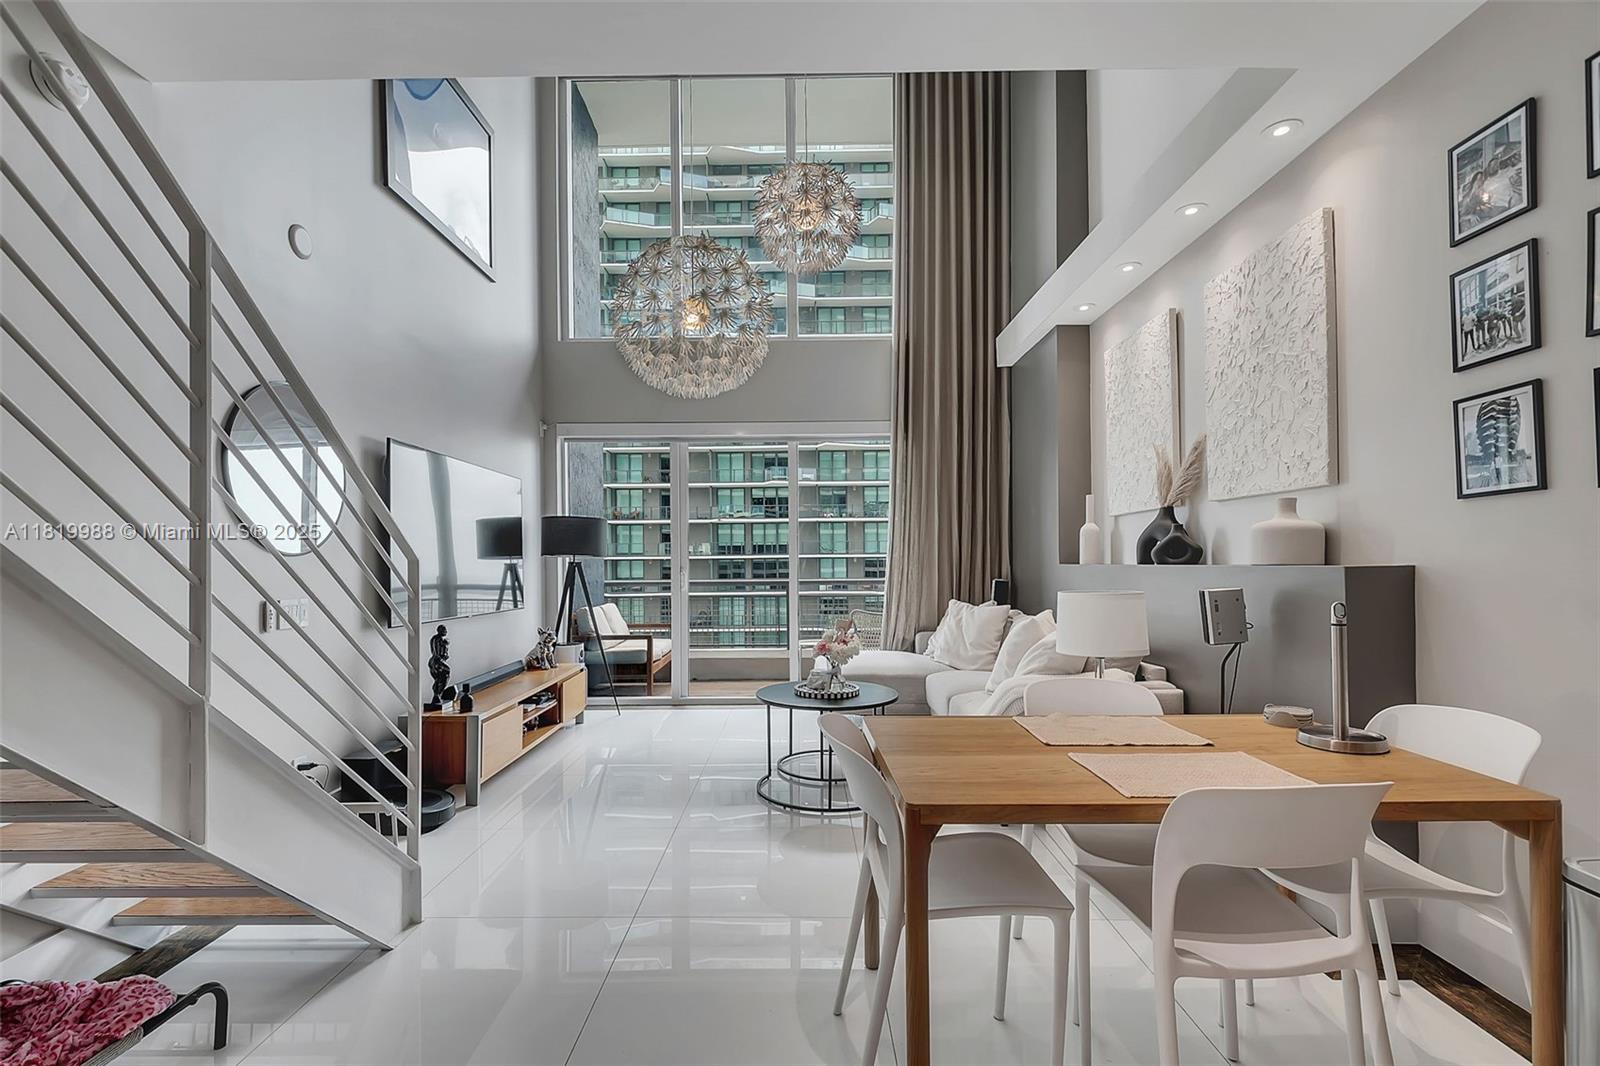
Active
$615,000
2
bds
|
3
ba
|
1,148
sqft
|
built
2008
60 SW 13th St, Miami, FL 33130
$-2,261
Cash flow
-19.2%
Cash-on-Cash Return
1.9%
Cap rate
0.8%
Rent to Value Ratio
Active
$285,000
1
bds
|
1
ba
|
728
sqft
|
built
1974
600 NE 25th St, Miami, FL 33137
$-1,000
Cash flow
-18.3%
Cash-on-Cash Return
2.1%
Cap rate
0.8%
Rent to Value Ratio
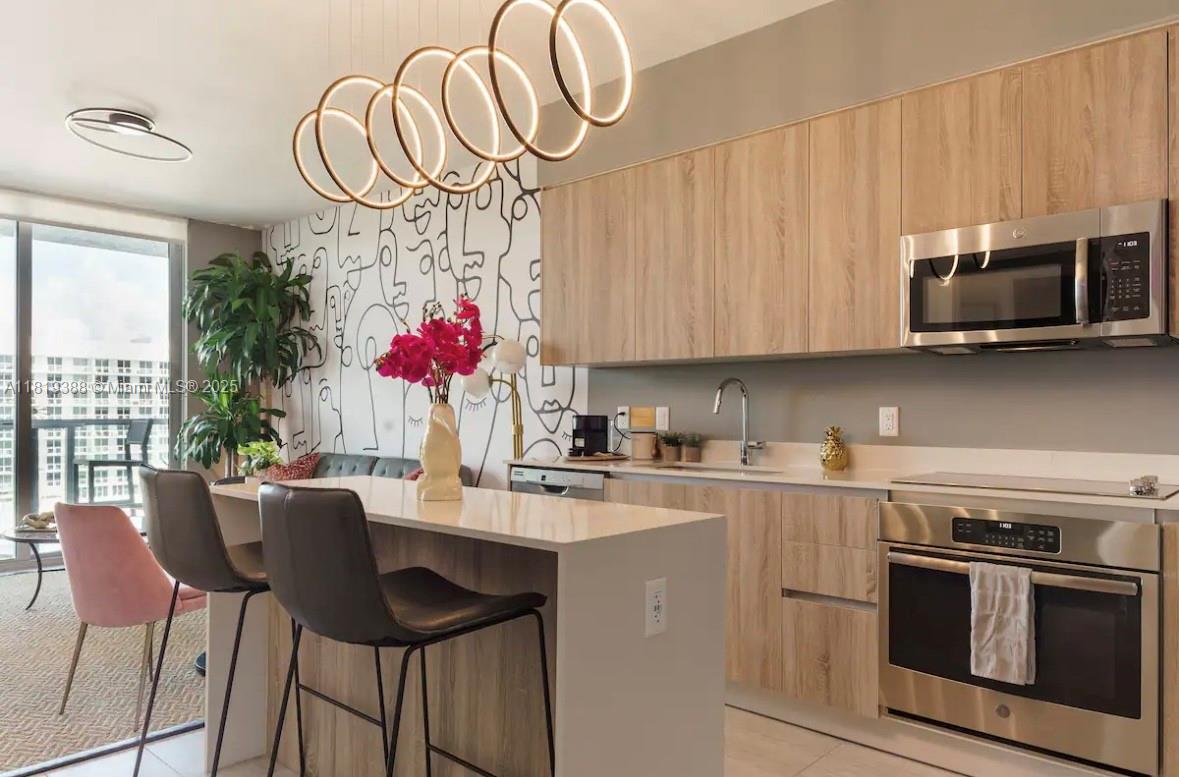
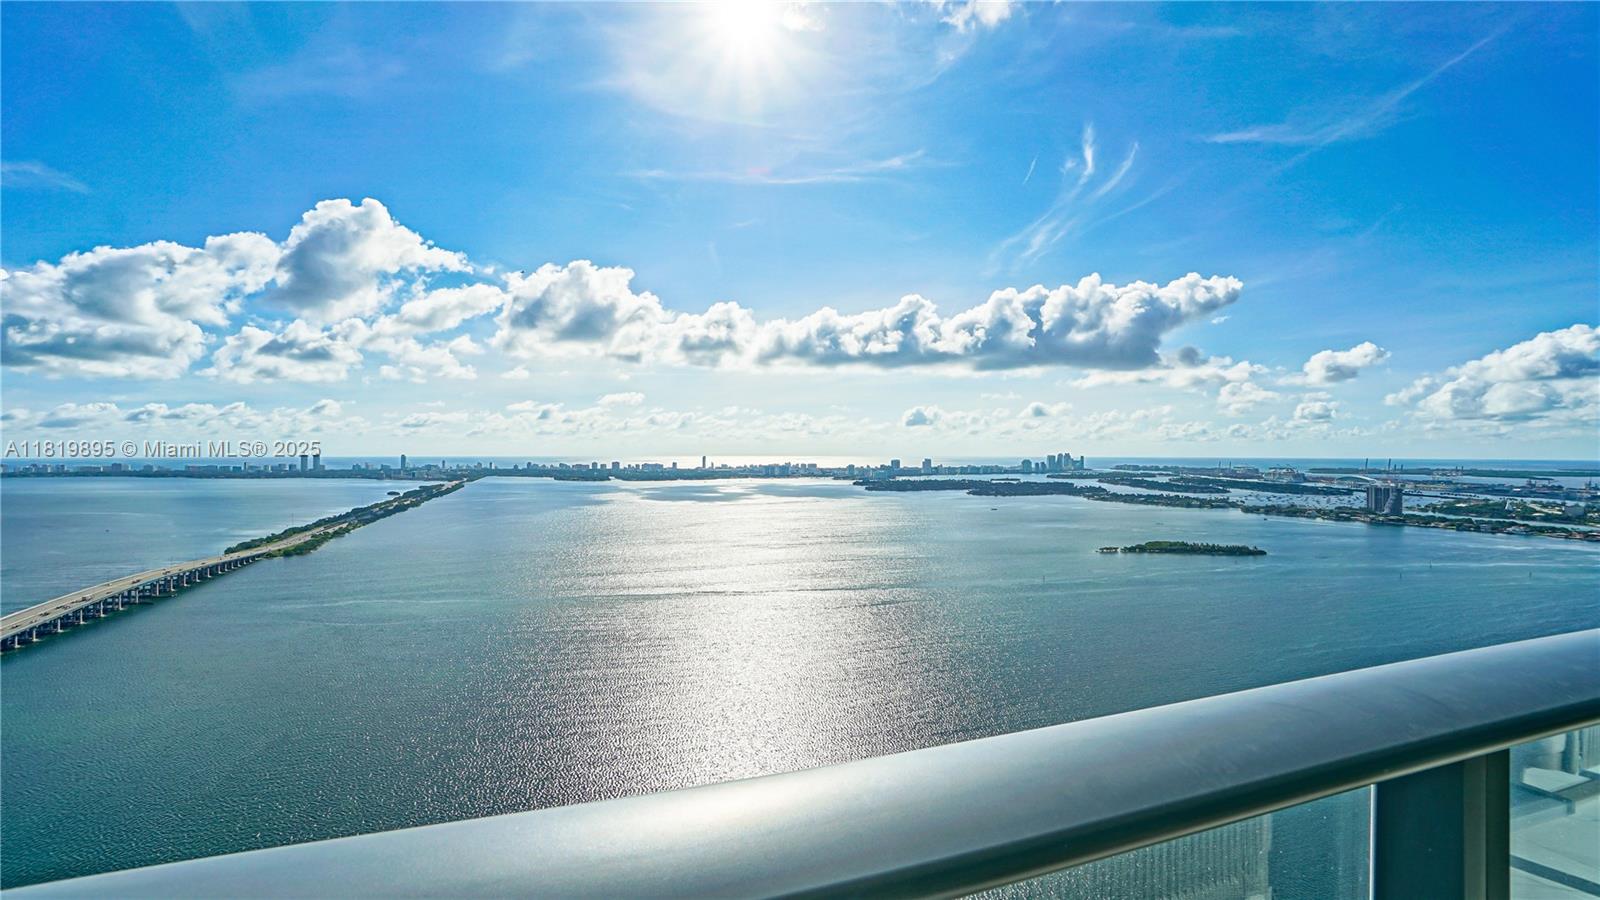
Active
$530,000
1
bds
|
1
ba
|
636
sqft
|
built
2020
3900 Biscayne Blvd, Miami, FL 33137
$-1,093
Cash flow
-10.8%
Cash-on-Cash Return
3.8%
Cap rate
0.8%
Rent to Value Ratio
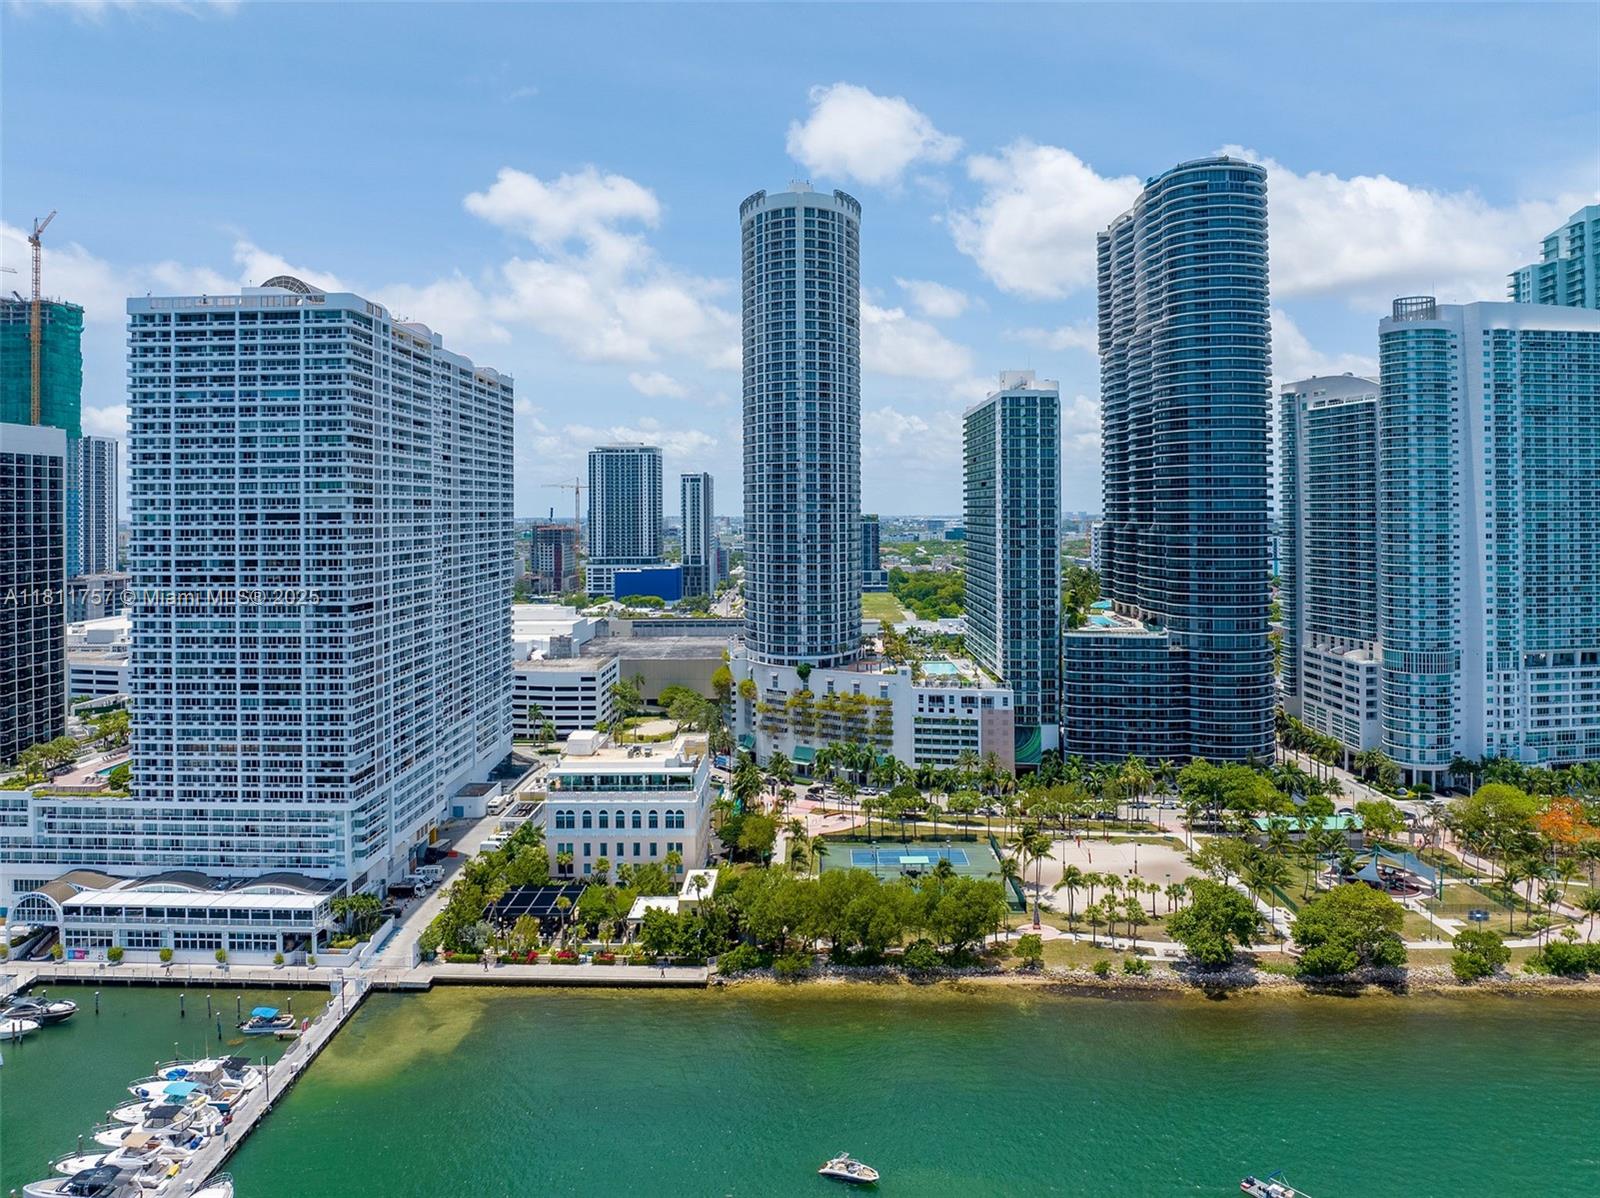
Active
$295,000
bds
|
1
ba
|
508
sqft
|
built
2007
1750 N Bayshore Dr, Miami, FL 33132
$-773
Cash flow
-13.7%
Cash-on-Cash Return
3.1%
Cap rate
0.8%
Rent to Value Ratio
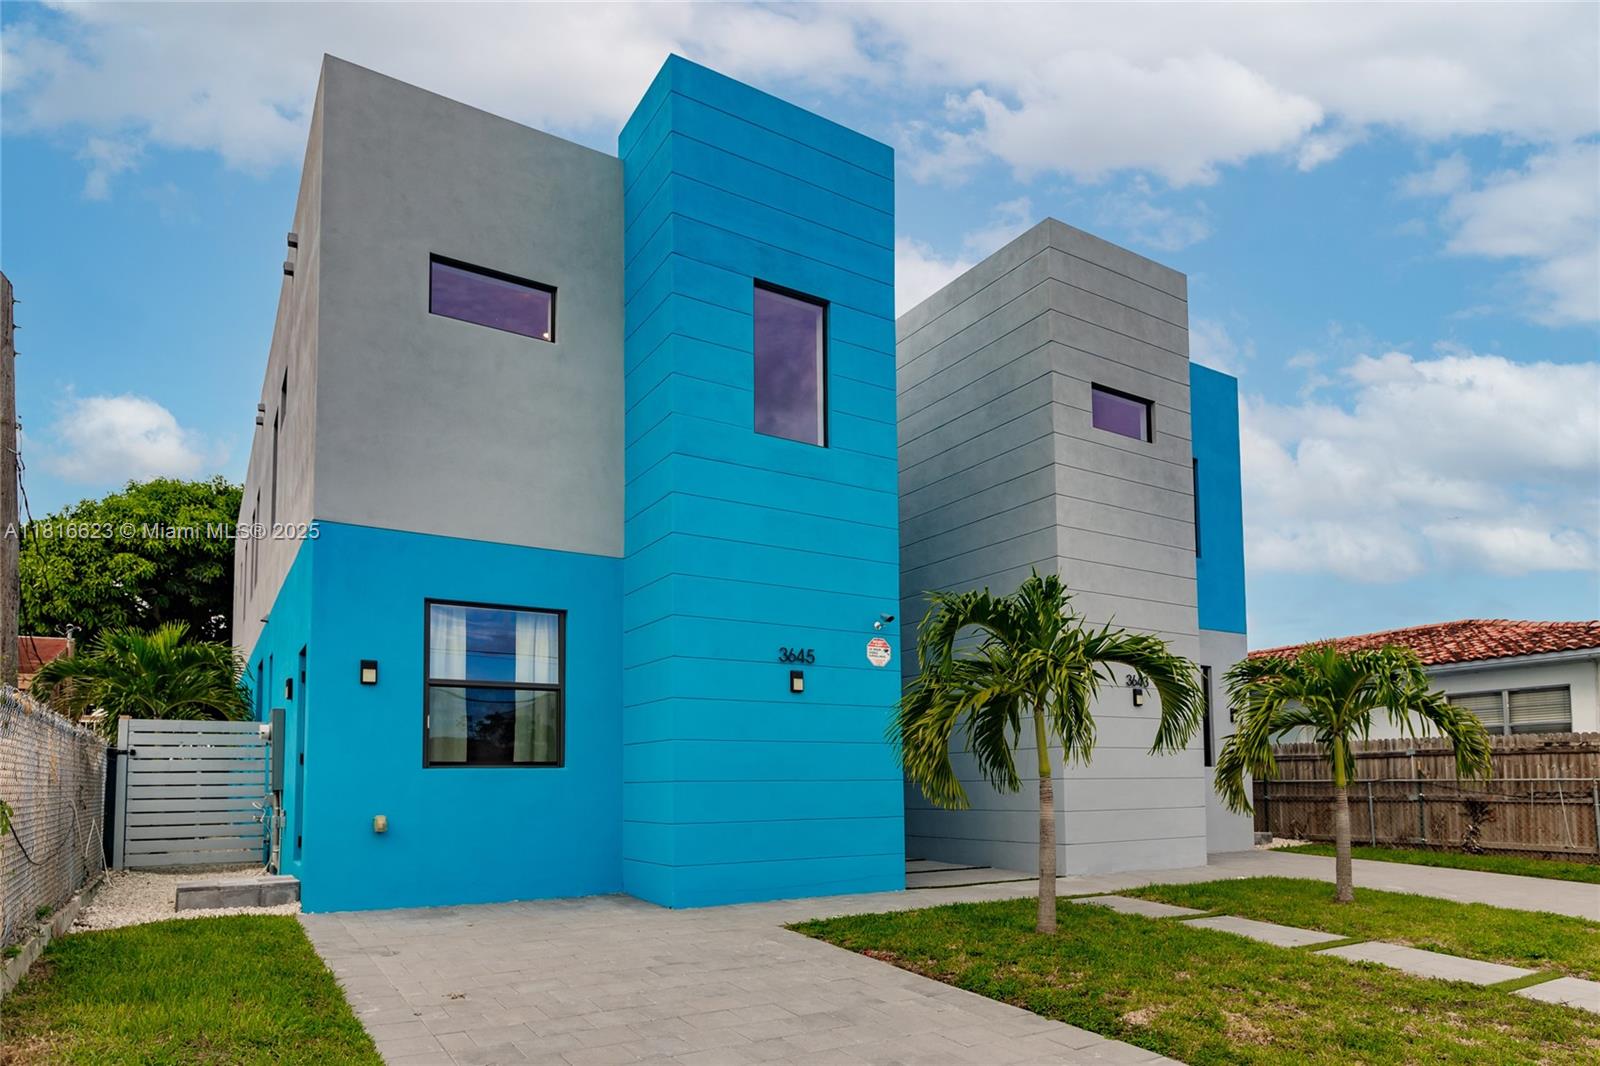
Active
$2,399,000
4
bds
|
0
ba
|
4,436
sqft
|
built
2021
3645 SW 3rd St, Miami, FL 33135
$-11,259
Cash flow
-24.5%
Cash-on-Cash Return
0.7%
Cap rate
0.2%
Rent to Value Ratio
Active
$299,900
1
bds
|
1
ba
|
775
sqft
|
built
1983
650 NE 64th St, Miami, FL 33138
$-1,134
Cash flow
-19.7%
Cash-on-Cash Return
1.8%
Cap rate
0.8%
Rent to Value Ratio
Active
$635,000
3
bds
|
2
ba
|
1,435
sqft
|
built
1988
12548 SW 210th St, Miami, FL 33177
$-744
Cash flow
-6.1%
Cash-on-Cash Return
4.9%
Cap rate
0.6%
Rent to Value Ratio
Active
$790,000
3
bds
|
2
ba
|
1,990
sqft
|
built
1978
7211 SW 100th Ct, Miami, FL 33173
$-1,744
Cash flow
-11.5%
Cash-on-Cash Return
3.6%
Cap rate
0.5%
Rent to Value Ratio
Active
$215,000
1
bds
|
1
ba
|
709
sqft
|
built
1968
10816 SW 88th St, Miami, FL 33176
$-410
Cash flow
-9.9%
Cash-on-Cash Return
4.0%
Cap rate
0.9%
Rent to Value Ratio
Active
$1,300,000
3
bds
|
3
ba
|
1,281
sqft
|
built
2016
1300 S Miami Ave, Miami, FL 33130
$-5,121
Cash flow
-20.6%
Cash-on-Cash Return
1.6%
Cap rate
0.5%
Rent to Value Ratio
Active
$280,000
2
bds
|
2
ba
|
974
sqft
|
built
1982
9688 Fontainebleau Blvd, Miami, FL 33172
$-404
Cash flow
-7.5%
Cash-on-Cash Return
4.6%
Cap rate
0.9%
Rent to Value Ratio
Active
$297,000
1
bds
|
2
ba
|
1,125
sqft
|
built
1972
9367 Fontainebleau Blvd, Miami, FL 33172
$-843
Cash flow
-14.8%
Cash-on-Cash Return
2.9%
Cap rate
0.7%
Rent to Value Ratio
Active
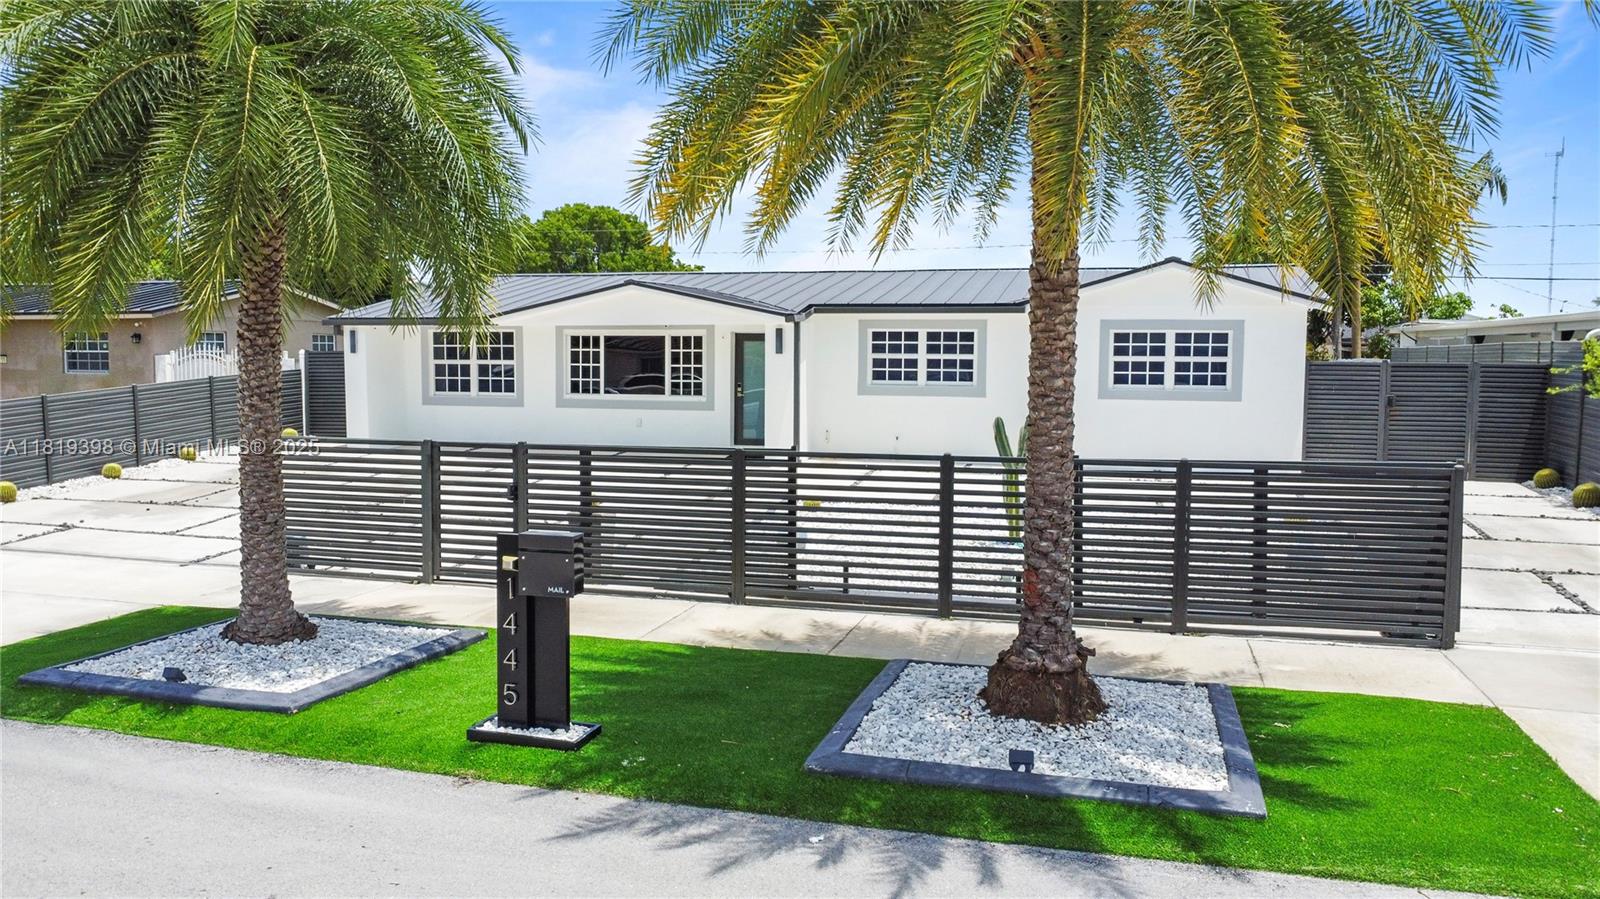
$624,900
3
bds
|
2
ba
|
1,350
sqft
|
built
1965
1445 NW 195th St, Miami, FL 33169
$-1,467
Cash flow
-12.2%
Cash-on-Cash Return
3.5%
Cap rate
0.5%
Rent to Value Ratio
Active
$2,150,000
3
bds
|
4
ba
|
1,634
sqft
|
built
2018
3131 NE 7th Ave, Miami, FL 33137
$-8,011
Cash flow
-19.4%
Cash-on-Cash Return
1.8%
Cap rate
0.5%
Rent to Value Ratio

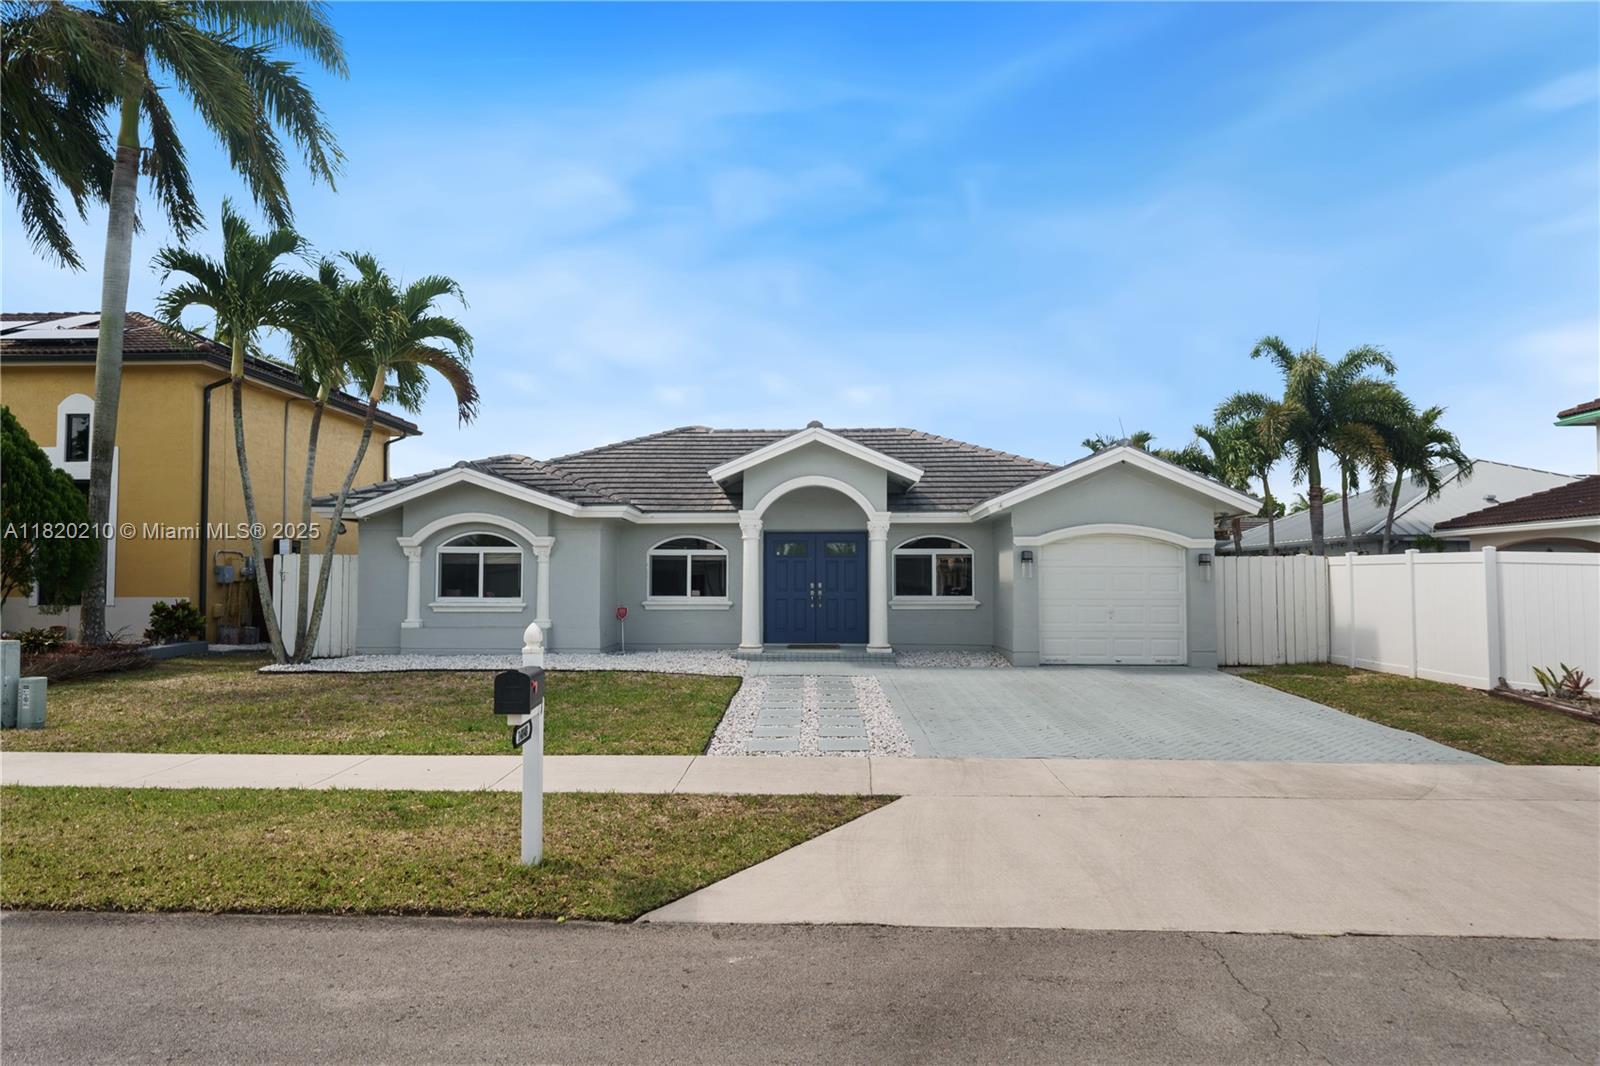
Active
$775,000
4
bds
|
3
ba
|
2,080
sqft
|
built
2004
16419 SW 84th St, Miami, FL 33193
$-1,735
Cash flow
-11.7%
Cash-on-Cash Return
3.6%
Cap rate
0.5%
Rent to Value Ratio

Active
$560,000
3
bds
|
3
ba
|
1,670
sqft
|
built
2007
12995 SW 133rd St, Miami, FL 33186
$-1,791
Cash flow
-16.7%
Cash-on-Cash Return
2.5%
Cap rate
0.5%
Rent to Value Ratio
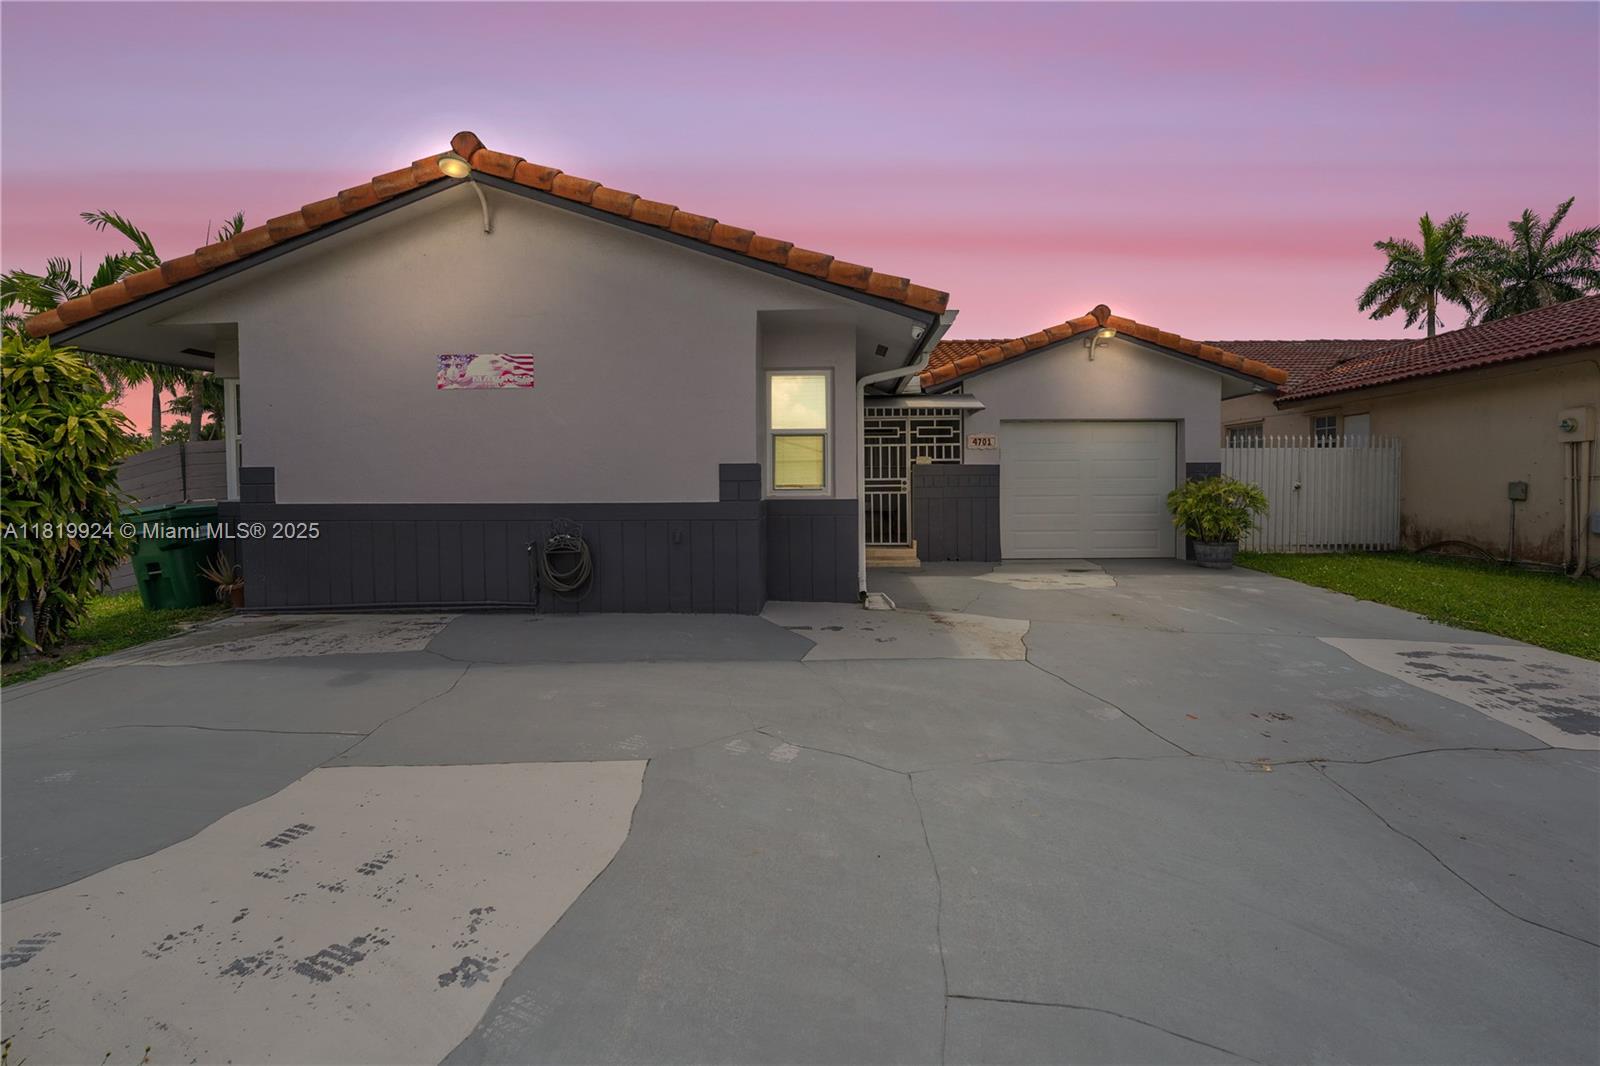
Active
$599,000
3
bds
|
2
ba
|
1,546
sqft
|
built
1989
4701 SW 142nd Ct, Miami, FL 33175
$-694
Cash flow
-6.0%
Cash-on-Cash Return
4.9%
Cap rate
0.7%
Rent to Value Ratio
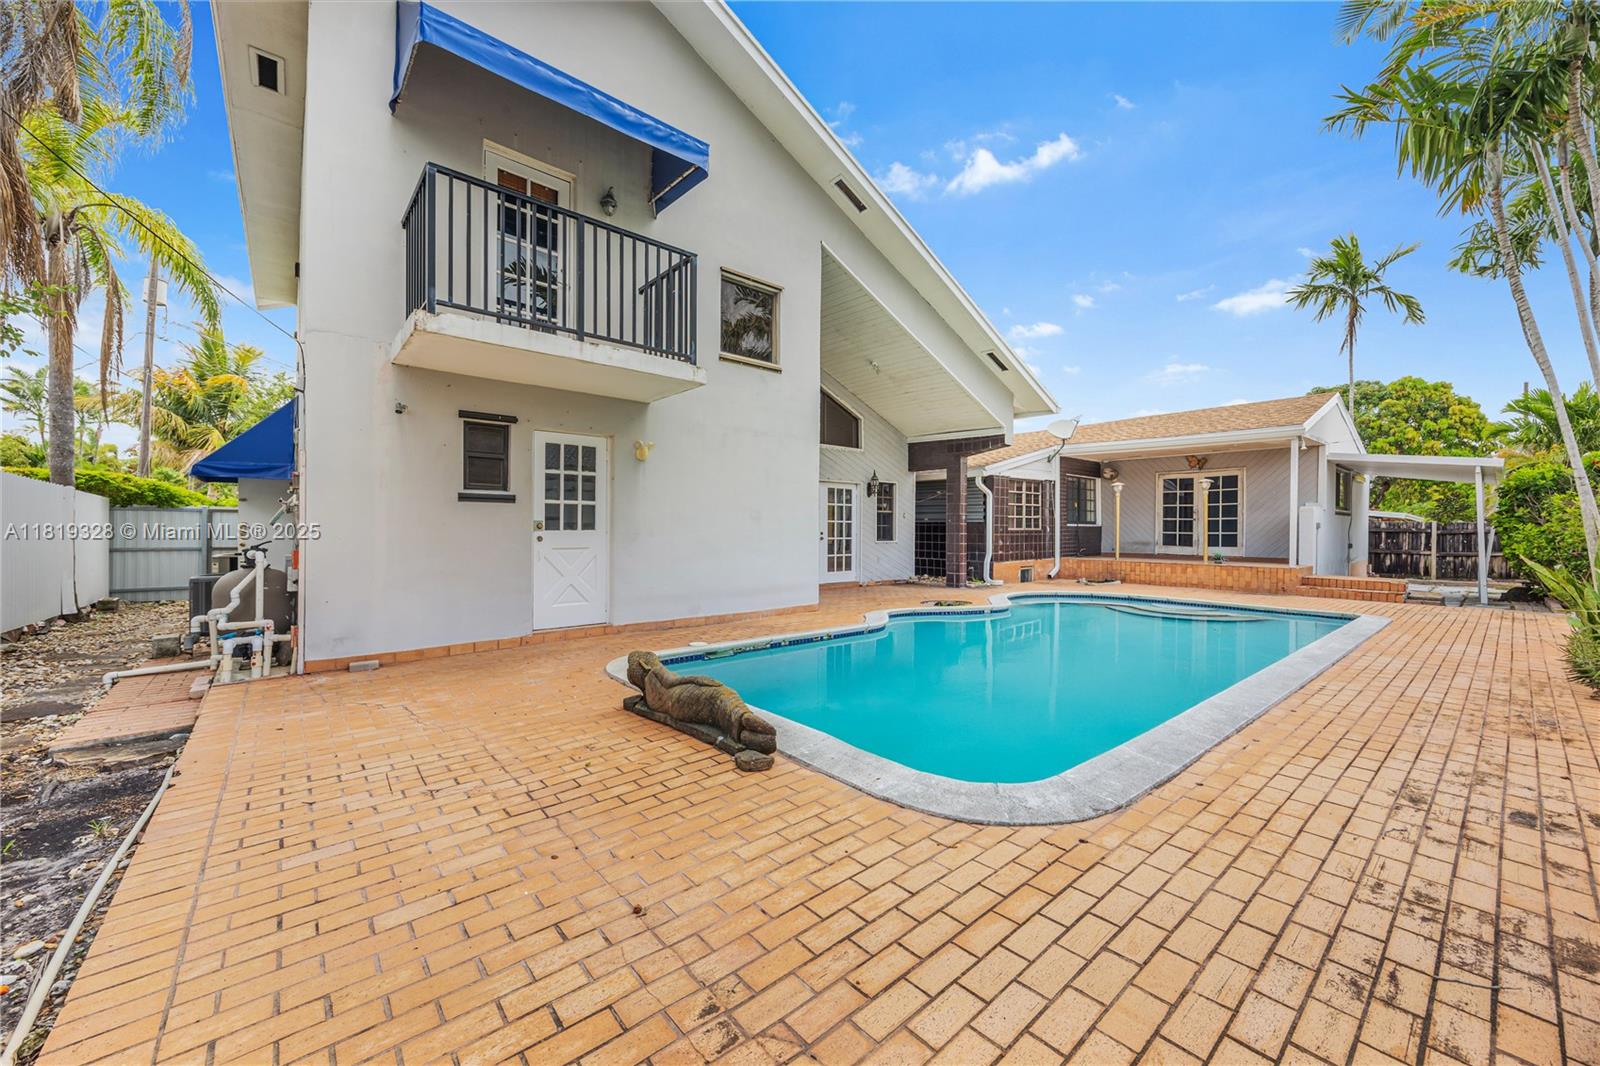
Active
$975,000
4
bds
|
3
ba
|
2,555
sqft
|
built
1947
8630 SW 47th Ter, Miami, FL 33155
$-2,438
Cash flow
-13.0%
Cash-on-Cash Return
3.3%
Cap rate
0.5%
Rent to Value Ratio
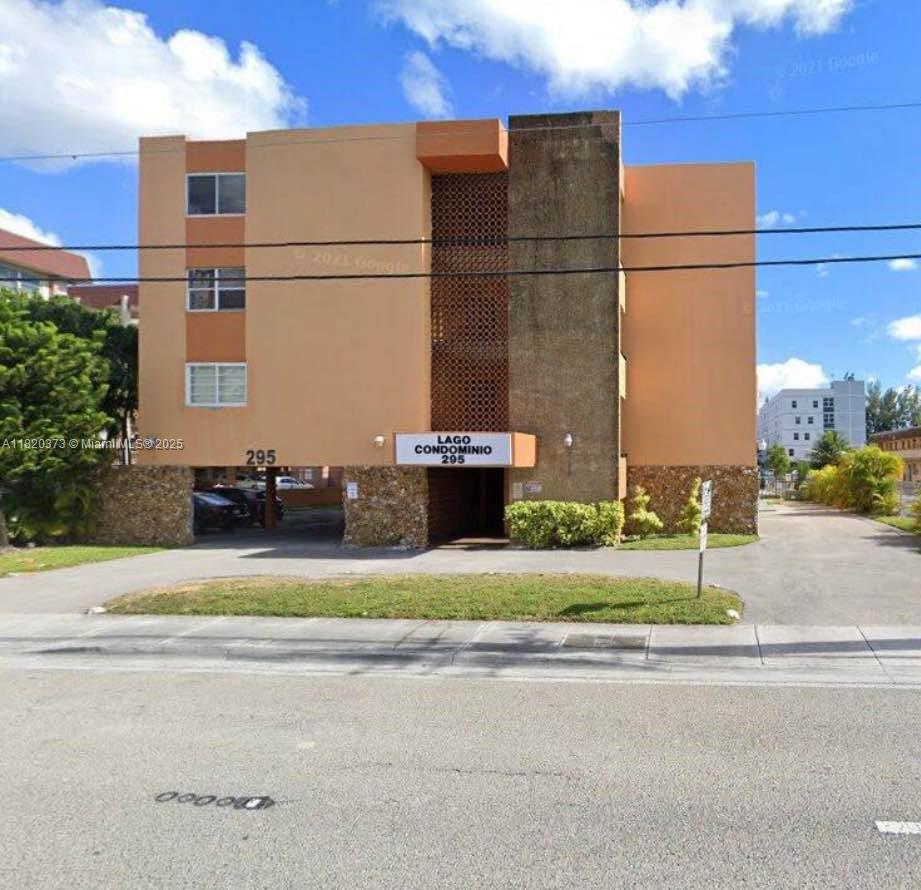
Active
$270,000
2
bds
|
1
ba
|
840
sqft
|
built
1973
295 NW 72nd Ave, Miami, FL 33126
$-461
Cash flow
-8.9%
Cash-on-Cash Return
4.2%
Cap rate
0.8%
Rent to Value Ratio
Active
$420,000
3
bds
|
3
ba
|
1,270
sqft
|
built
1995
17337 SW 140th Ct, Miami, FL 33177
$-867
Cash flow
-10.8%
Cash-on-Cash Return
3.8%
Cap rate
0.7%
Rent to Value Ratio