Miami, FL Investment Properties for Sale
Browse homes for sale and investment properties in Miami, FL. Refine your search by price, property type, or more.
Best cash flowing properties in Miami, FL
Active
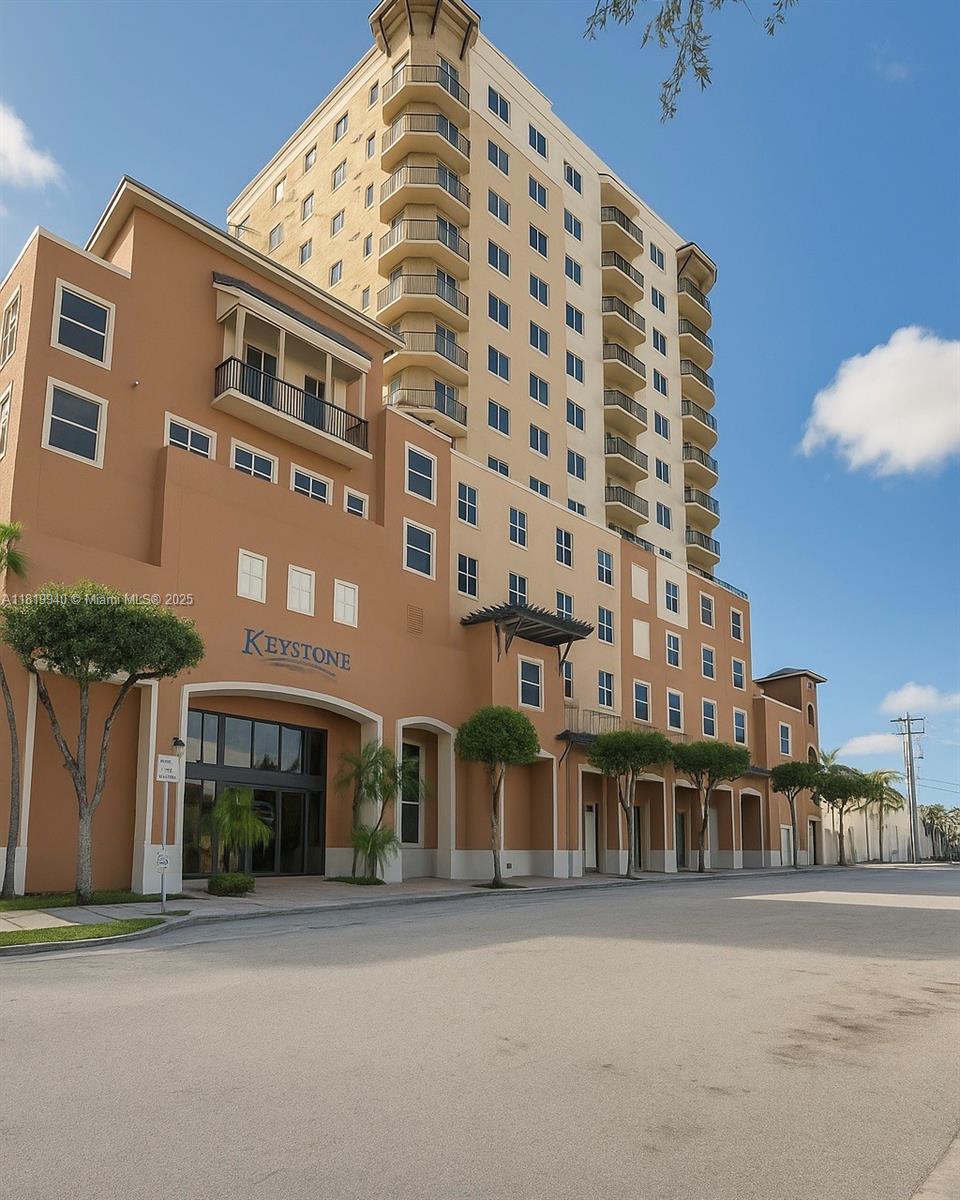
$25,000
2
bds
|
0
ba
|
0
sqft
|
built
2008
90 SW 3rd St, Miami, FL 33130
$1,674
Cash flow
78.0%
Cash-on-Cash Return
80.4%
Cap rate
16.4%
Rent to Value Ratio
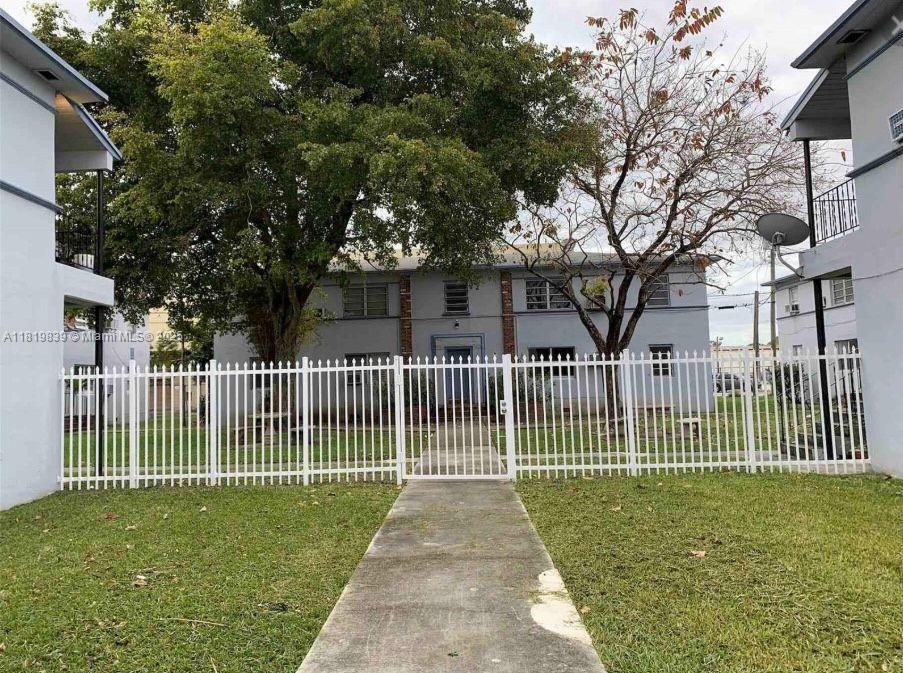
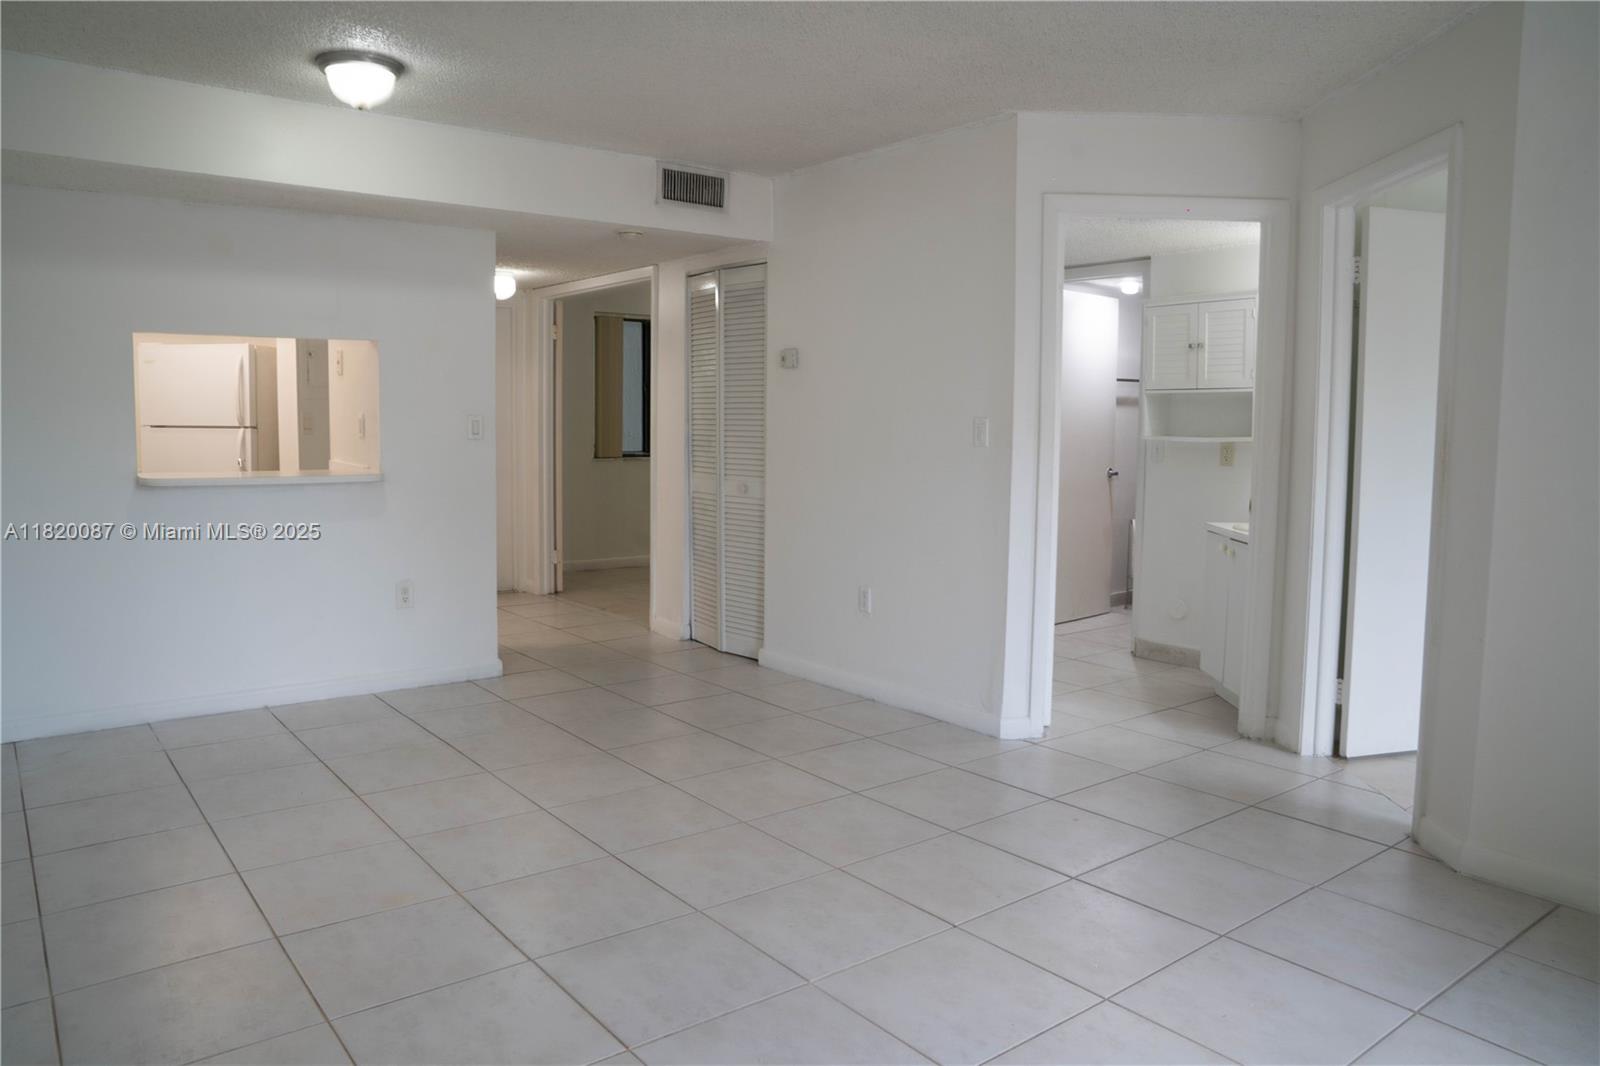
Active
$190,000
2
bds
|
1
ba
|
855
sqft
|
built
1945
424 NE 82nd St, Miami, FL 33138
$-71
Cash flow
-1.9%
Cash-on-Cash Return
5.8%
Cap rate
1.2%
Rent to Value Ratio
6,349 out of 7,208 properties for sale in Miami, FL
Limited Results Shown
Create a free account, or log in to reveal all property listings and enjoy the complete experience.
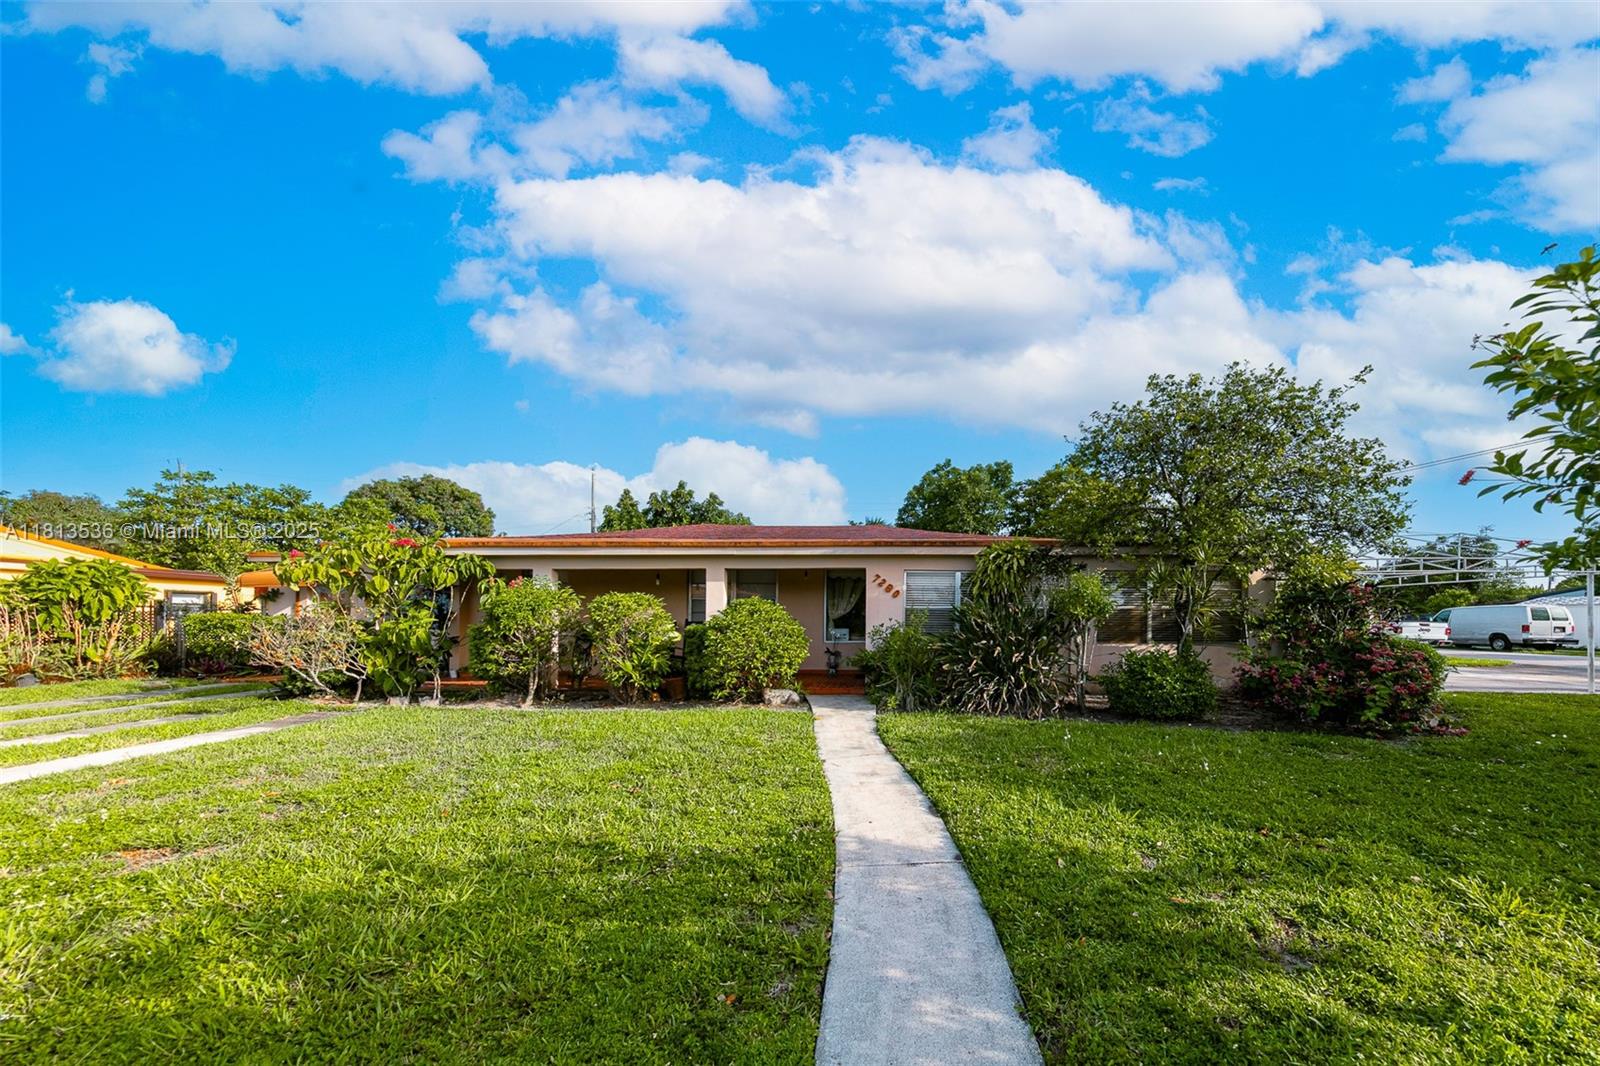
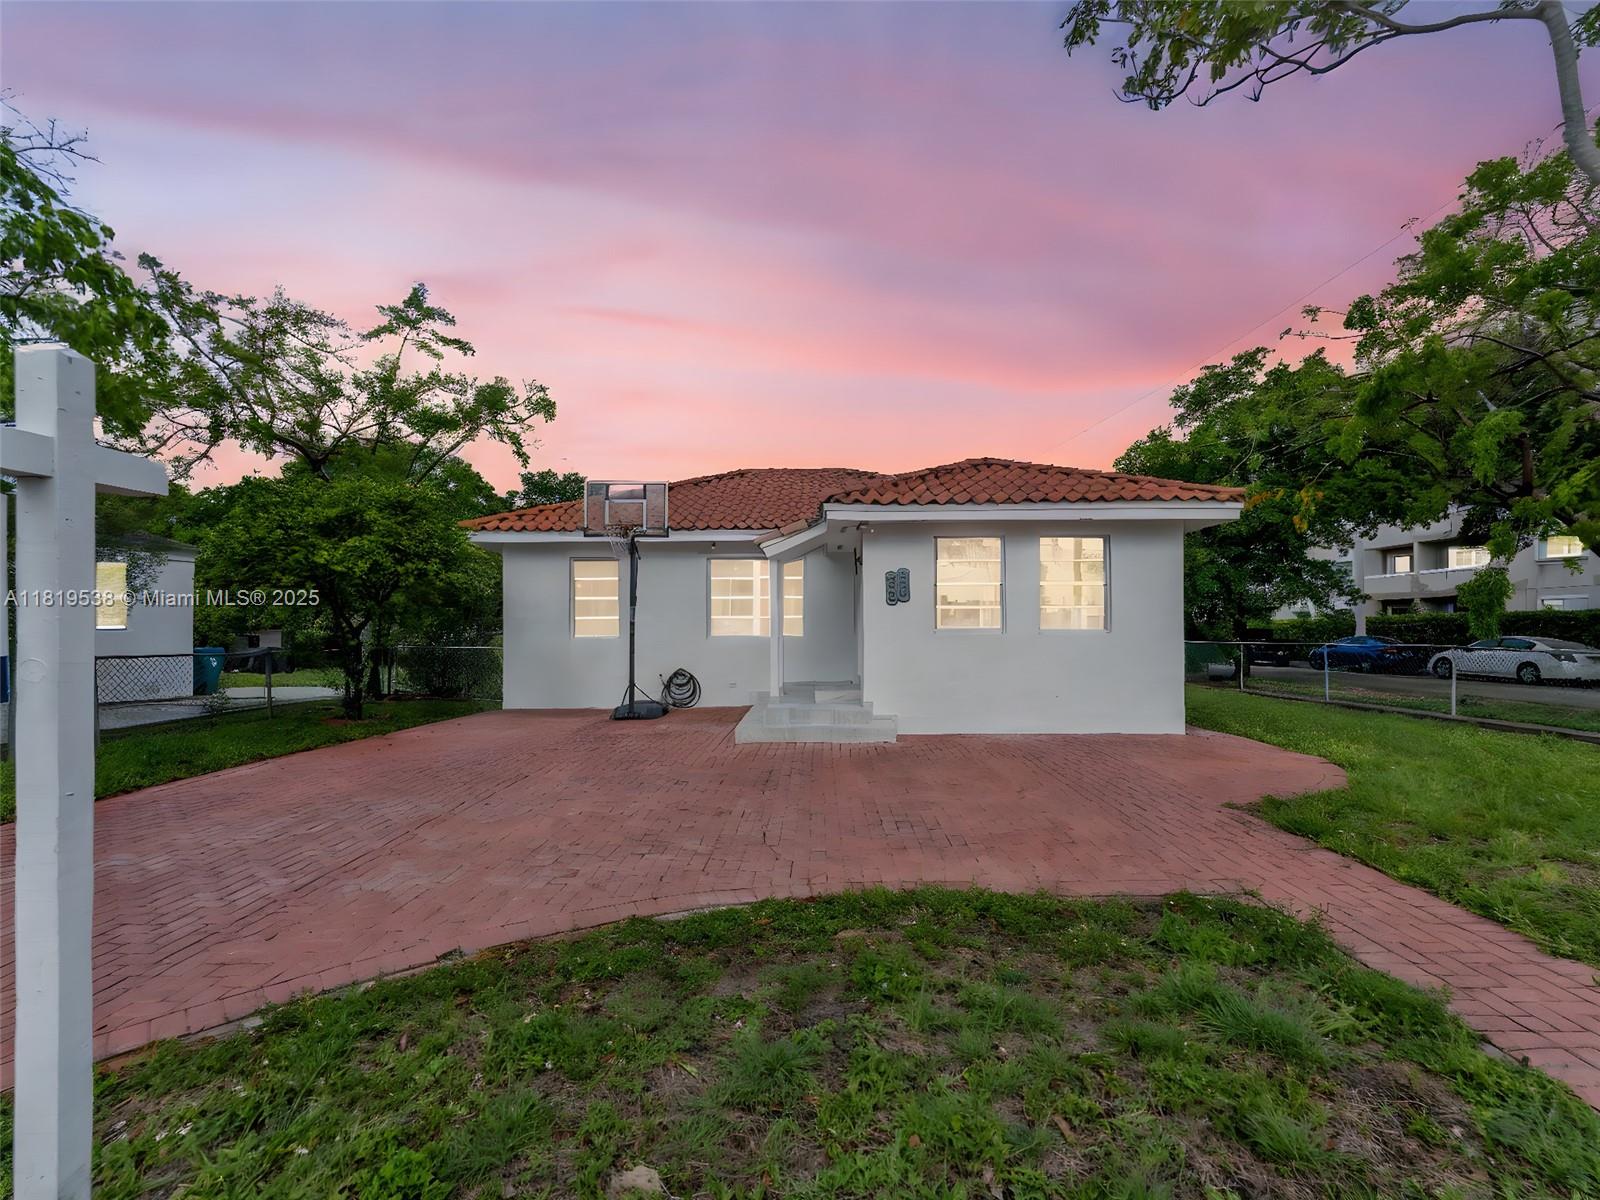
Active
$825,000
3
bds
|
3
ba
|
2,823
sqft
|
built
1949
7280 SW 9th St, Miami, FL 33144
$-1,722
Cash flow
-10.9%
Cash-on-Cash Return
3.8%
Cap rate
0.5%
Rent to Value Ratio
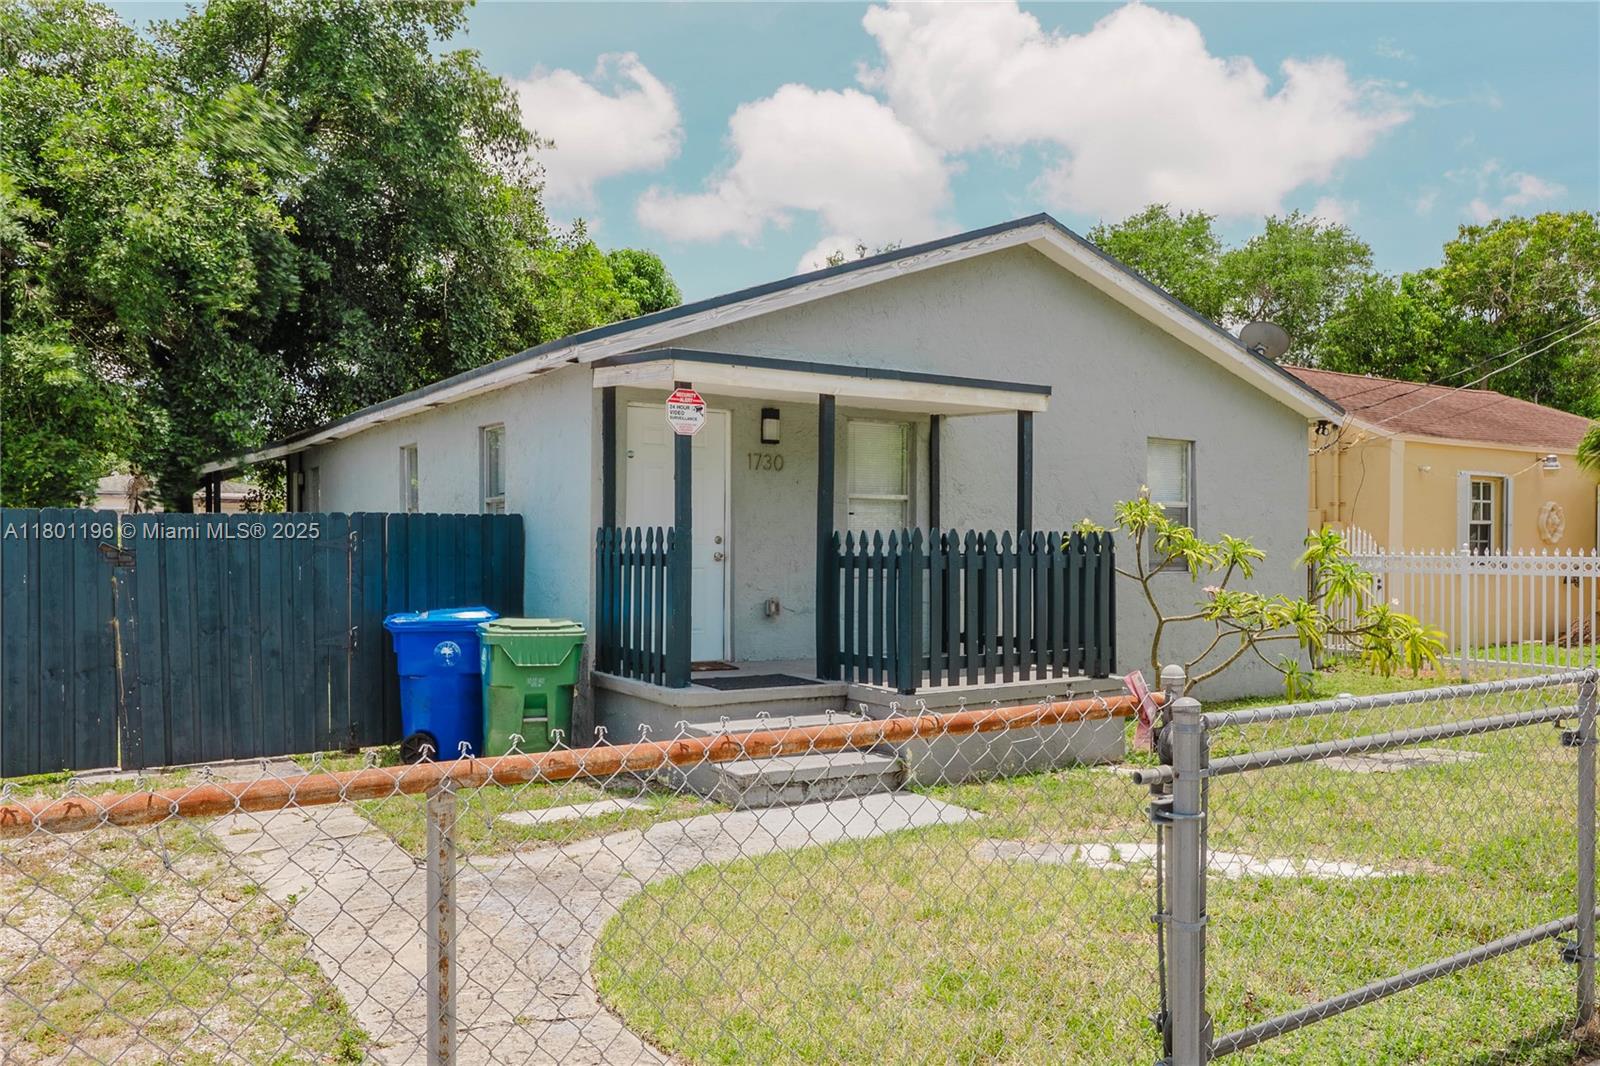
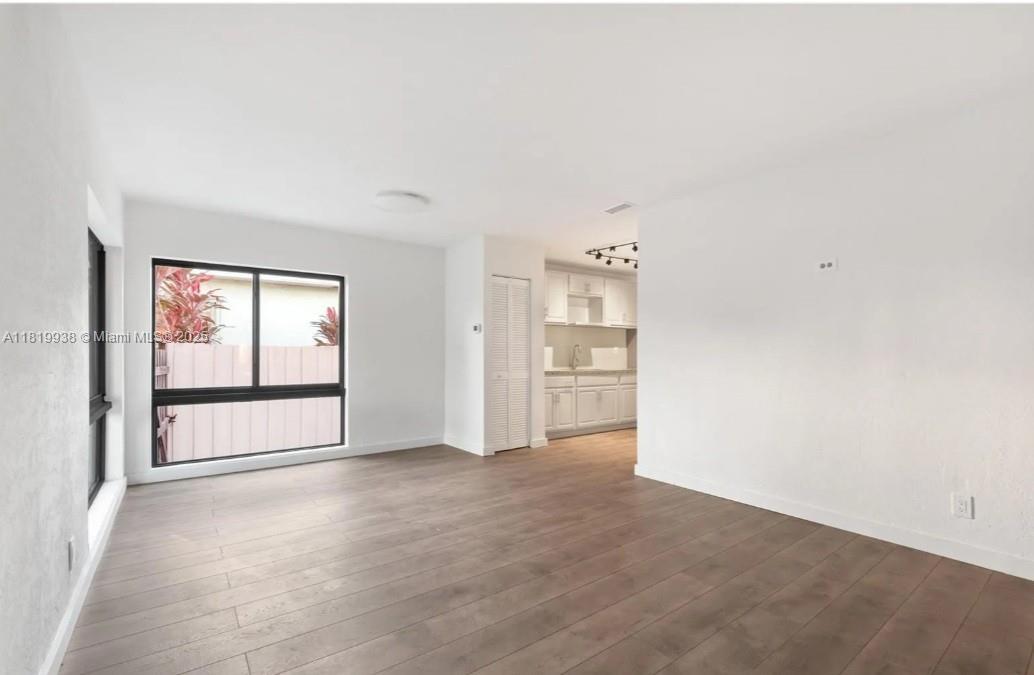
Active
$460,000
3
bds
|
2
ba
|
1,120
sqft
|
built
1946
1730 NW 58th St, Miami, FL 33142
$-852
Cash flow
-9.7%
Cash-on-Cash Return
4.1%
Cap rate
0.6%
Rent to Value Ratio
Active
$875,000
3
bds
|
2
ba
|
1,400
sqft
|
built
1963
11150 SW 64th St, Miami, FL 33173
$-2,233
Cash flow
-13.3%
Cash-on-Cash Return
3.2%
Cap rate
0.4%
Rent to Value Ratio
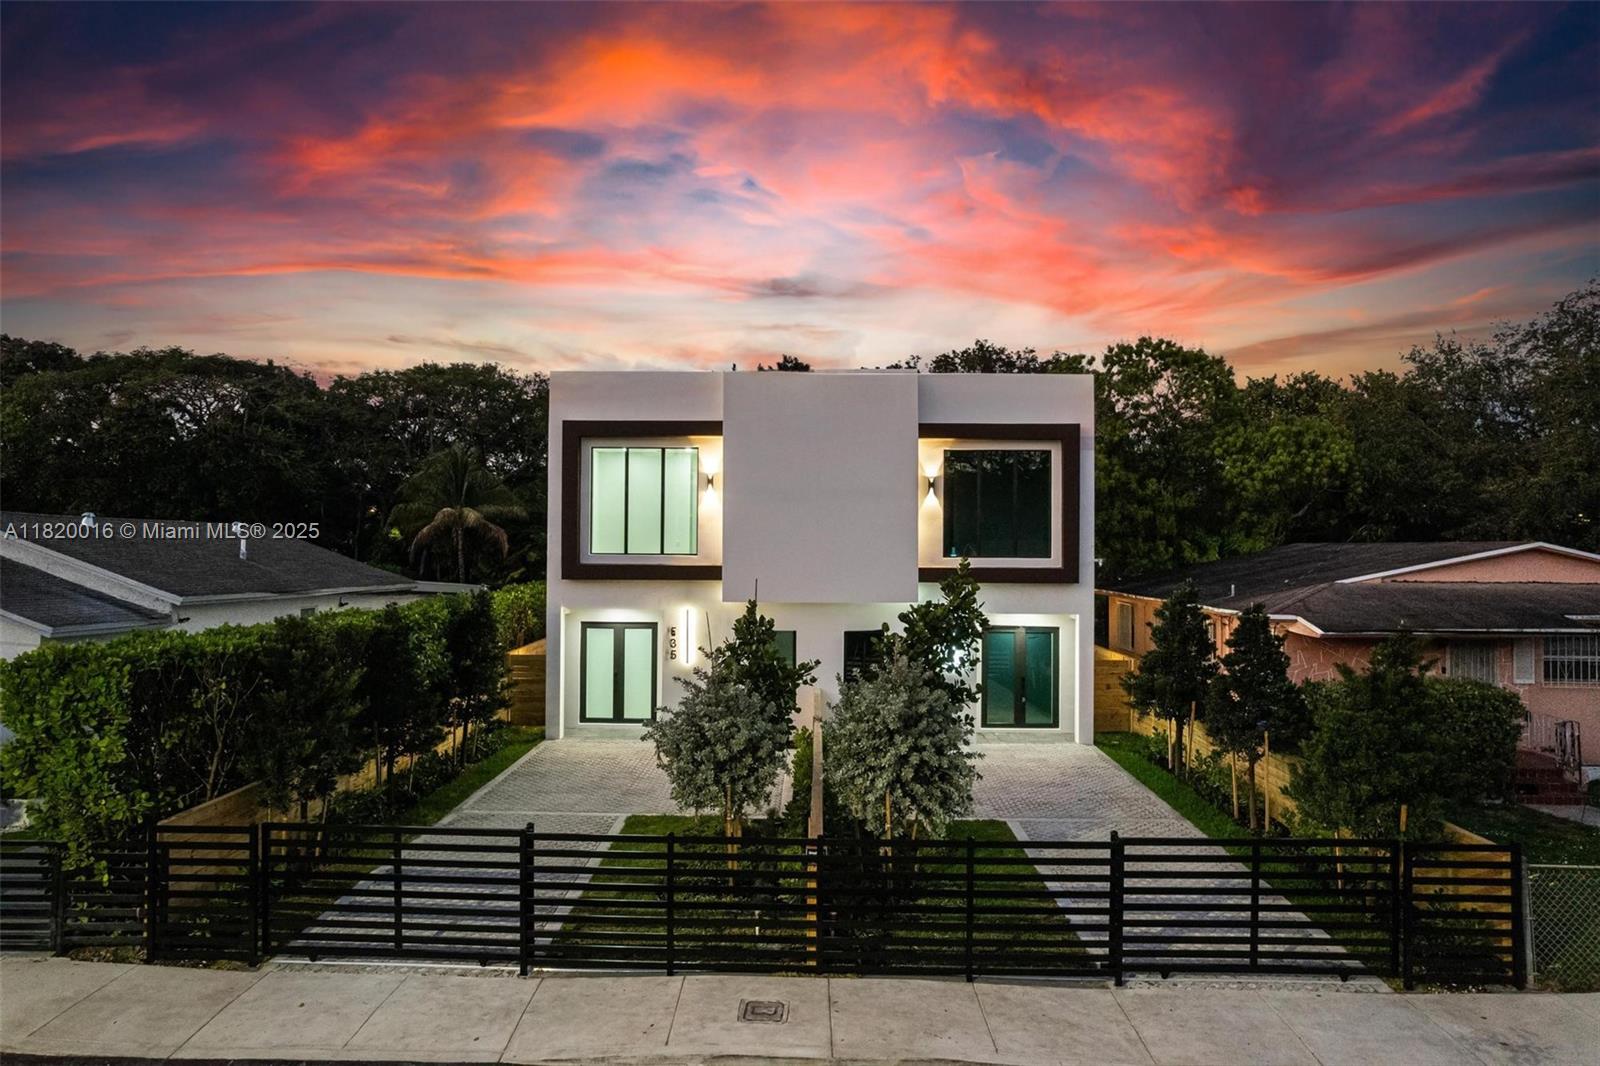
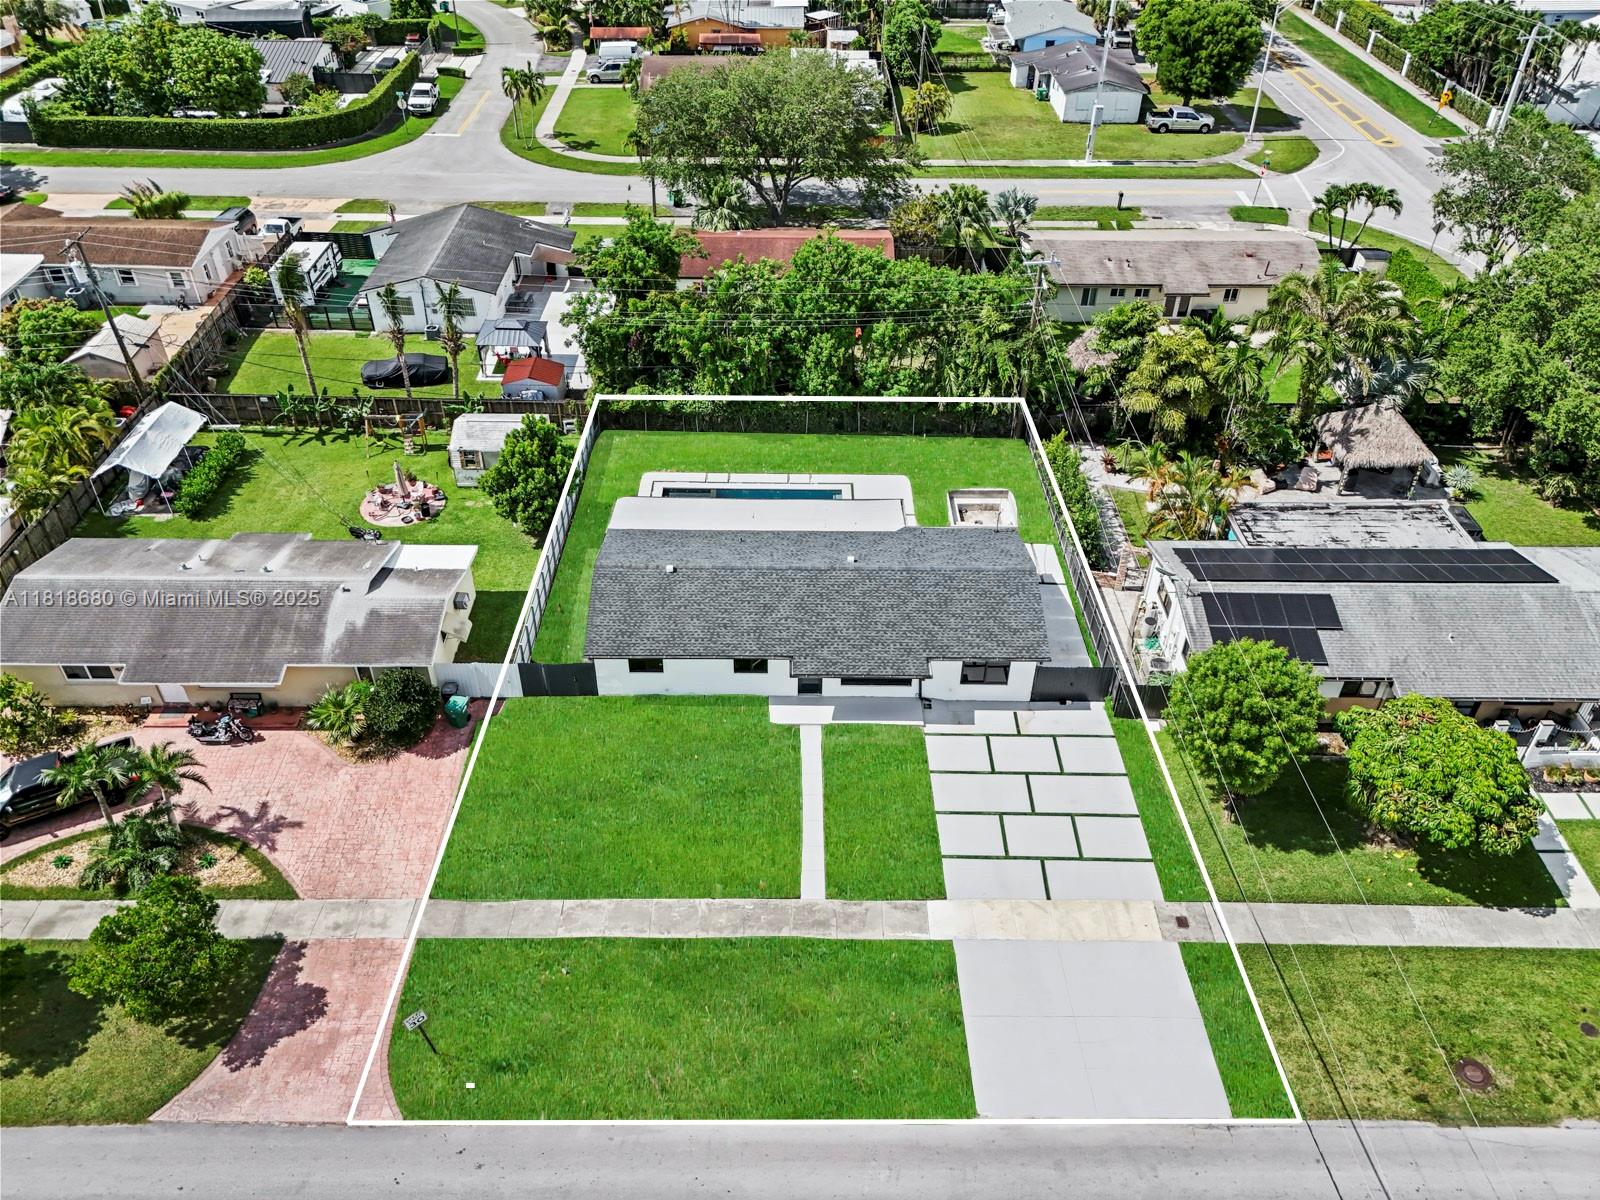
Active
$1,239,000
4
bds
|
3
ba
|
0
sqft
|
built
2025
535 NW 52nd St, Miami, FL 33127
$-1,013
Cash flow
-4.3%
Cash-on-Cash Return
5.3%
Cap rate
0.7%
Rent to Value Ratio
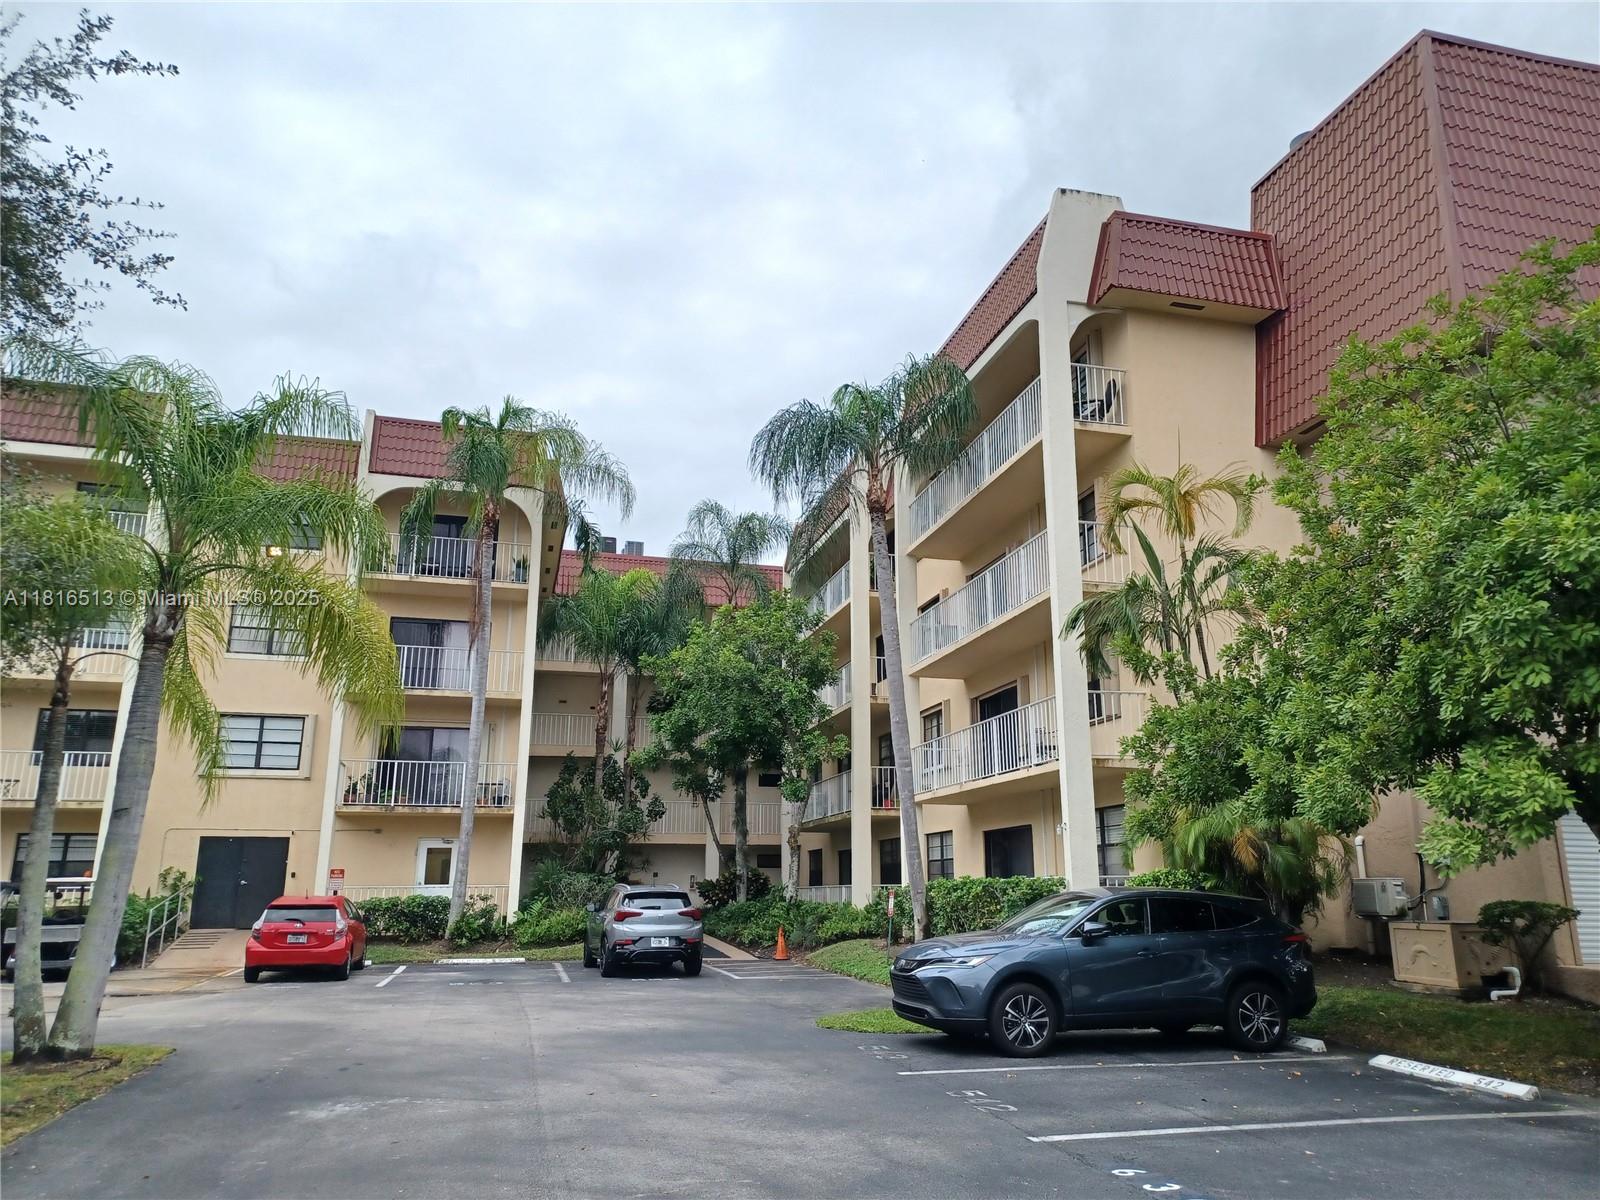
Active
$330,000
2
bds
|
2
ba
|
968
sqft
|
built
1977
9301 SW 92nd Ave, Miami, FL 33176
$-1,155
Cash flow
-18.3%
Cash-on-Cash Return
2.1%
Cap rate
0.8%
Rent to Value Ratio
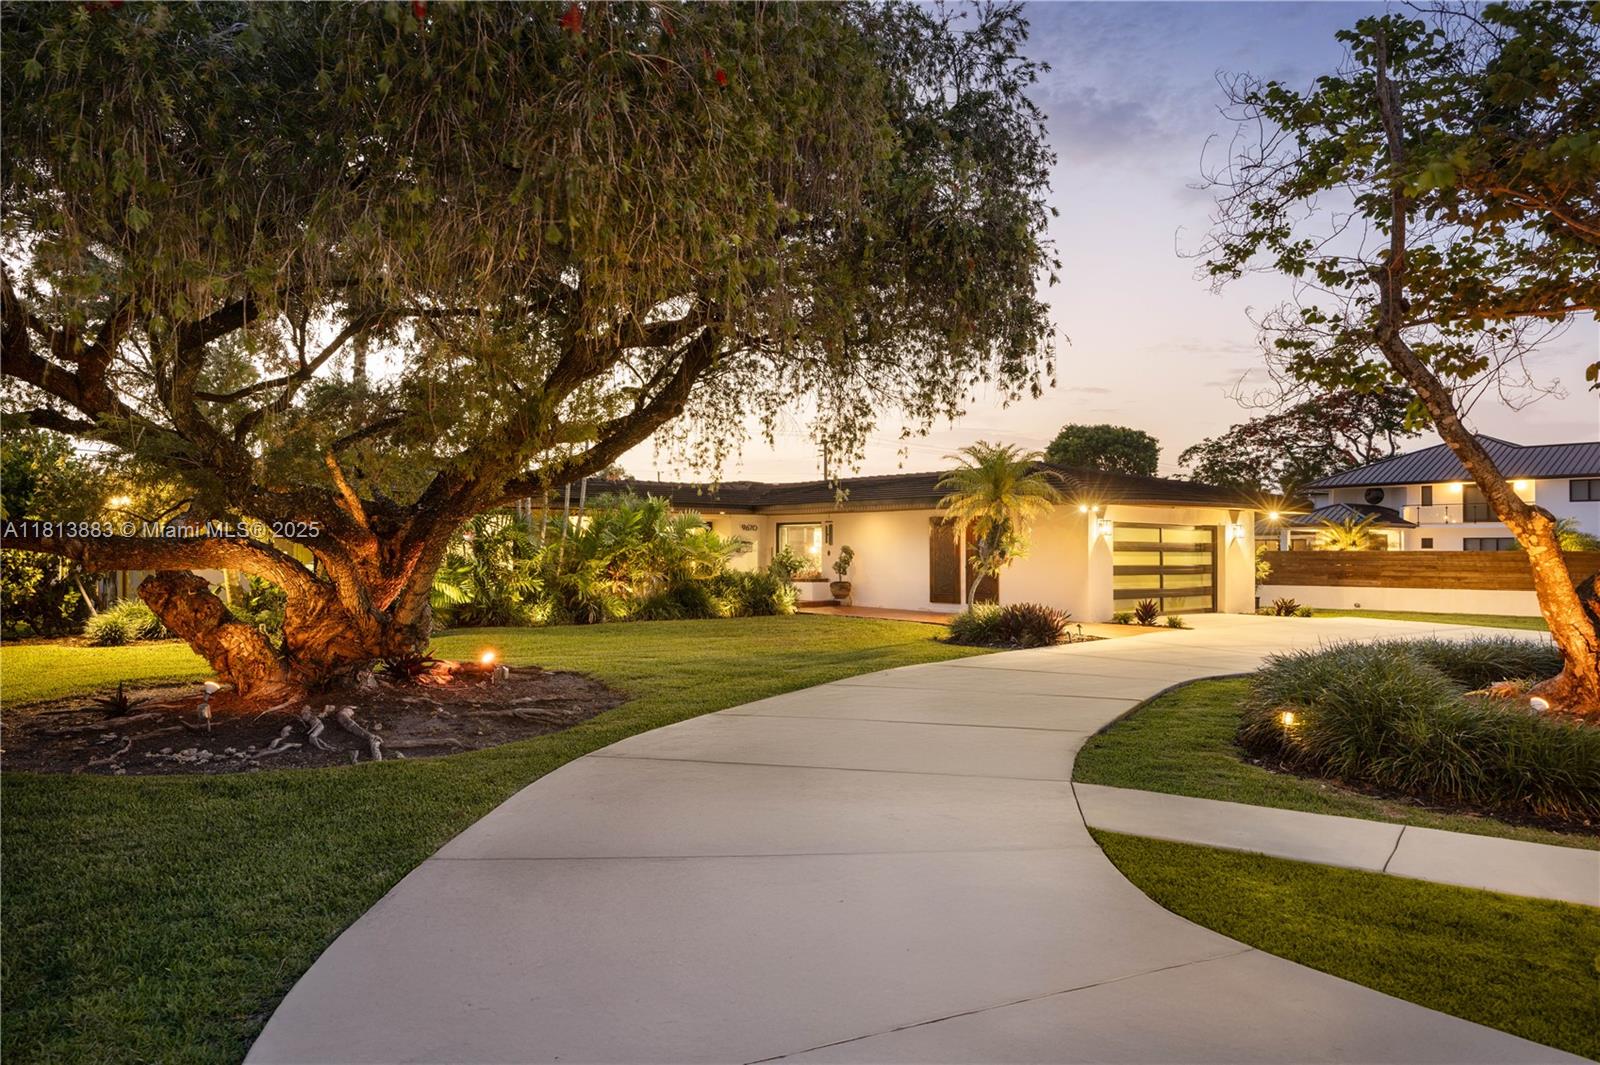
Active
$2,750,000
4
bds
|
3
ba
|
3,542
sqft
|
built
1969
9670 SW 96th Ct, Miami, FL 33176
$-11,213
Cash flow
-21.3%
Cash-on-Cash Return
1.4%
Cap rate
0.3%
Rent to Value Ratio
Active
$760,000
4
bds
|
3
ba
|
2,009
sqft
|
built
1950
5435 SW 99th Ct, Miami, FL 33165
$-1,518
Cash flow
-10.4%
Cash-on-Cash Return
3.9%
Cap rate
0.5%
Rent to Value Ratio
Active
$575,000
1
bds
|
2
ba
|
780
sqft
|
built
1995
888 Brickell Key Dr, Miami, FL 33131
$-2,401
Cash flow
-21.8%
Cash-on-Cash Return
1.3%
Cap rate
0.6%
Rent to Value Ratio
Active
$605,000
bds
|
1
ba
|
626
sqft
|
built
2018
801 S Miami Ave, Miami, FL 33130
$-3,689
Cash flow
-31.8%
Cash-on-Cash Return
-1.0%
Cap rate
0.5%
Rent to Value Ratio
Active
$985,000
3
bds
|
3
ba
|
2,374
sqft
|
built
1959
4940 SW 90th Ct, Miami, FL 33165
$-2,445
Cash flow
-13.0%
Cash-on-Cash Return
3.3%
Cap rate
0.4%
Rent to Value Ratio
Active
$335,000
1
bds
|
1
ba
|
742
sqft
|
built
2006
4242 NW 2nd St, Miami, FL 33126
$-901
Cash flow
-14.0%
Cash-on-Cash Return
3.1%
Cap rate
0.7%
Rent to Value Ratio
Active
$235,000
2
bds
|
1
ba
|
828
sqft
|
built
1984
8365 SW 152nd Ave, Miami, FL 33193
$-516
Cash flow
-11.5%
Cash-on-Cash Return
3.7%
Cap rate
0.9%
Rent to Value Ratio
Active
$1,200,000
5
bds
|
0
ba
|
2,646
sqft
|
built
1944
520 NW 32nd Pl, Miami, FL 33125
$-5,484
Cash flow
-23.8%
Cash-on-Cash Return
0.8%
Cap rate
0.2%
Rent to Value Ratio
Active
$550,000
3
bds
|
2
ba
|
1,048
sqft
|
built
1950
5901 SW 6th St, Miami, FL 33144
$-646
Cash flow
-6.1%
Cash-on-Cash Return
4.9%
Cap rate
0.7%
Rent to Value Ratio
Active
$2,100,000
4
bds
|
3
ba
|
1,989
sqft
|
built
1936
659 NE 73rd St, Miami, FL 33138
$-7,591
Cash flow
-18.9%
Cash-on-Cash Return
2.0%
Cap rate
0.5%
Rent to Value Ratio
Active
$7,500,000
4
bds
|
5
ba
|
4,600
sqft
|
built
2019
1000 Biscayne Blvd, Miami, FL 33132
$-50,649
Cash flow
-35.2%
Cash-on-Cash Return
-1.8%
Cap rate
0.1%
Rent to Value Ratio
Active
$25,000
2
bds
|
0
ba
|
0
sqft
|
built
2008
90 SW 3rd St, Miami, FL 33130
$1,674
Cash flow
78.0%
Cash-on-Cash Return
80.4%
Cap rate
16.4%
Rent to Value Ratio
Active
$2,650,000
5
bds
|
4
ba
|
3,142
sqft
|
built
1961
7570 SW 60th St, Miami, FL 33143
$-9,439
Cash flow
-18.6%
Cash-on-Cash Return
2.0%
Cap rate
0.3%
Rent to Value Ratio
Active
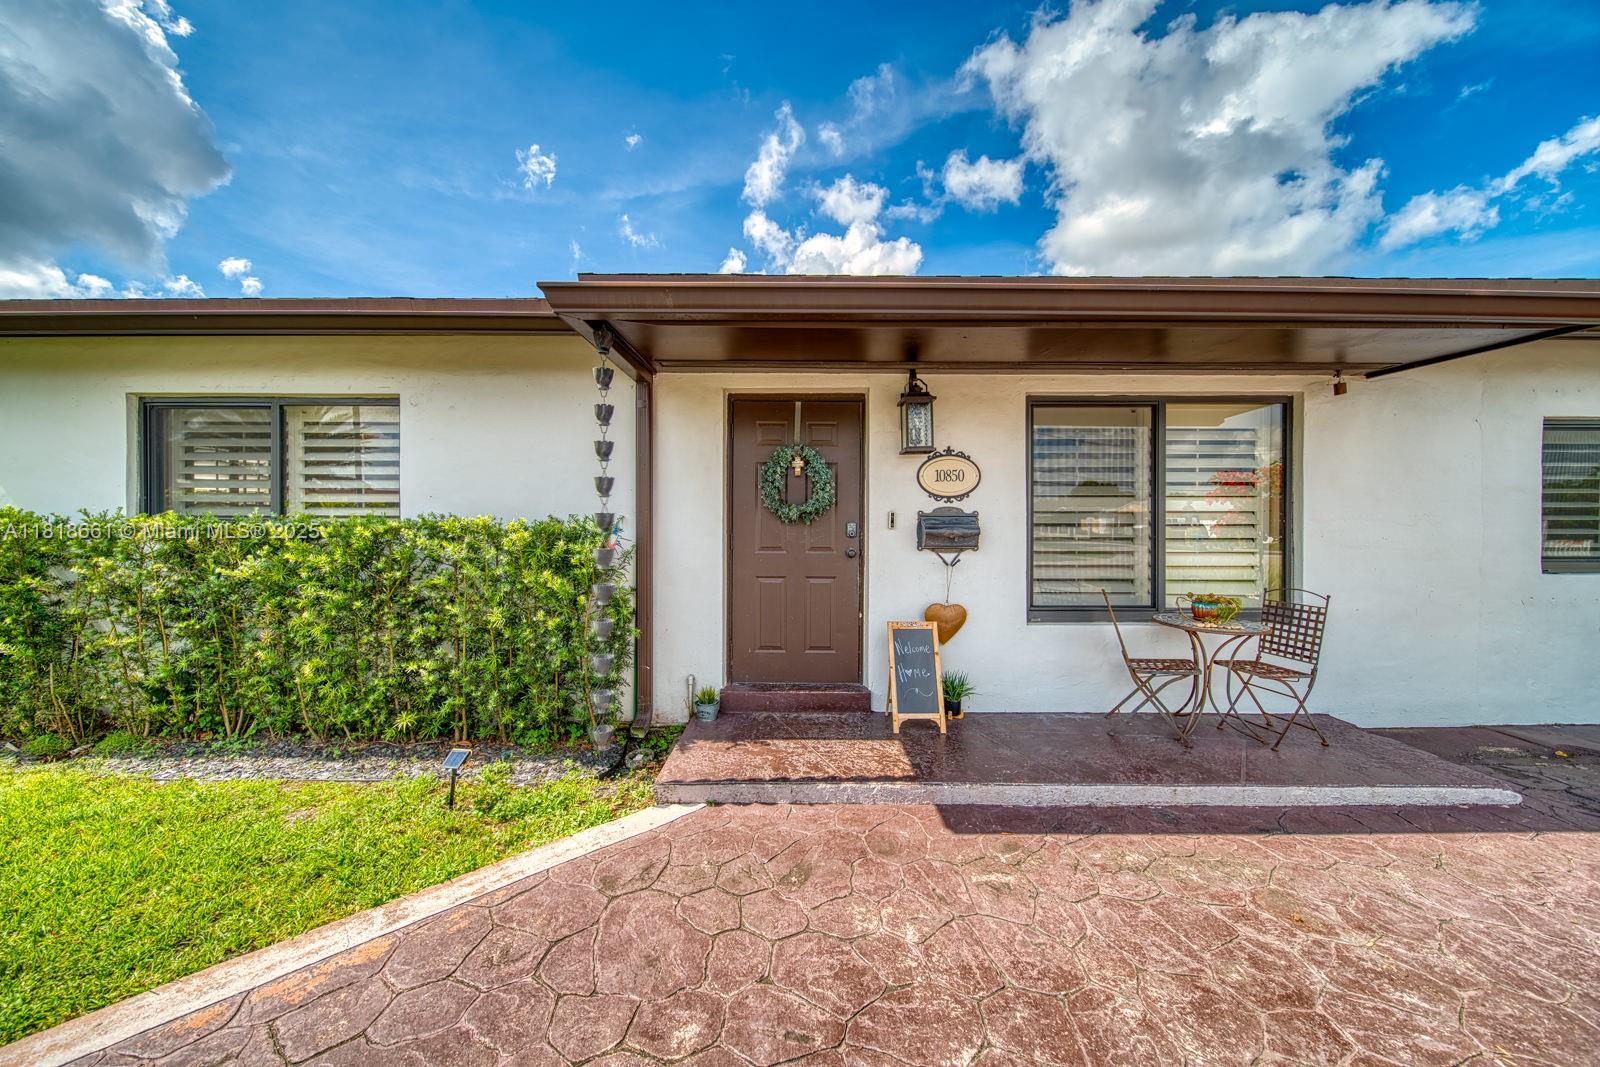
$780,000
3
bds
|
2
ba
|
1,800
sqft
|
built
1965
10850 SW 61st St, Miami, FL 33173
$-2,035
Cash flow
-13.6%
Cash-on-Cash Return
3.2%
Cap rate
0.5%
Rent to Value Ratio
Active
$1,199,999
5
bds
|
4
ba
|
2,916
sqft
|
built
2002
16262 SW 44th Ter, Miami, FL 33185
$-3,488
Cash flow
-15.2%
Cash-on-Cash Return
2.8%
Cap rate
0.4%
Rent to Value Ratio
Active
$995,000
2
bds
|
0
ba
|
1,472
sqft
|
built
1956
3121 SW 25th Ter, Miami, FL 33133
$-4,481
Cash flow
-23.5%
Cash-on-Cash Return
0.9%
Cap rate
0.3%
Rent to Value Ratio
Active
$775,000
4
bds
|
2
ba
|
1,362
sqft
|
built
1976
12900 SW 85th St, Miami, FL 33183
$-1,885
Cash flow
-12.7%
Cash-on-Cash Return
3.4%
Cap rate
0.5%
Rent to Value Ratio
Active
$450,000
2
bds
|
2
ba
|
1,028
sqft
|
built
1980
5022 SW 139th Pl, Miami, FL 33175
$-677
Cash flow
-7.8%
Cash-on-Cash Return
4.5%
Cap rate
0.6%
Rent to Value Ratio
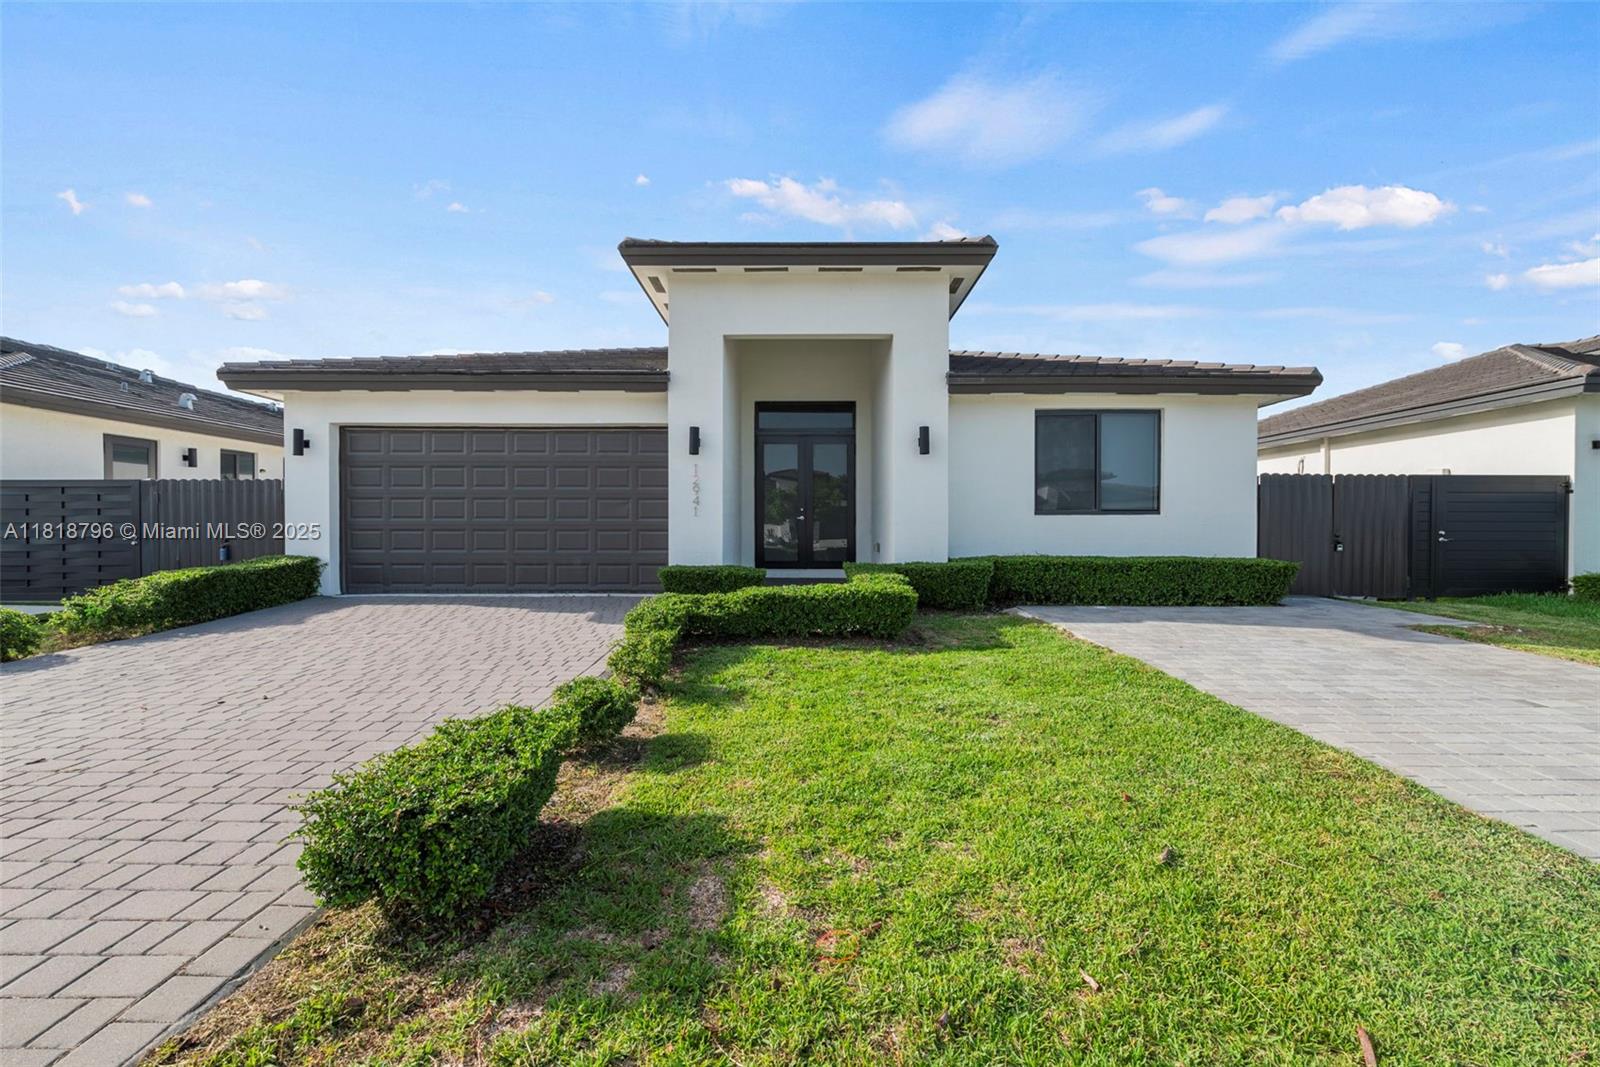
Active
$730,000
4
bds
|
3
ba
|
2,066
sqft
|
built
2023
12941 SW 227th St, Miami, FL 33170
$-1,541
Cash flow
-11.0%
Cash-on-Cash Return
3.8%
Cap rate
0.6%
Rent to Value Ratio

Active
$2,875,000
4
bds
|
5
ba
|
3,621
sqft
|
built
1980
10304 SW 87th Ct, Miami, FL 33176
$-9,874
Cash flow
-17.9%
Cash-on-Cash Return
2.2%
Cap rate
0.3%
Rent to Value Ratio
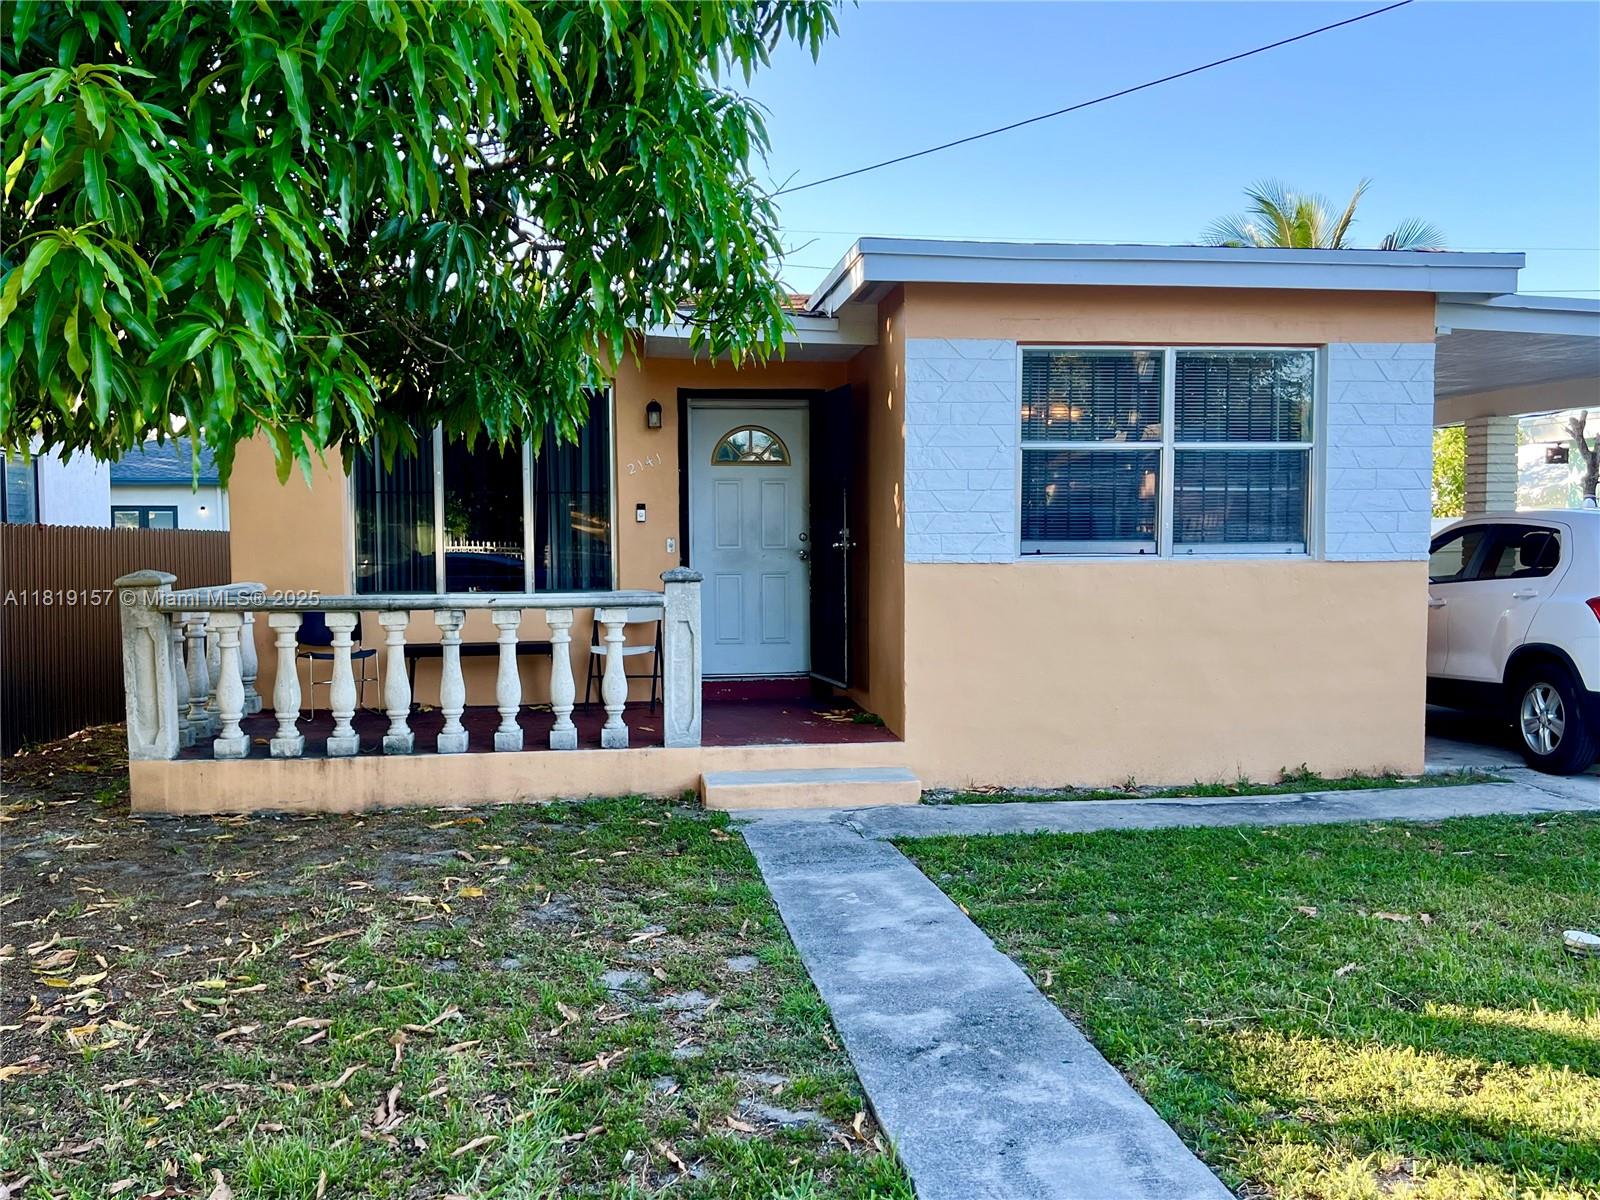
Active
$398,000
3
bds
|
2
ba
|
1,202
sqft
|
built
1956
2141 NW 57th St, Miami, FL 33142
$-293
Cash flow
-3.8%
Cash-on-Cash Return
5.4%
Cap rate
0.8%
Rent to Value Ratio
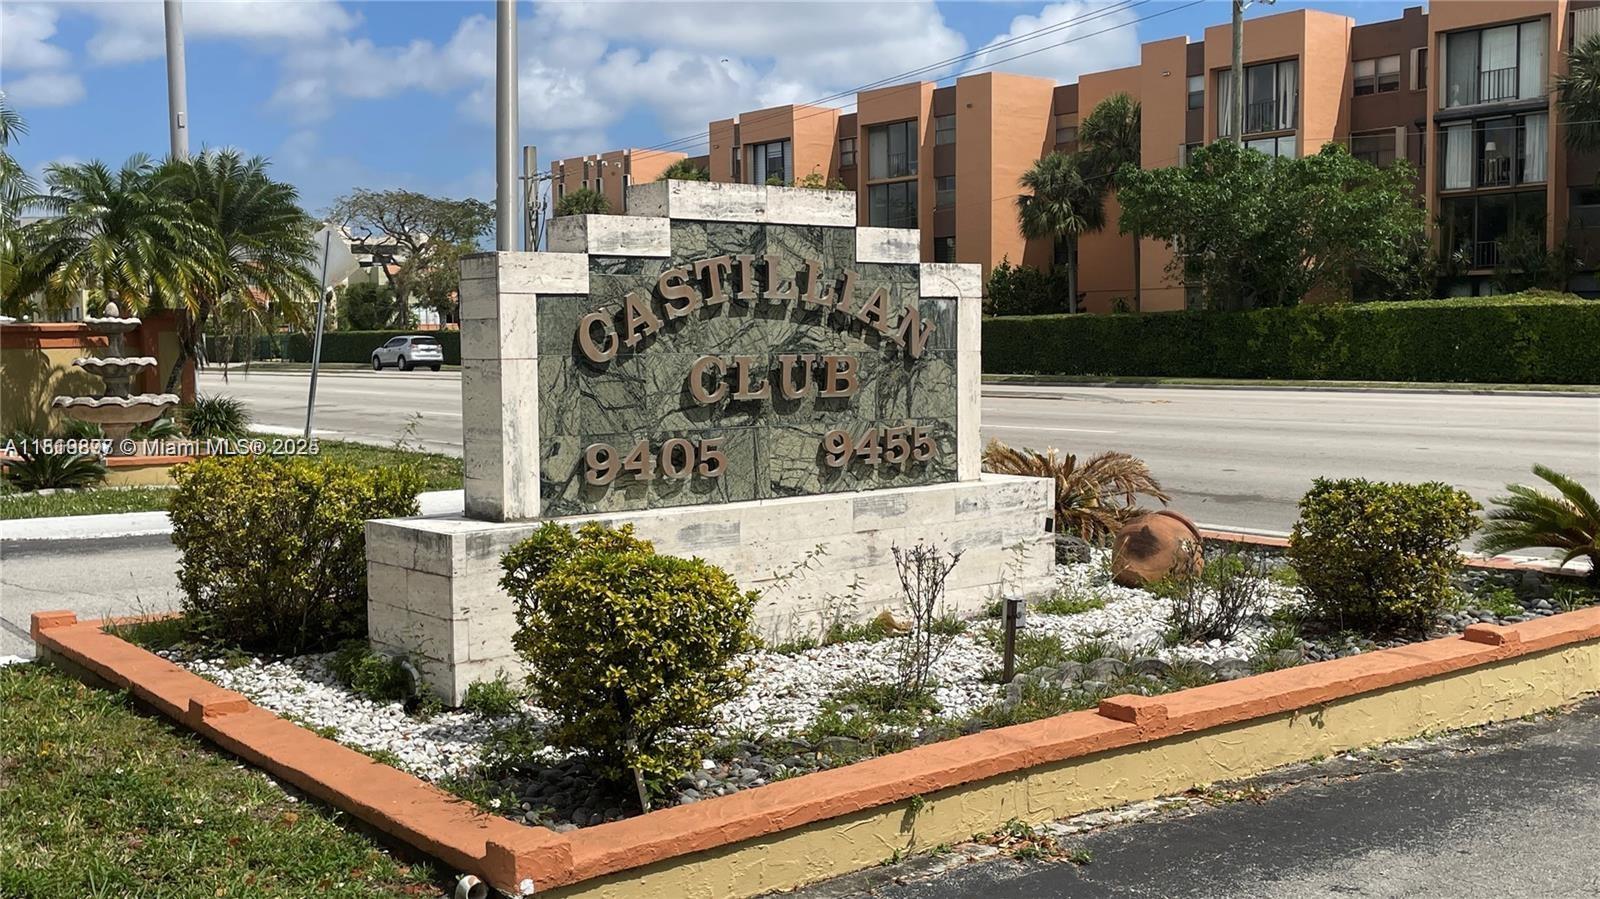
Active
$230,000
1
bds
|
1
ba
|
667
sqft
|
built
1973
9455 W Flagler St, Miami, FL 33174
$-365
Cash flow
-8.3%
Cash-on-Cash Return
4.4%
Cap rate
0.9%
Rent to Value Ratio
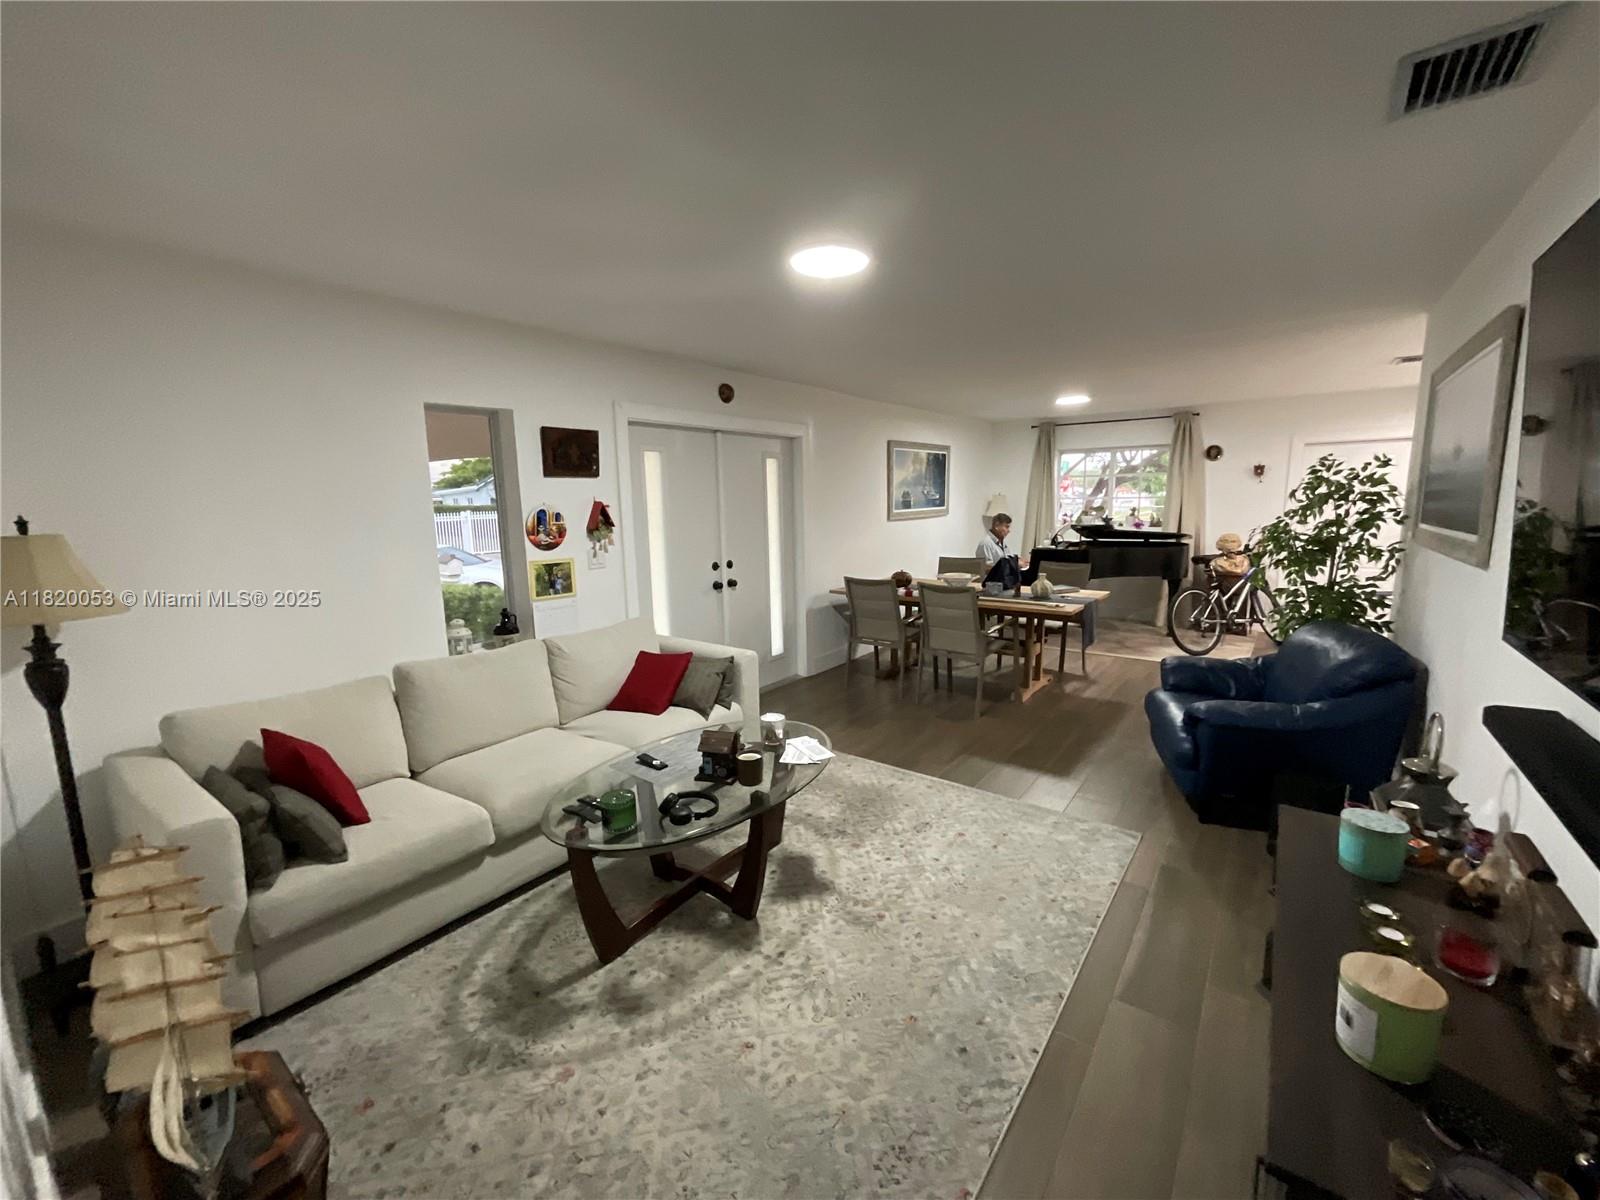
Active
$840,000
4
bds
|
3
ba
|
1,751
sqft
|
built
1961
3551 SW 121st Ave, Miami, FL 33175
$-2,105
Cash flow
-13.1%
Cash-on-Cash Return
3.3%
Cap rate
0.5%
Rent to Value Ratio
Active
$275,000
2
bds
|
2
ba
|
1,099
sqft
|
built
1977
8511 NW 8th St, Miami, FL 33126
$-608
Cash flow
-11.5%
Cash-on-Cash Return
3.6%
Cap rate
0.8%
Rent to Value Ratio
Active
$520,000
2
bds
|
2
ba
|
1,023
sqft
|
built
2004
1250 S Miami Ave, Miami, FL 33130
$-2,320
Cash flow
-23.3%
Cash-on-Cash Return
0.9%
Cap rate
0.6%
Rent to Value Ratio
Active
$1,975,000
4
bds
|
4
ba
|
3,327
sqft
|
built
1952
5757 SW 49th St, Miami, FL 33155
$-5,744
Cash flow
-15.2%
Cash-on-Cash Return
2.8%
Cap rate
0.4%
Rent to Value Ratio
Active
$990,000
3
bds
|
3
ba
|
1,552
sqft
|
built
2019
851 NE 1st Ave, Miami, FL 33132
$-2,272
Cash flow
-12.0%
Cash-on-Cash Return
3.5%
Cap rate
1.0%
Rent to Value Ratio
Active
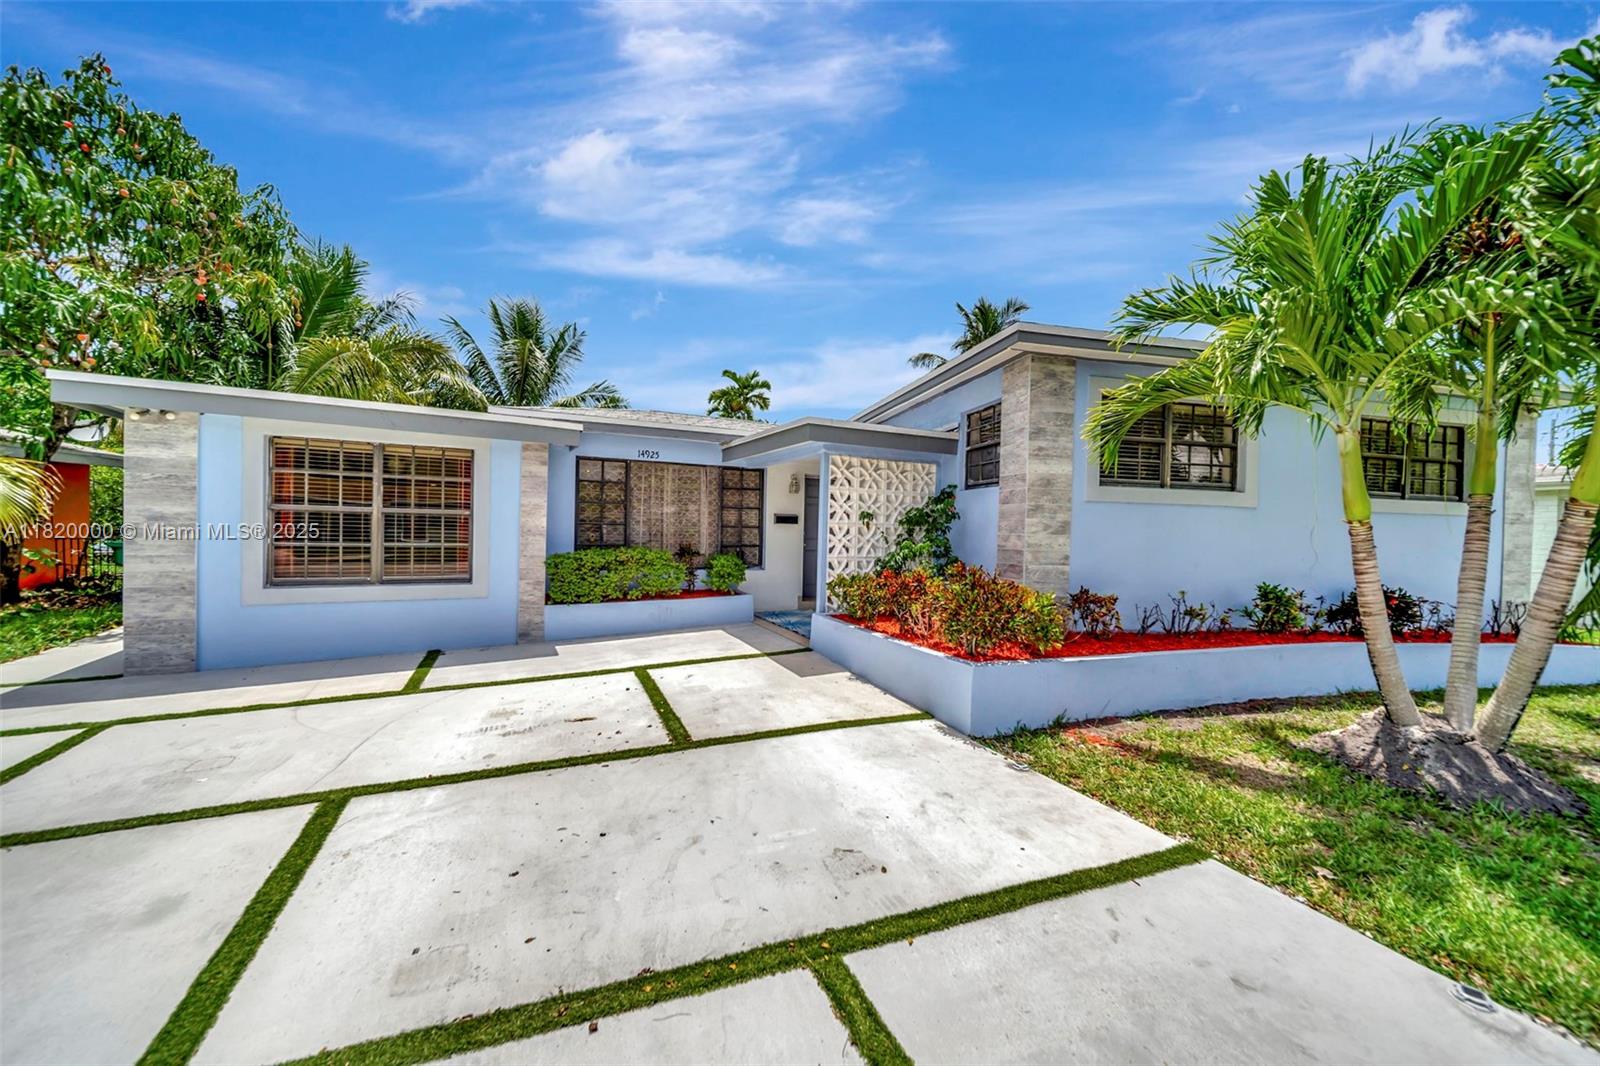
$775,000
4
bds
|
3
ba
|
1,821
sqft
|
built
1957
14925 NE 7th Ave, Miami, FL 33161
$-1,944
Cash flow
-13.1%
Cash-on-Cash Return
3.3%
Cap rate
0.5%
Rent to Value Ratio

Active
$420,000
2
bds
|
3
ba
|
1,351
sqft
|
built
1981
1651 SW 122nd Ct, Miami, FL 33175
$-883
Cash flow
-11.0%
Cash-on-Cash Return
3.8%
Cap rate
0.7%
Rent to Value Ratio
Active
$1,198,000
2
bds
|
2
ba
|
1,461
sqft
|
built
2008
475 Brickell Ave, Miami, FL 33131
$-4,797
Cash flow
-20.9%
Cash-on-Cash Return
1.5%
Cap rate
0.5%
Rent to Value Ratio
Active
$3,000,000
2
bds
|
0
ba
|
0
sqft
|
built
1920
4245 Braganza Ave, Miami, FL 33133
$-12,169
Cash flow
-21.2%
Cash-on-Cash Return
1.4%
Cap rate
0.2%
Rent to Value Ratio
Active
$1,399,000
2
bds
|
2
ba
|
1,286
sqft
|
built
2009
485 Brickell Ave, Miami, FL 33131
$-2,411
Cash flow
-9.0%
Cash-on-Cash Return
4.2%
Cap rate
0.7%
Rent to Value Ratio
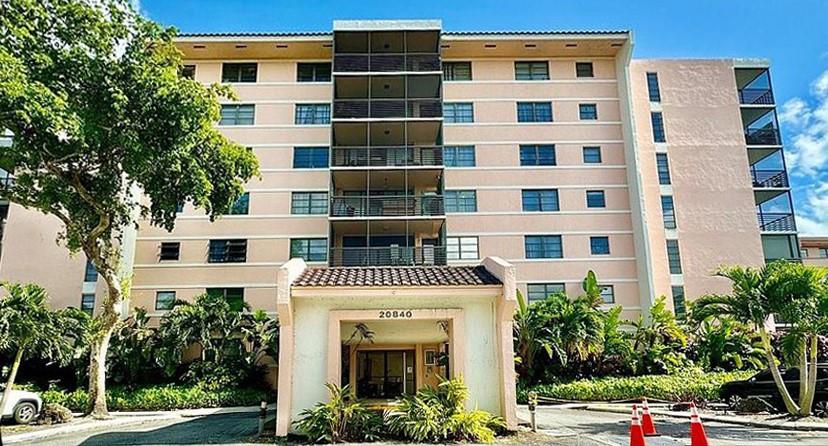
Active
$214,999
2
bds
|
2
ba
|
1,596
sqft
|
built
1983
20840 San Simeon Way, Miami, FL 33179
$-325
Cash flow
-7.9%
Cash-on-Cash Return
4.5%
Cap rate
1.1%
Rent to Value Ratio
Active
$545,000
1
bds
|
1
ba
|
791
sqft
|
built
2004
2101 Brickell Ave, Miami, FL 33129
$-1,900
Cash flow
-18.2%
Cash-on-Cash Return
2.1%
Cap rate
0.6%
Rent to Value Ratio
Active
$190,000
2
bds
|
1
ba
|
855
sqft
|
built
1945
424 NE 82nd St, Miami, FL 33138
$-71
Cash flow
-1.9%
Cash-on-Cash Return
5.8%
Cap rate
1.2%
Rent to Value Ratio