Miami, FL Investment Properties for Sale
Browse homes for sale and investment properties in Miami, FL. Refine your search by price, property type, or more.
Best cash flowing properties in Miami, FL
Active
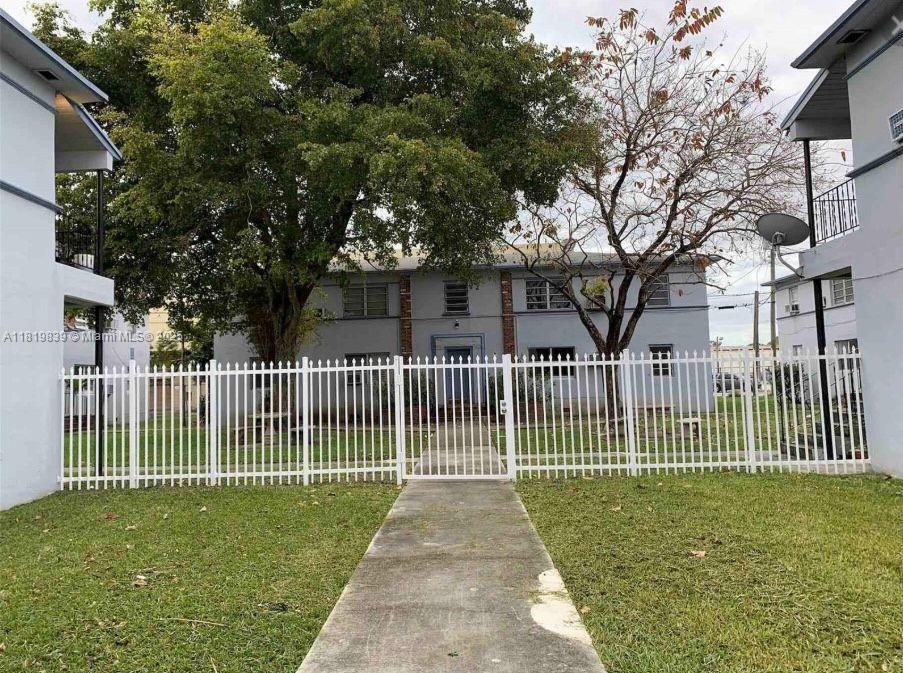
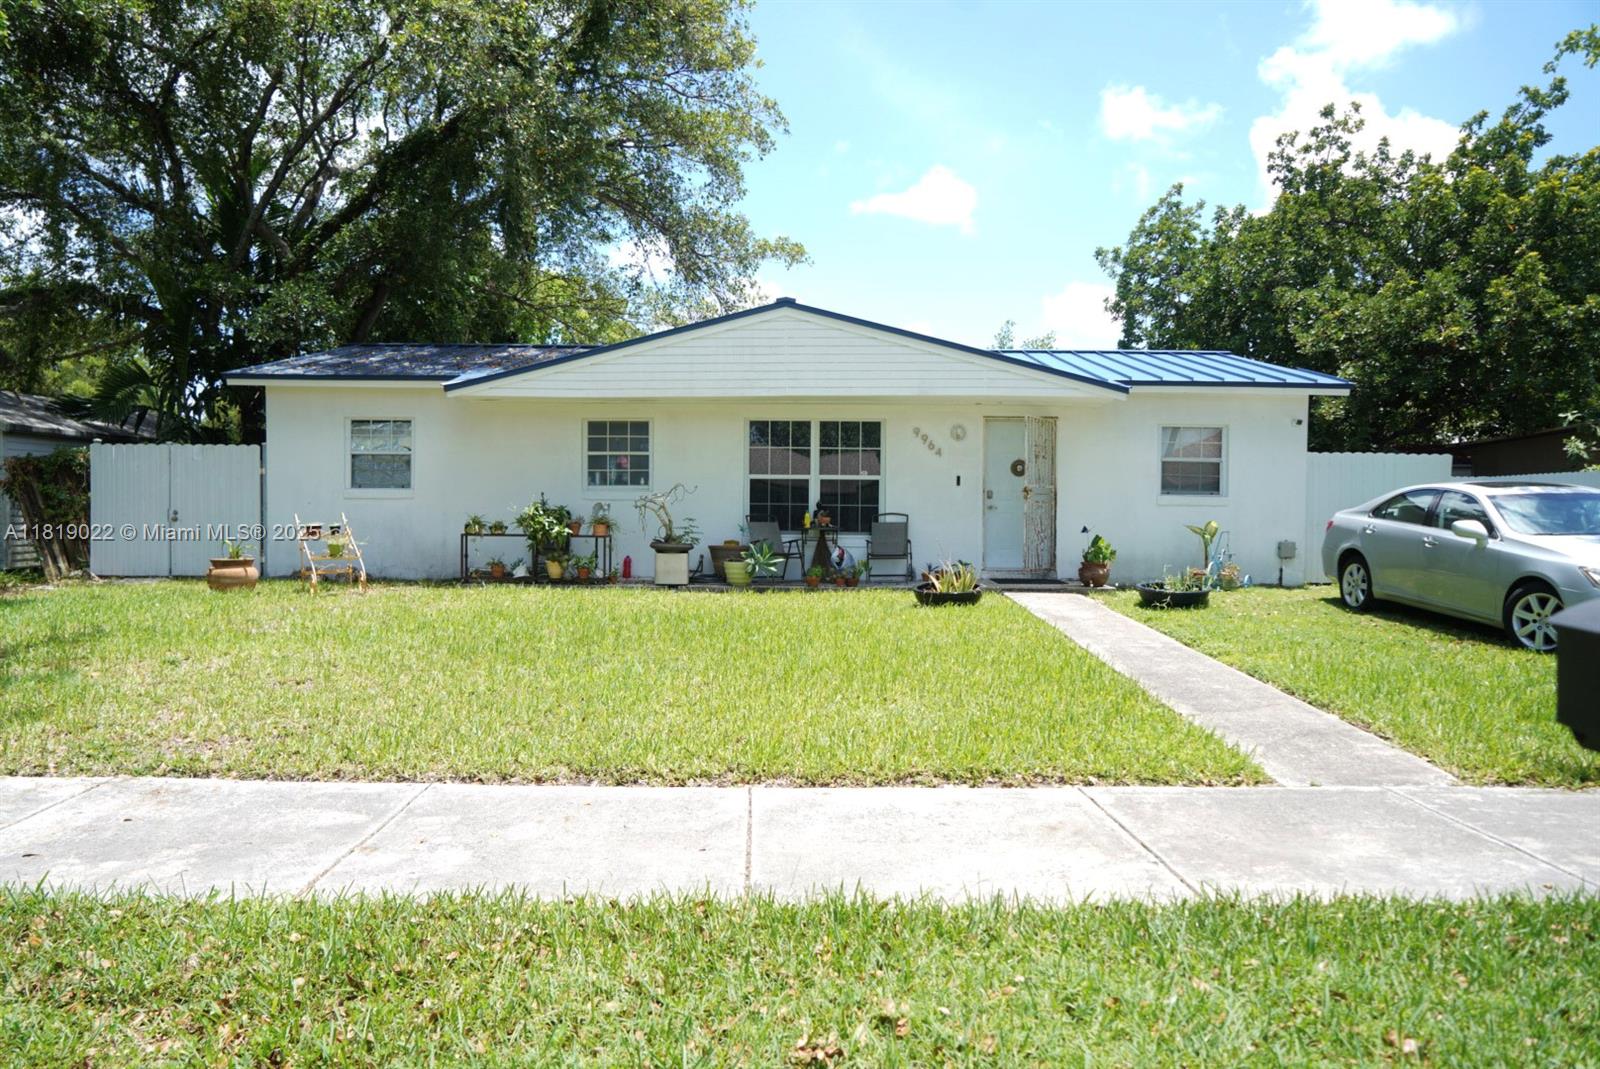
$190,000
2
bds
|
1
ba
|
855
sqft
|
built
1945
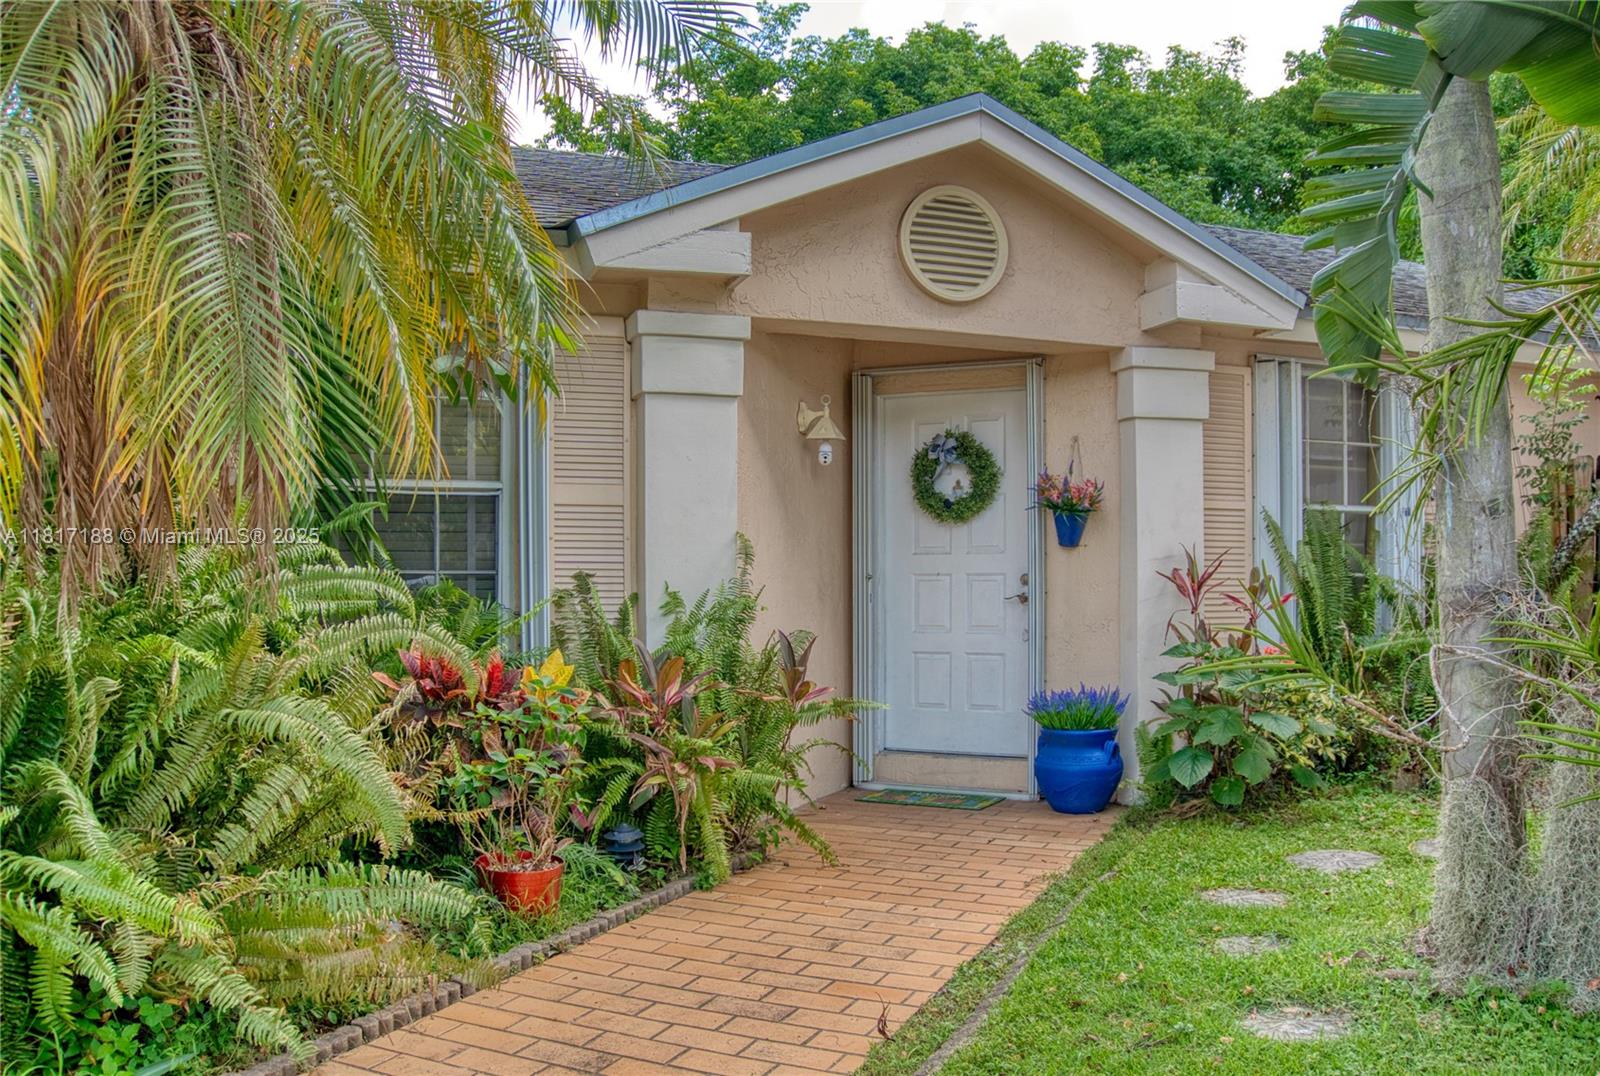
424 NE 82nd St, Miami, FL 33138
$-71
Cash flow
-1.9%
Cash-on-Cash Return
5.8%
Cap rate
1.2%
Rent to Value Ratio
Active
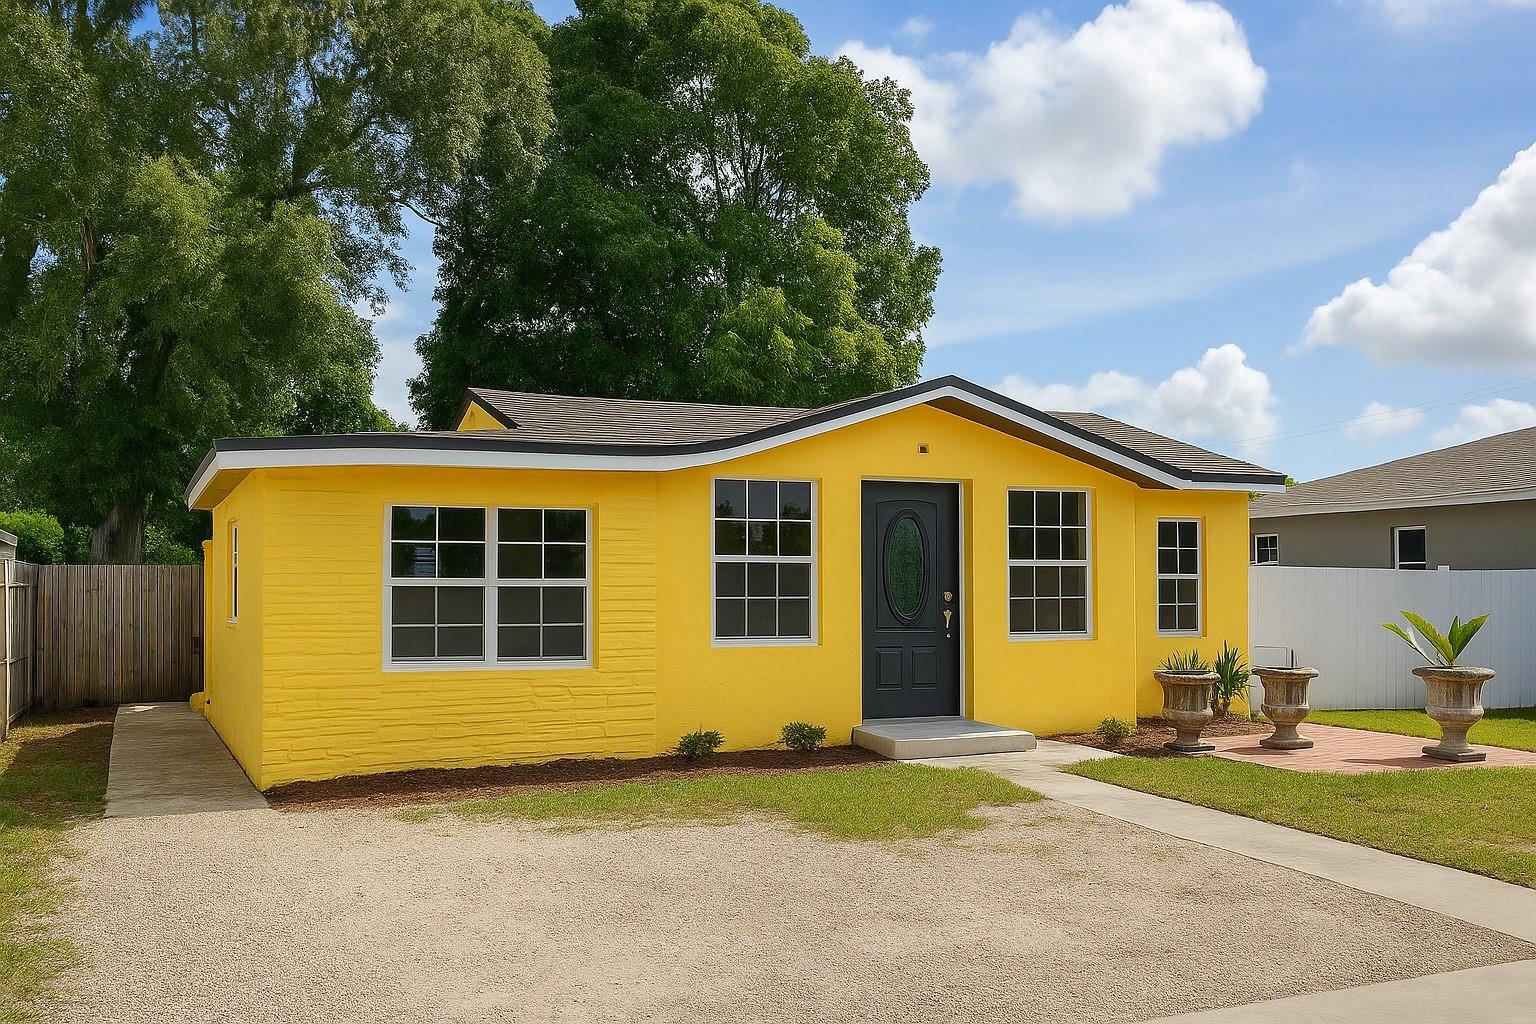
$425,000
3
bds
|
2
ba
|
1,518
sqft
|
built
1930
2125 NW 43rd St, Miami, FL 33142
$-394
Cash flow
-4.8%
Cash-on-Cash Return
5.2%
Cap rate
0.7%
Rent to Value Ratio
6,349 out of 7,208 properties for sale in Miami, FL
Limited Results Shown
Create a free account, or log in to reveal all property listings and enjoy the complete experience.
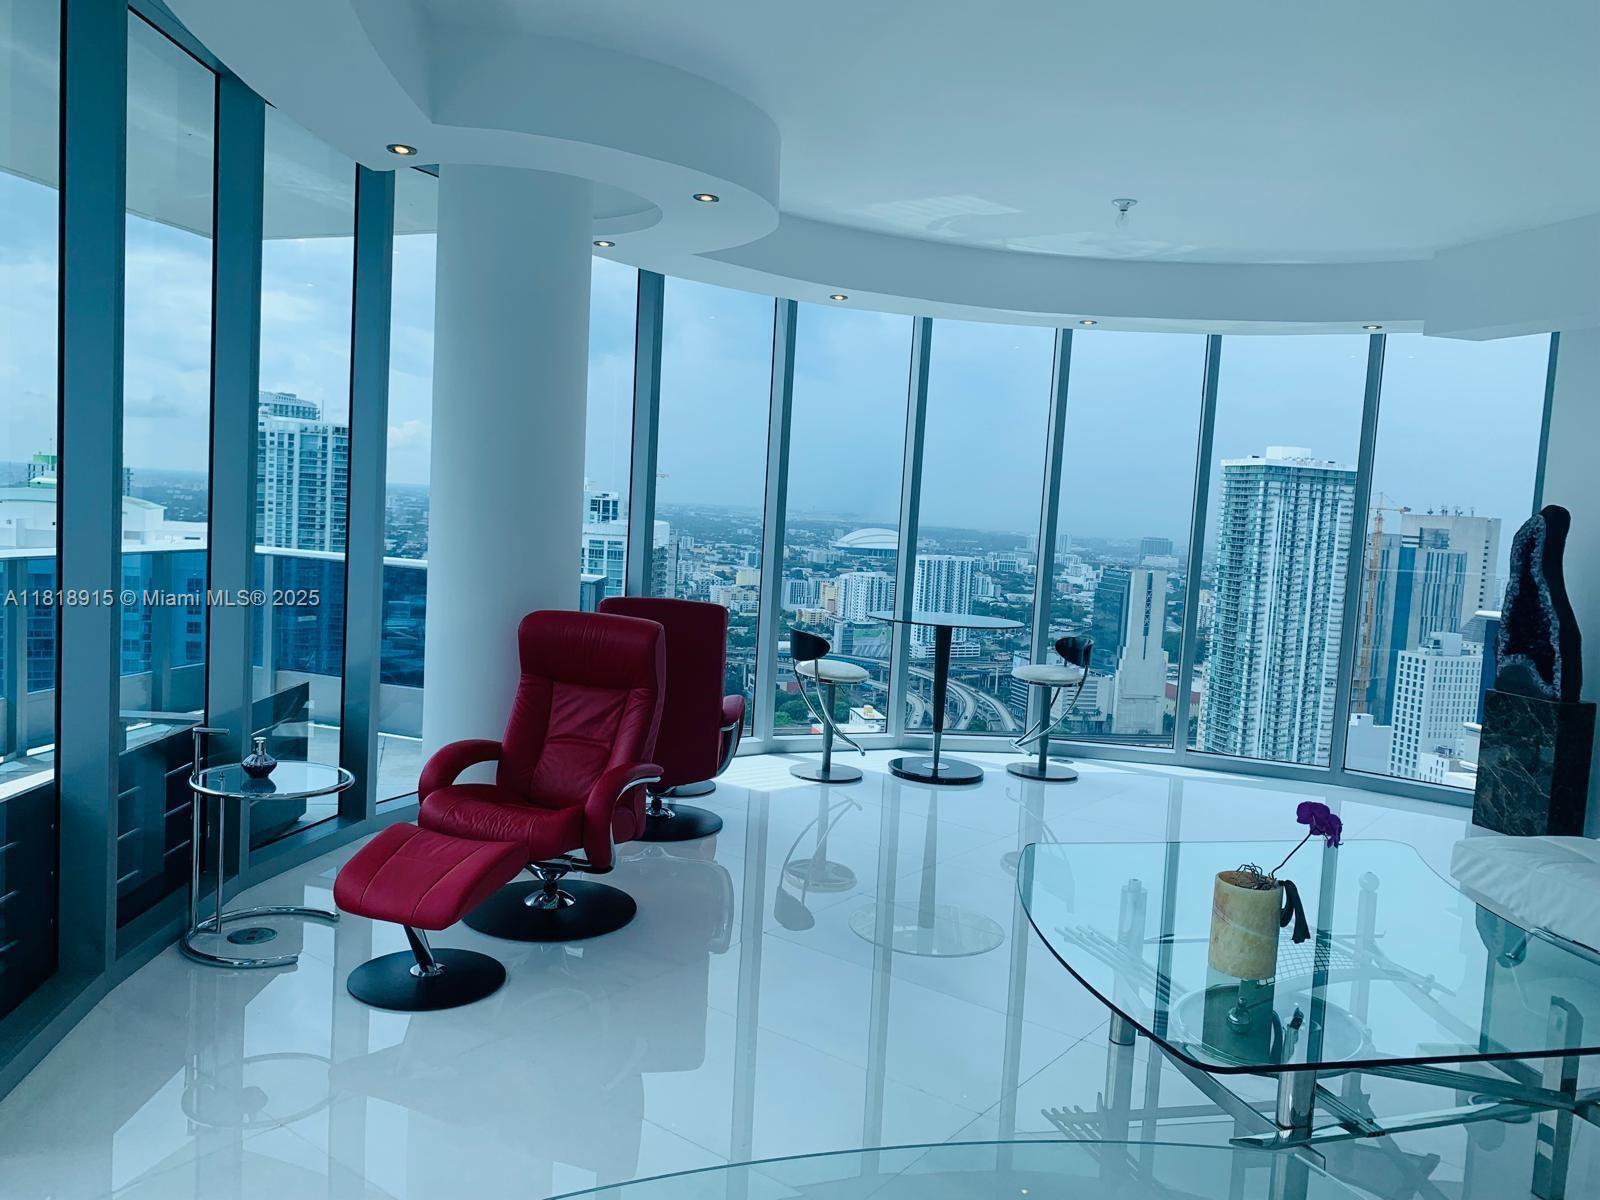
Active
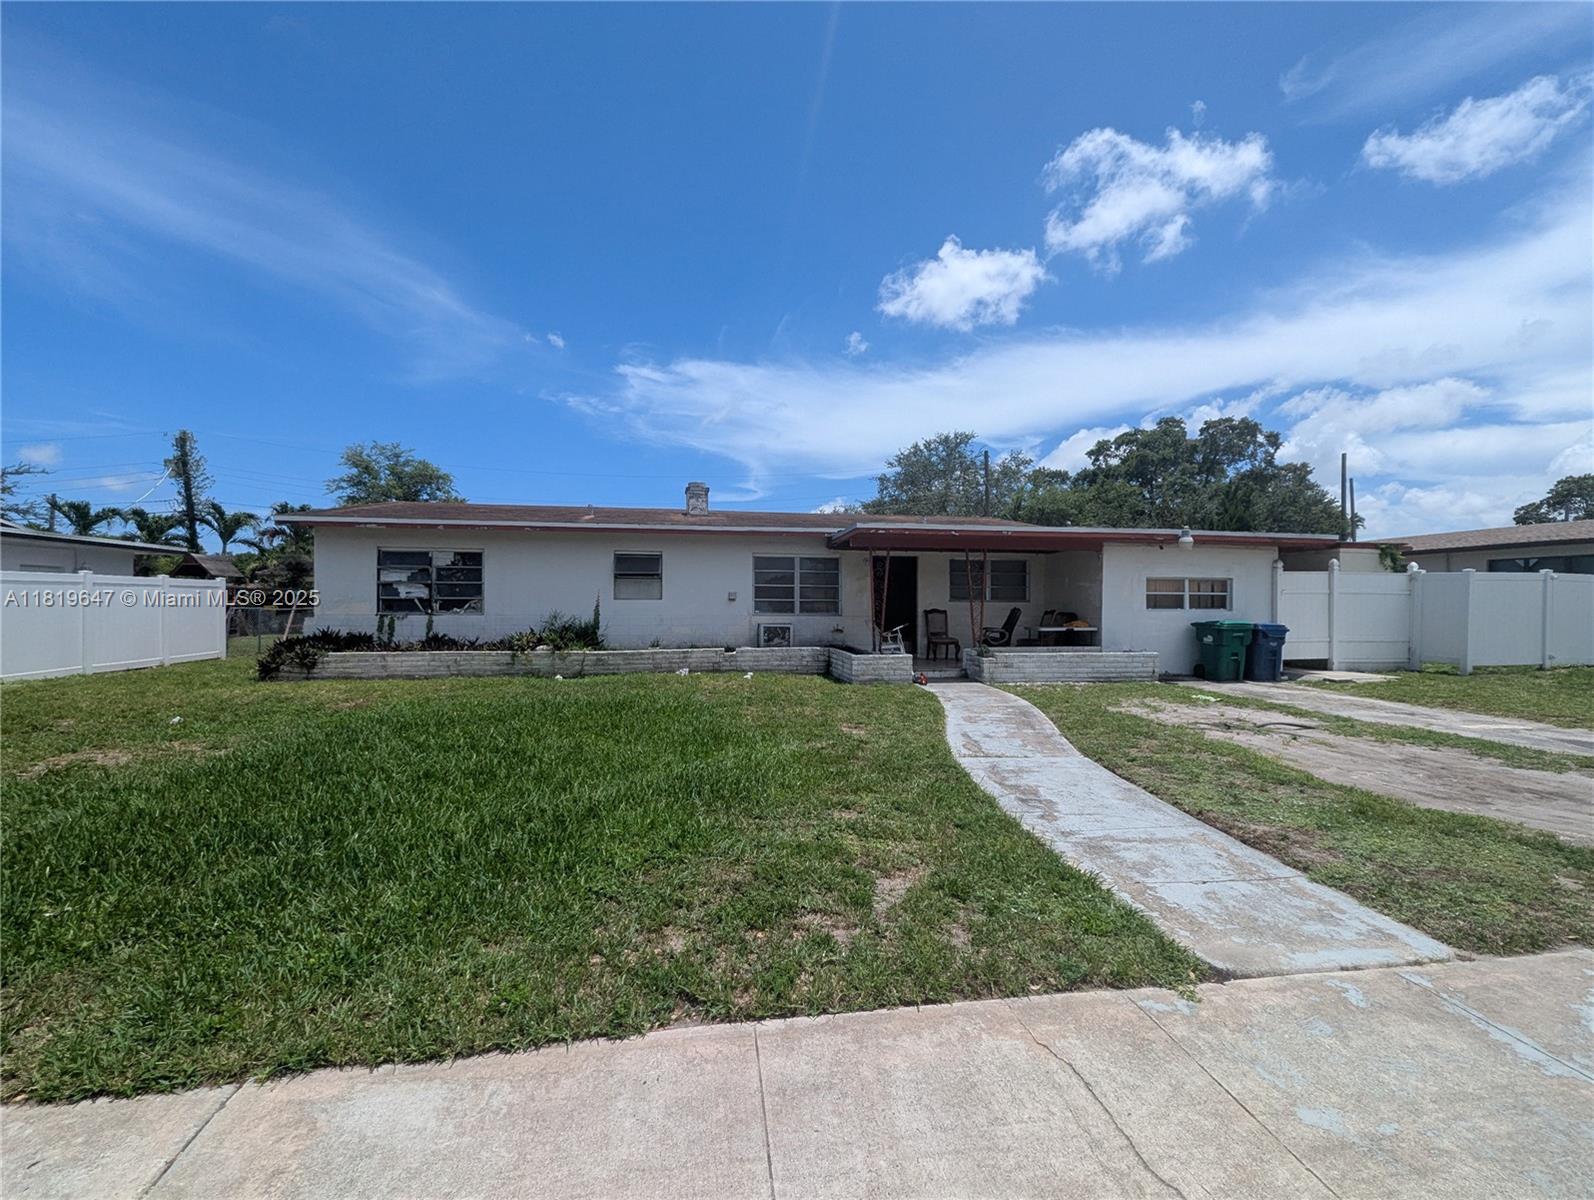
$999,999
2
bds
|
2
ba
|
1,726
sqft
|
built
1954
950 NE 172nd St, Miami, FL 33162
$-2,943
Cash flow
-15.4%
Cash-on-Cash Return
2.8%
Cap rate
0.4%
Rent to Value Ratio
Active
$190,000
2
bds
|
1
ba
|
855
sqft
|
built
1945
424 NE 82nd St, Miami, FL 33138
$-71
Cash flow
-1.9%
Cash-on-Cash Return
5.8%
Cap rate
1.2%
Rent to Value Ratio
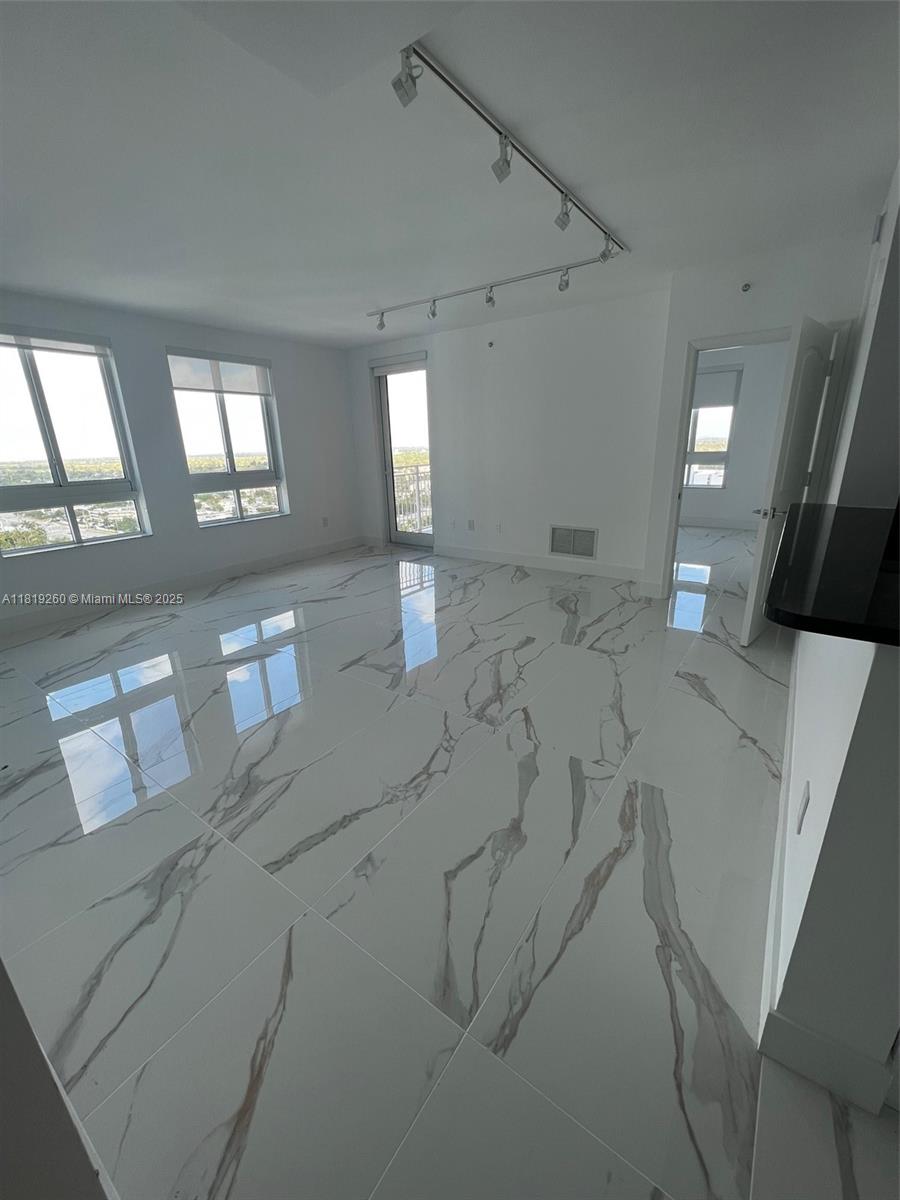
Active
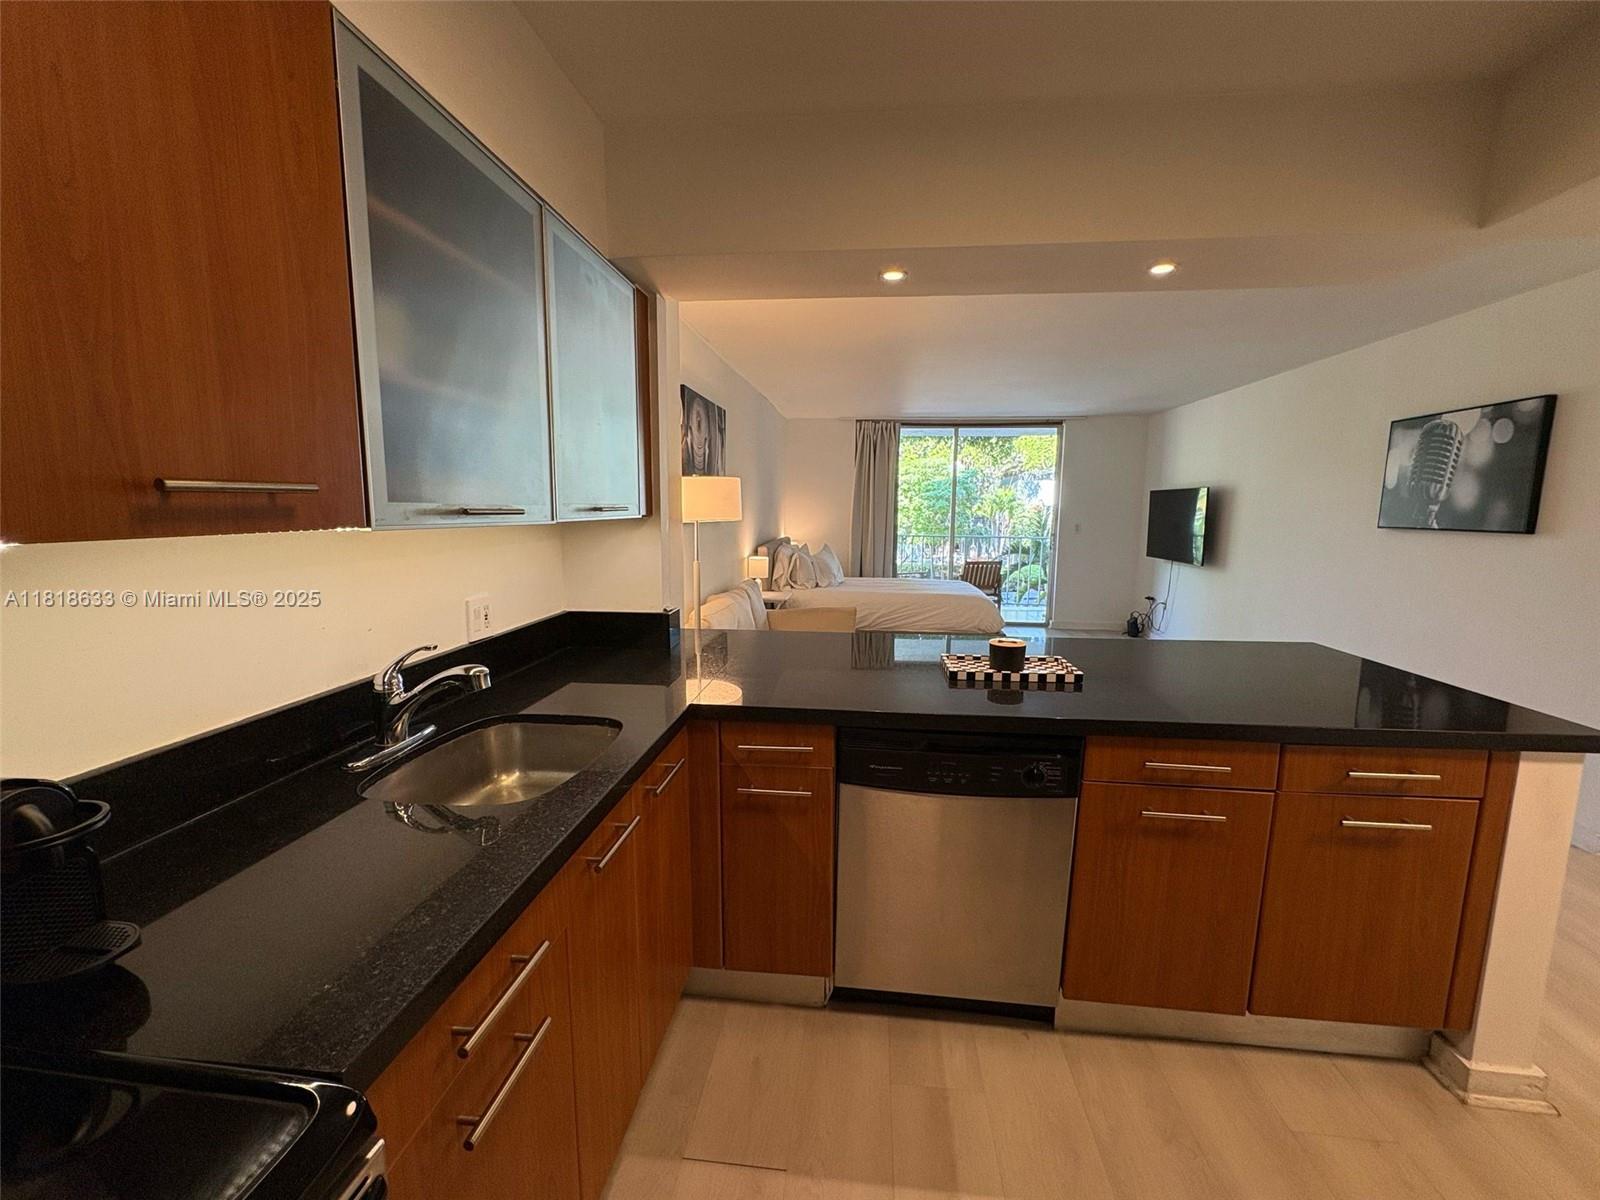
$249,900
0
bds
|
1
ba
|
571
sqft
|
built
1985
700 NE 63rd St, Miami, FL 33138
$-962
Cash flow
-20.1%
Cash-on-Cash Return
1.7%
Cap rate
0.8%
Rent to Value Ratio
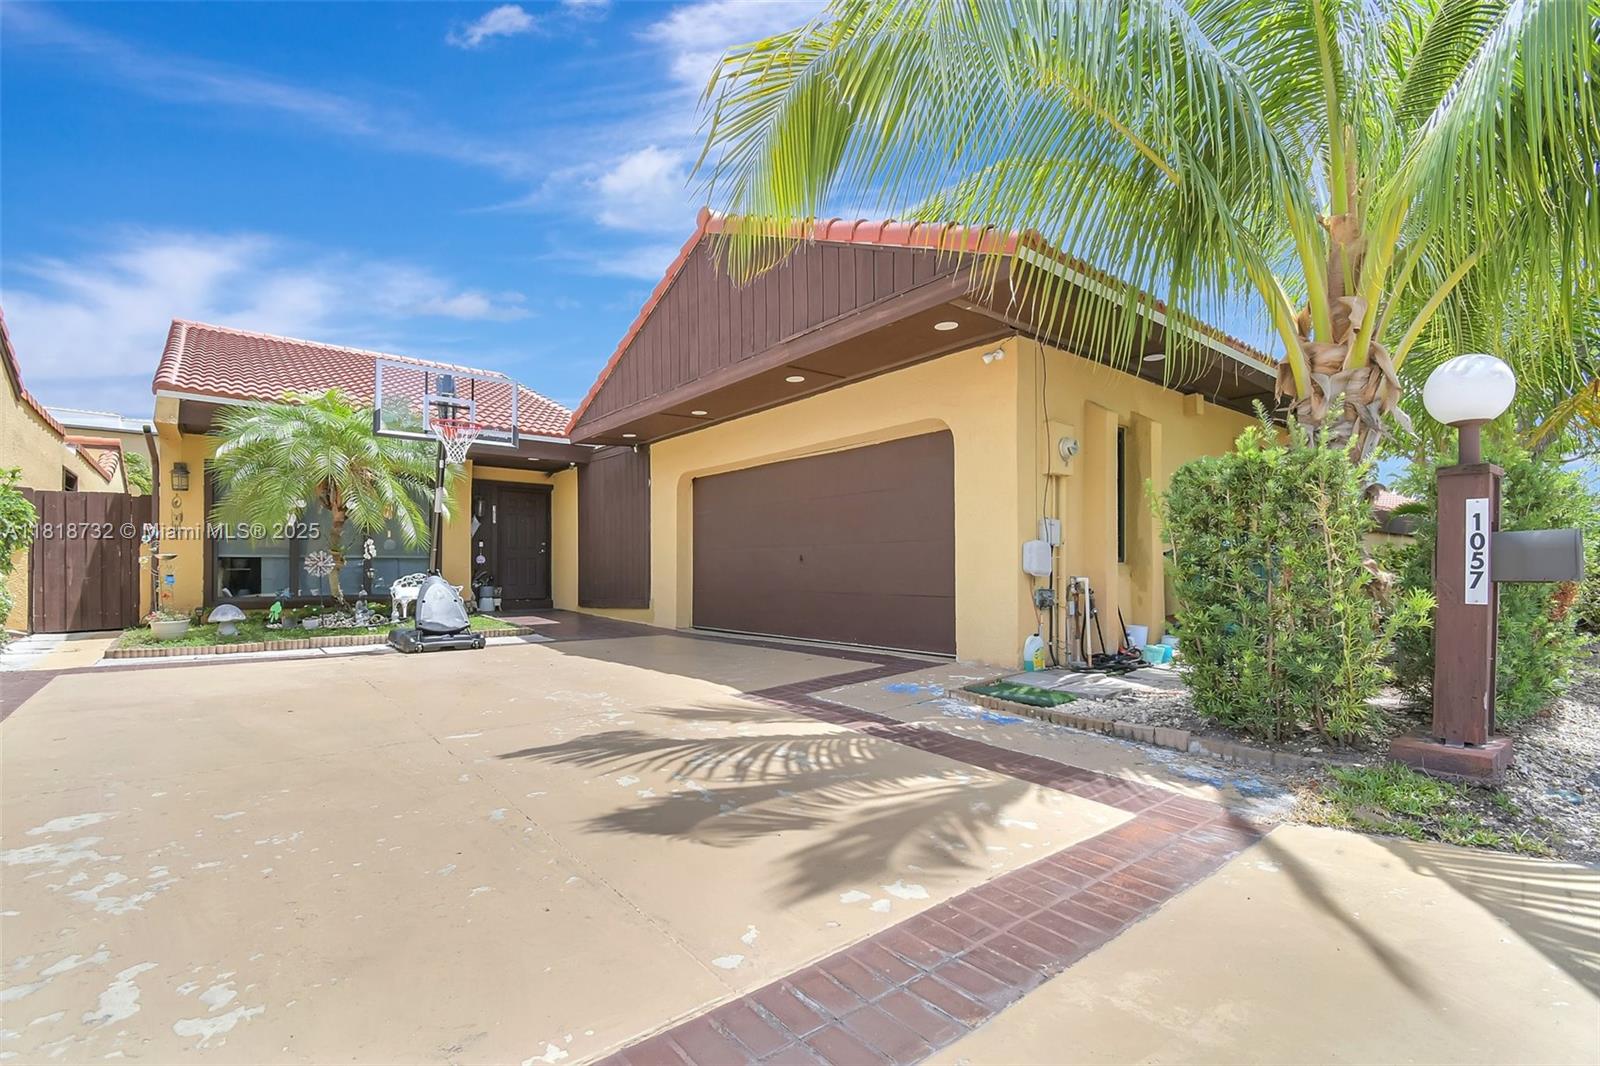
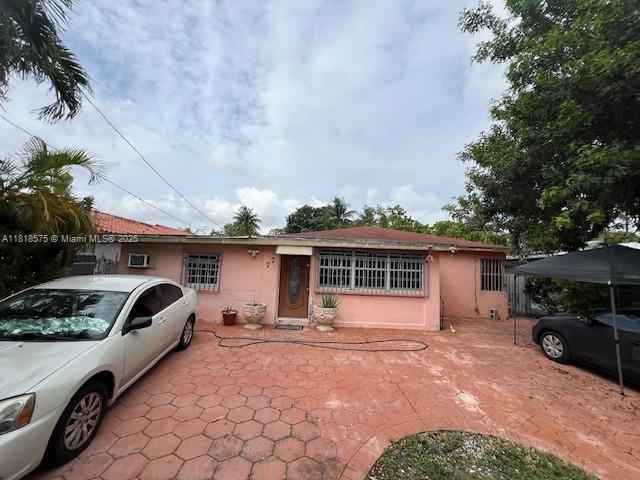
Active
$650,000
3
bds
|
2
ba
|
1,673
sqft
|
built
1980
1057 NE 202nd Ln, Miami, FL 33179
$-1,692
Cash flow
-13.6%
Cash-on-Cash Return
3.2%
Cap rate
0.6%
Rent to Value Ratio
Active
$325,000
2
bds
|
2
ba
|
784
sqft
|
built
2007
1 Glen Royal Pkwy, Miami, FL 33125
$-824
Cash flow
-13.2%
Cash-on-Cash Return
3.2%
Cap rate
0.7%
Rent to Value Ratio
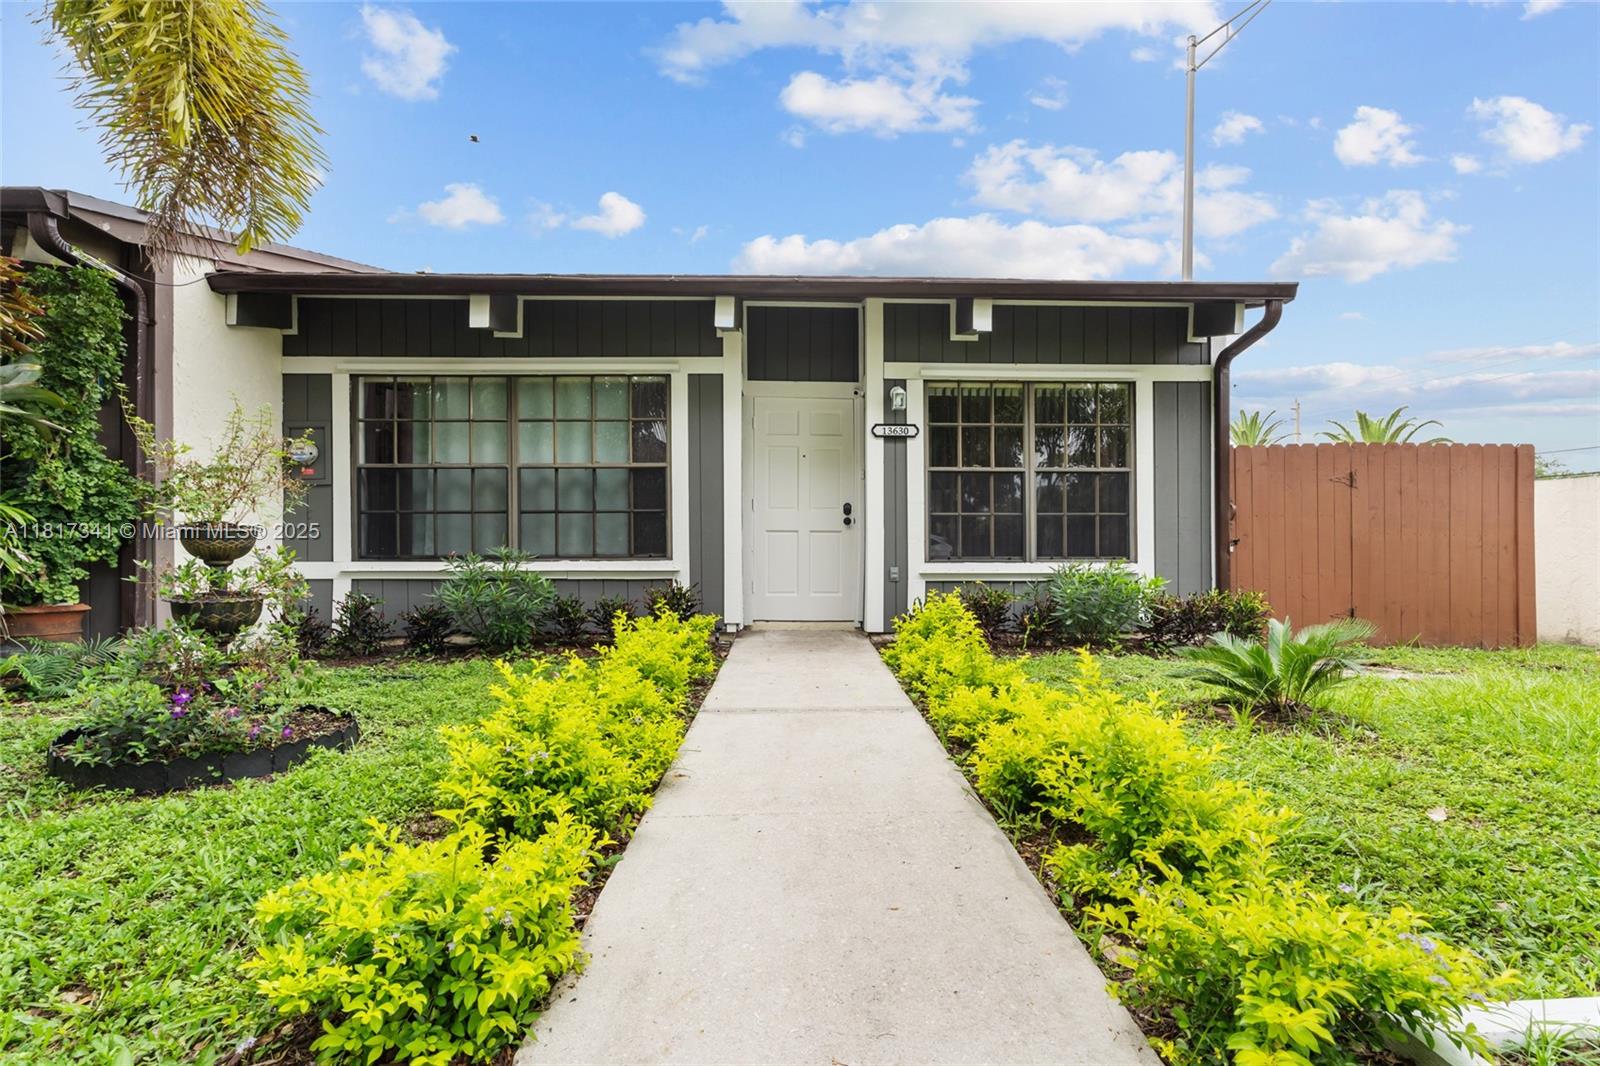
Active
$459,000
2
bds
|
2
ba
|
1,222
sqft
|
built
1979
13630 SW 101st Ln, Miami, FL 33186
$-1,153
Cash flow
-13.1%
Cash-on-Cash Return
3.3%
Cap rate
0.6%
Rent to Value Ratio
Active
$1,275,000
4
bds
|
3
ba
|
2,086
sqft
|
built
1944
3075 SW 19th St, Miami, FL 33145
$-3,947
Cash flow
-16.2%
Cash-on-Cash Return
2.6%
Cap rate
0.4%
Rent to Value Ratio
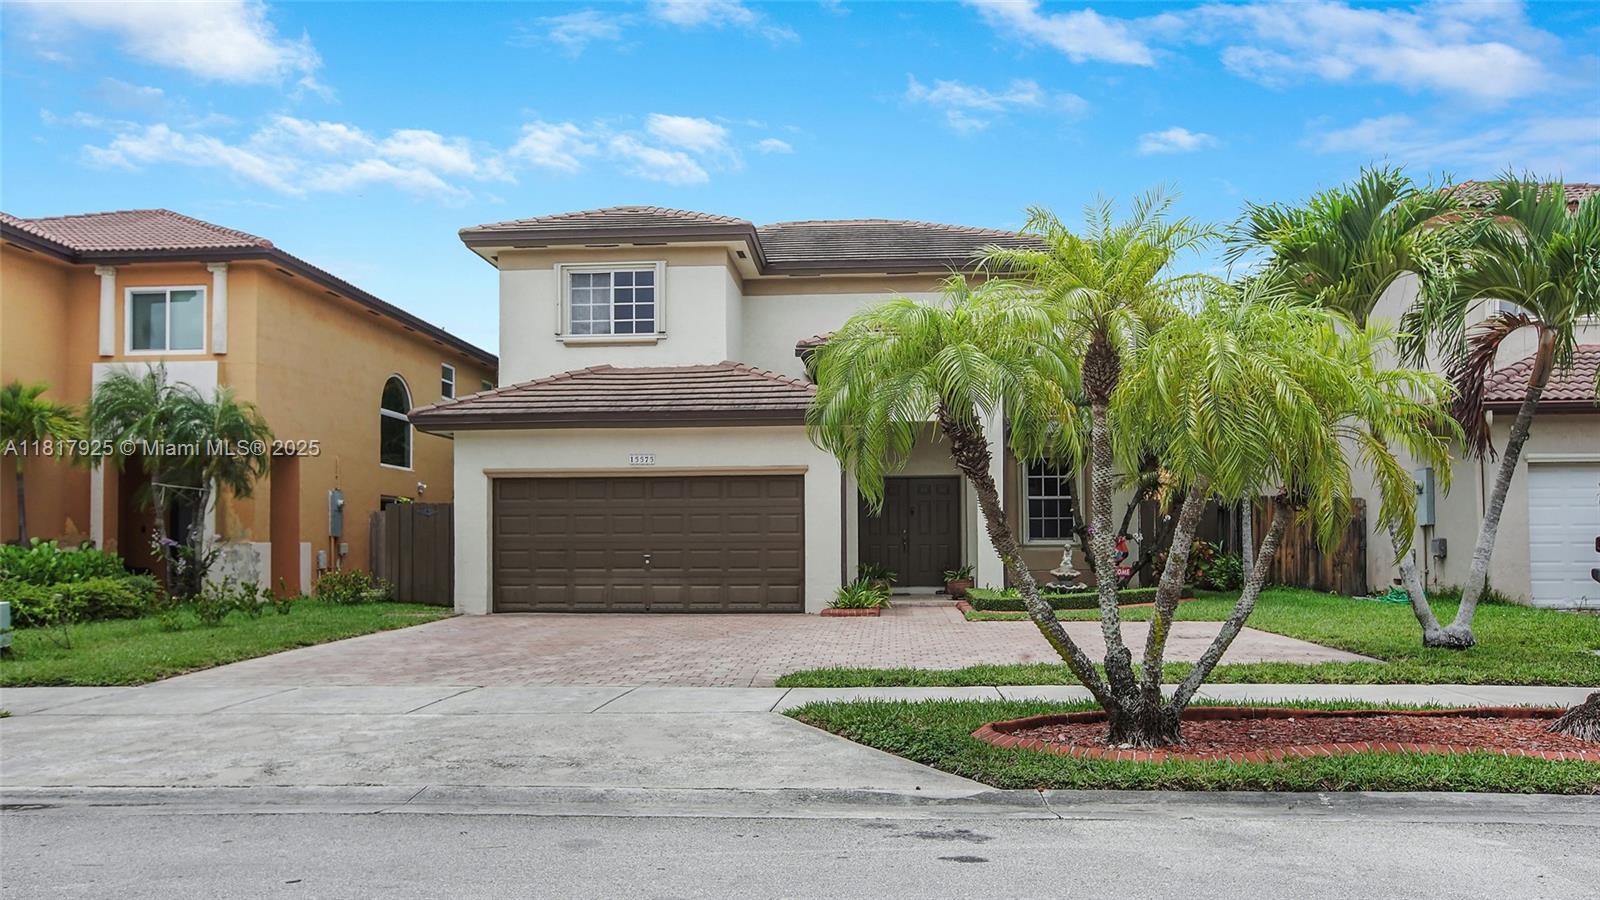
Active
$819,900
3
bds
|
3
ba
|
2,254
sqft
|
built
2003
15575 SW 9th Ln, Miami, FL 33194
$-2,101
Cash flow
-13.4%
Cash-on-Cash Return
3.2%
Cap rate
0.5%
Rent to Value Ratio
Active
$1,775,000
4
bds
|
2
ba
|
2,361
sqft
|
built
1968
8005 SW 89th St, Miami, FL 33156
$-6,186
Cash flow
-18.2%
Cash-on-Cash Return
2.1%
Cap rate
0.3%
Rent to Value Ratio

Active
$775,000
2
bds
|
1
ba
|
930
sqft
|
built
1935
8730 NE 8th Ct, Miami, FL 33138
$-2,341
Cash flow
-15.8%
Cash-on-Cash Return
2.7%
Cap rate
0.4%
Rent to Value Ratio
Active
$850,000
5
bds
|
4
ba
|
2,382
sqft
|
built
1954
1325 NE 203rd St, Miami, FL 33179
$-2,391
Cash flow
-14.7%
Cash-on-Cash Return
2.9%
Cap rate
0.5%
Rent to Value Ratio
Active
$1,499,999
3
bds
|
4
ba
|
1,641
sqft
|
built
2016
68 SE 6th St, Miami, FL 33131
$-6,078
Cash flow
-21.1%
Cash-on-Cash Return
1.4%
Cap rate
0.6%
Rent to Value Ratio
Active
$590,000
2
bds
|
2
ba
|
1,180
sqft
|
built
2007
1900 N Bayshore Dr, Miami, FL 33132
$-1,883
Cash flow
-16.7%
Cash-on-Cash Return
2.5%
Cap rate
0.8%
Rent to Value Ratio
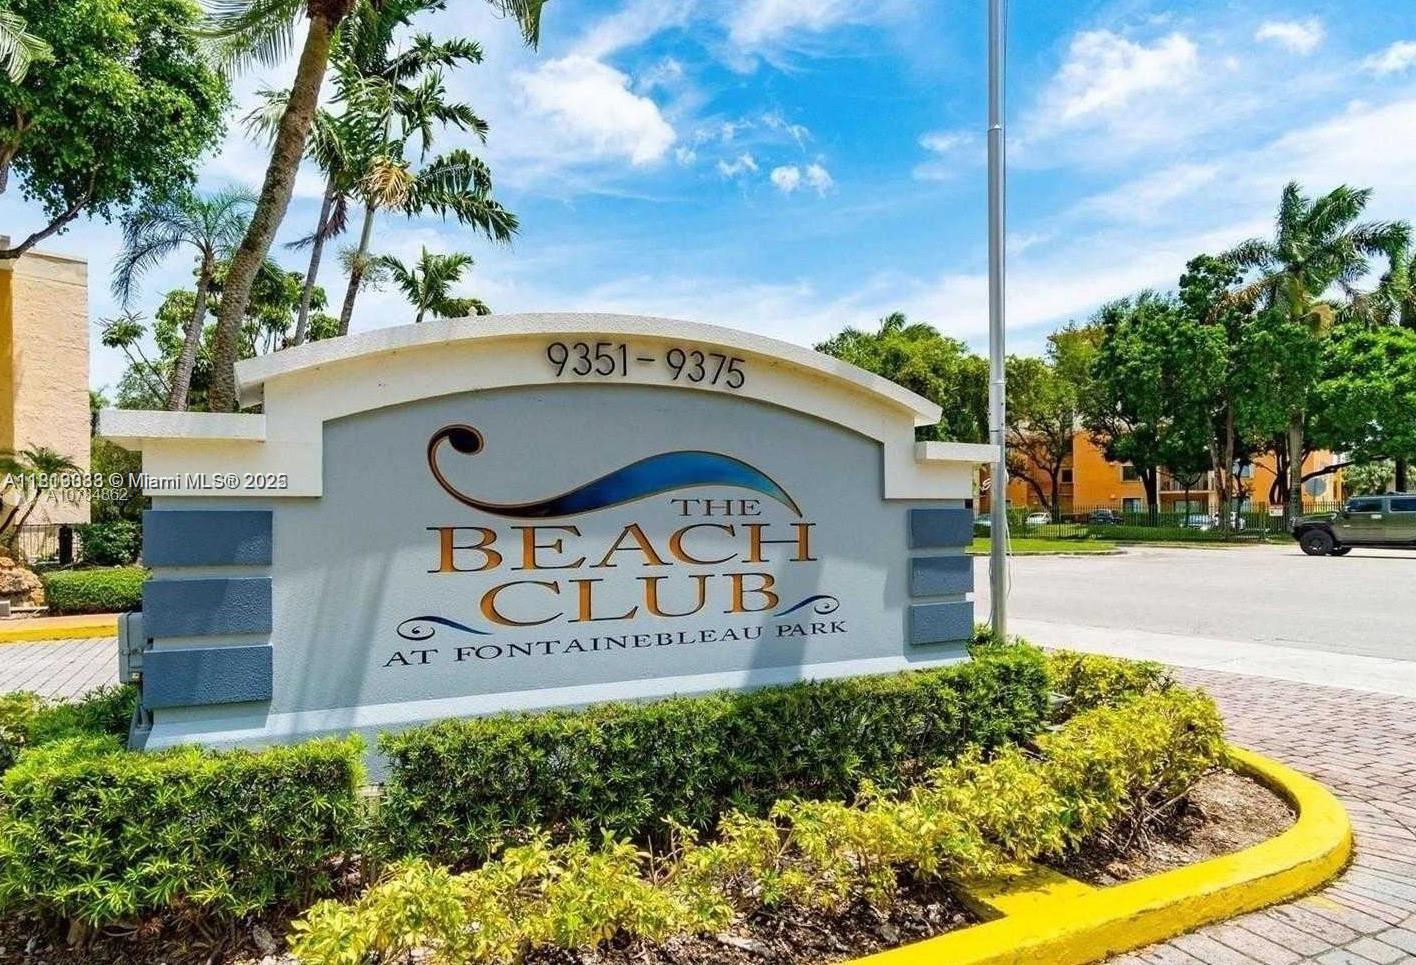
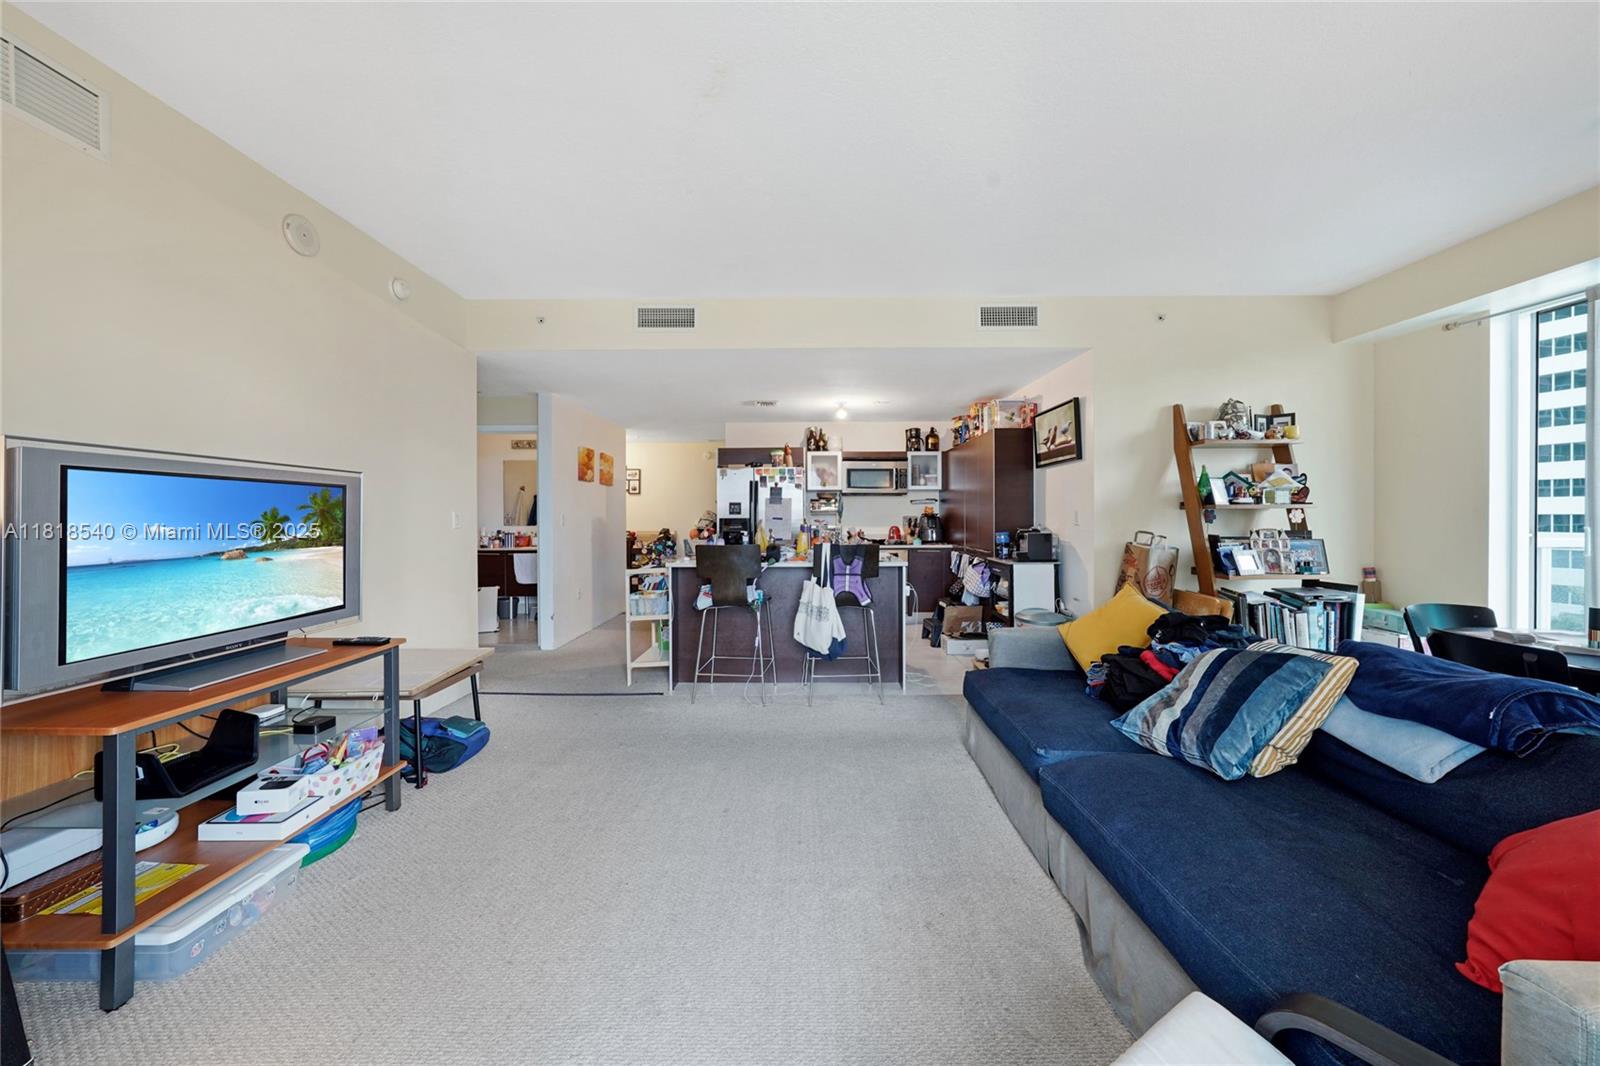
Active
$270,000
1
bds
|
2
ba
|
1,125
sqft
|
built
1972
9363 Fontainebleau Blvd, Miami, FL 33172
$-654
Cash flow
-12.6%
Cash-on-Cash Return
3.4%
Cap rate
0.7%
Rent to Value Ratio
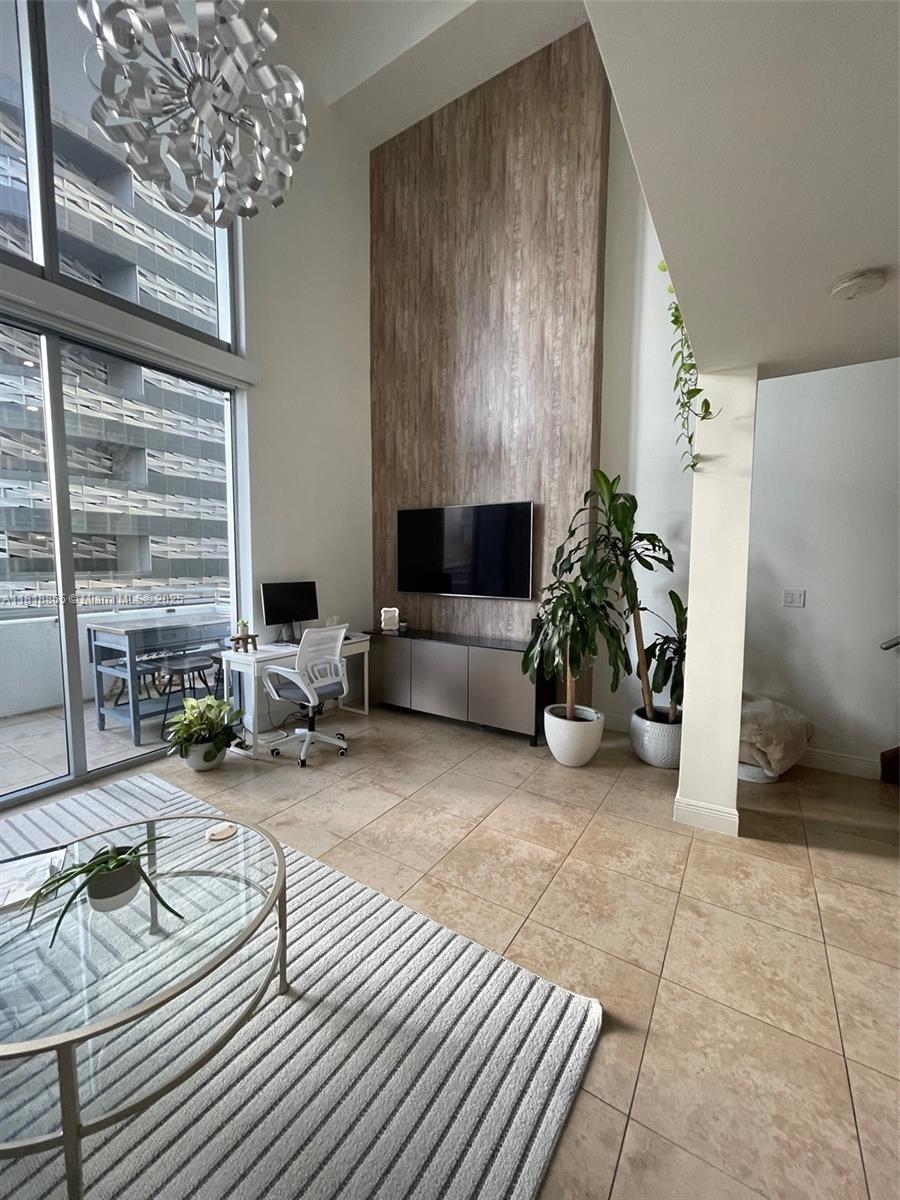
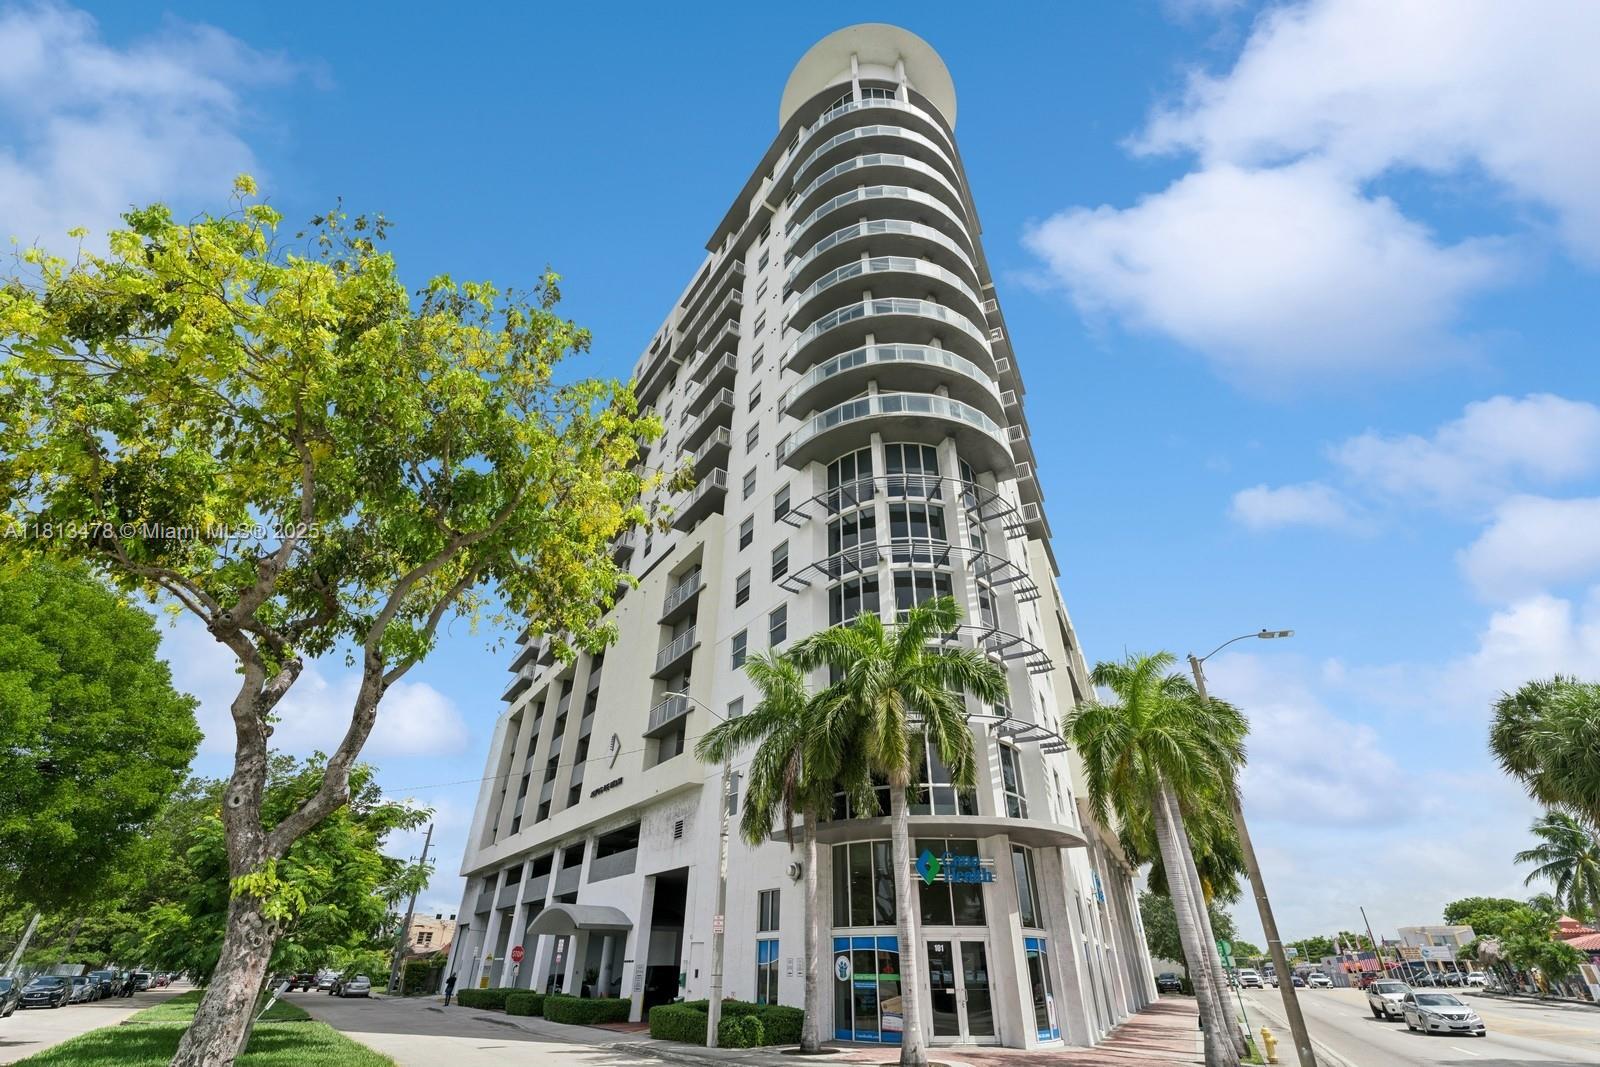
Active
$520,000
1
bds
|
2
ba
|
1,000
sqft
|
built
2008
1050 Brickell Ave, Miami, FL 33131
$-2,103
Cash flow
-21.1%
Cash-on-Cash Return
1.4%
Cap rate
0.7%
Rent to Value Ratio
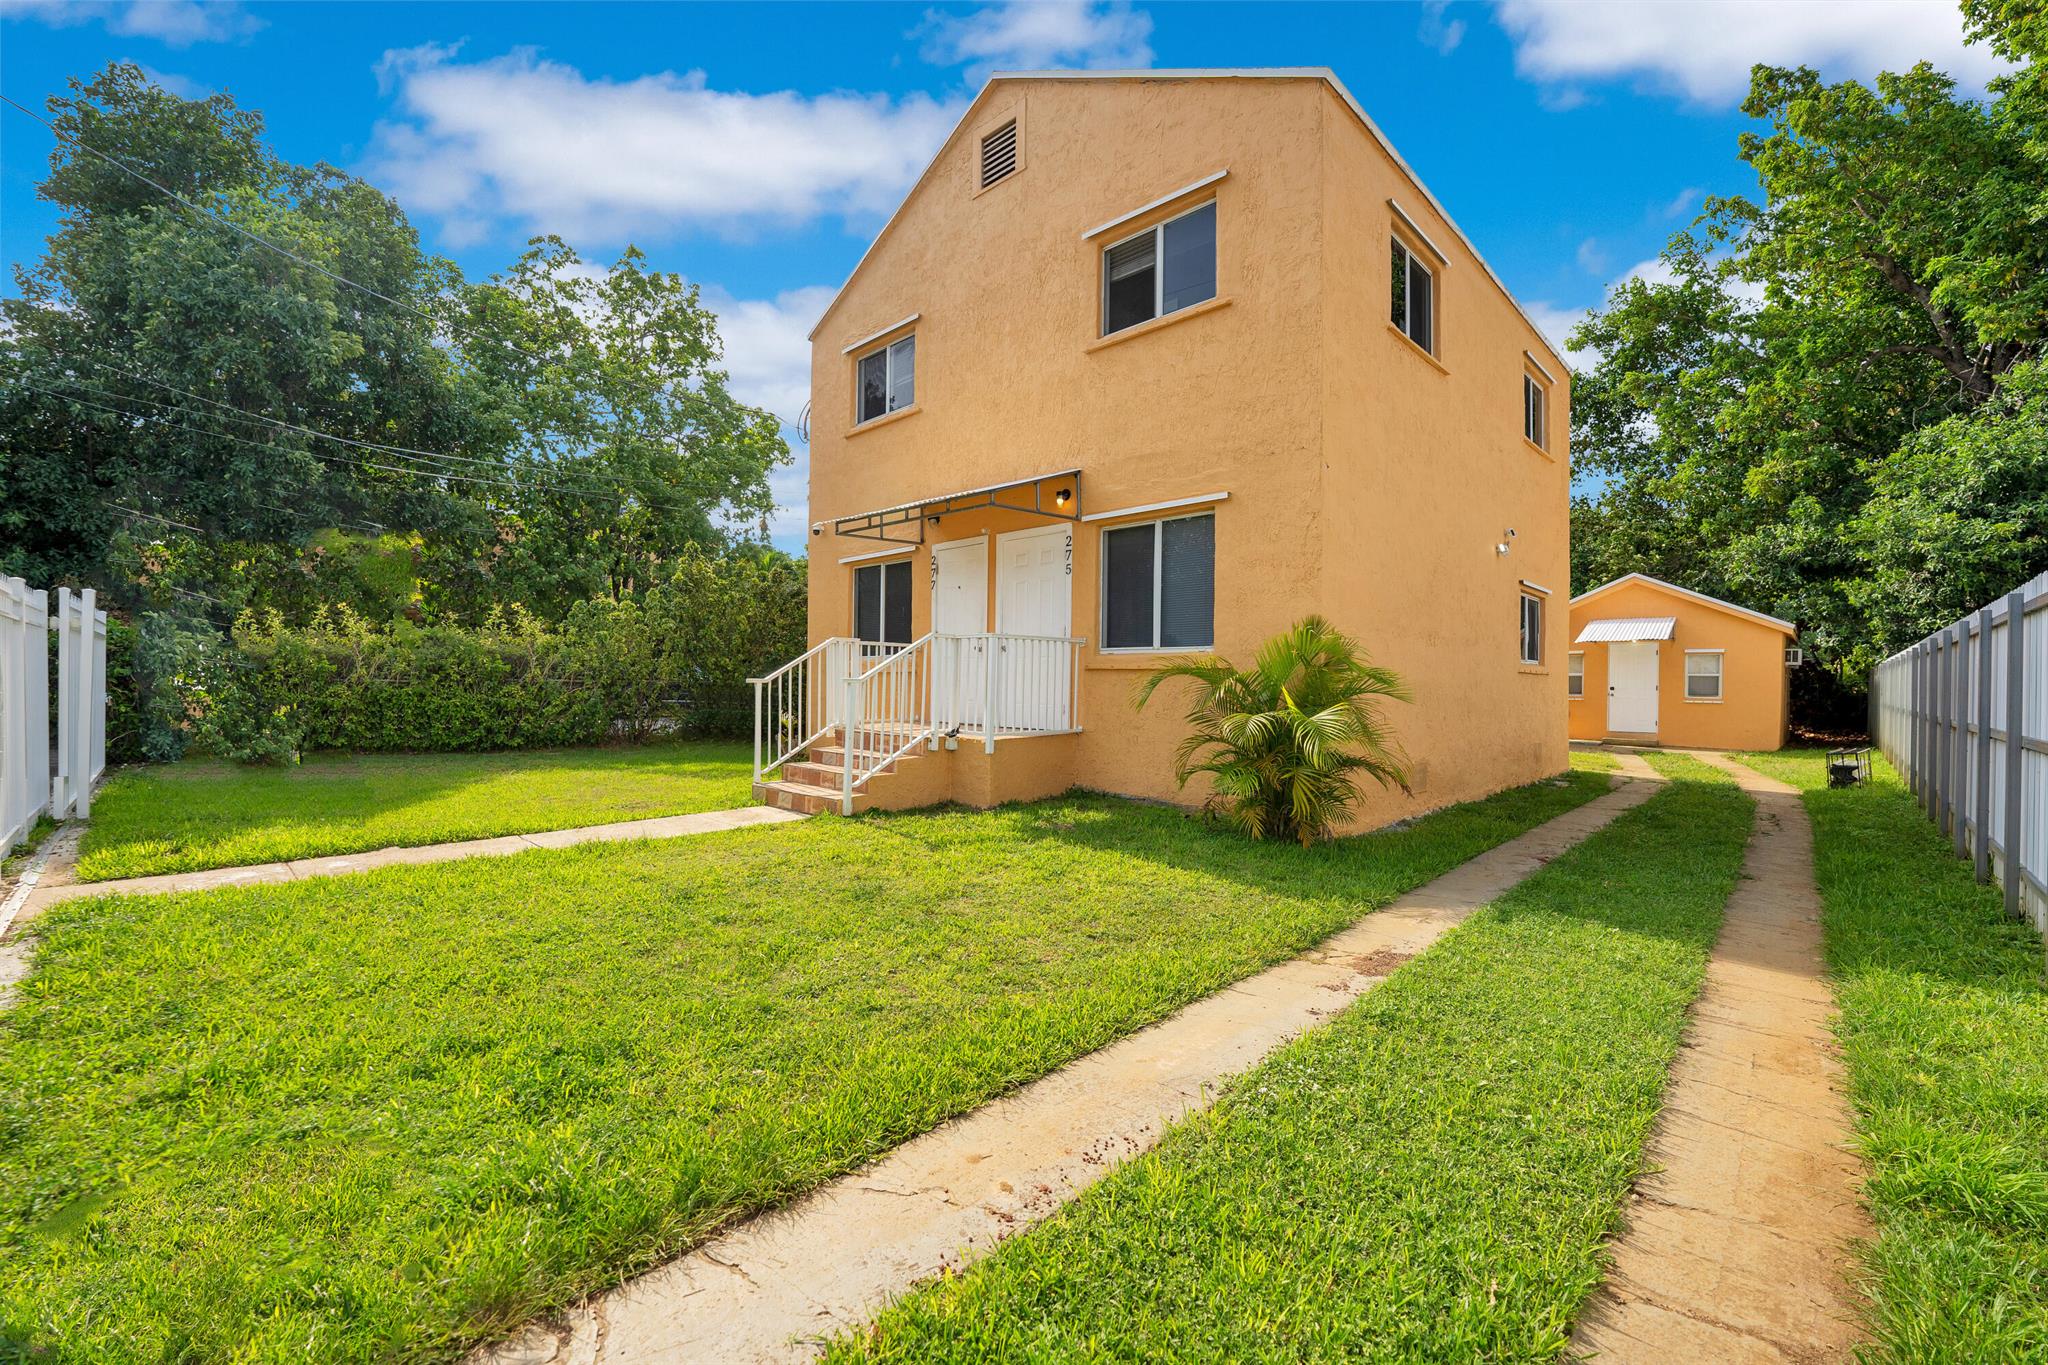
Active
$1,100,000
4
bds
|
0
ba
|
1,924
sqft
|
built
1934
275 NW 81st St, Miami, FL 33150
$-4,440
Cash flow
-21.1%
Cash-on-Cash Return
1.4%
Cap rate
0.2%
Rent to Value Ratio
Active
$469,900
3
bds
|
1
ba
|
1,058
sqft
|
built
1971
9964 SW 154th St, Miami, FL 33157
$-690
Cash flow
-7.7%
Cash-on-Cash Return
4.5%
Cap rate
0.6%
Rent to Value Ratio
Active
$2,170,000
3
bds
|
4
ba
|
2,457
sqft
|
built
2008
200 Biscayne Boulevard Way, Miami, FL 33131
$-10,030
Cash flow
-24.1%
Cash-on-Cash Return
0.7%
Cap rate
0.5%
Rent to Value Ratio
Active
$535,000
2
bds
|
2
ba
|
1,155
sqft
|
built
2007
7350 SW 89th St, Miami, FL 33156
$-2,232
Cash flow
-21.8%
Cash-on-Cash Return
1.3%
Cap rate
0.7%
Rent to Value Ratio

Active
$599,000
4
bds
|
3
ba
|
2,290
sqft
|
built
2005
11373 SW 137th Pl, Miami, FL 33186
$-1,818
Cash flow
-15.8%
Cash-on-Cash Return
2.6%
Cap rate
0.6%
Rent to Value Ratio
Active
$1,100,000
7
bds
|
0
ba
|
3,031
sqft
|
built
1952
77 Northwest Blvd, Miami, FL 33126
$-4,547
Cash flow
-21.6%
Cash-on-Cash Return
1.3%
Cap rate
0.2%
Rent to Value Ratio
Active
$614,999
3
bds
|
2
ba
|
1,386
sqft
|
built
1991
9835 SW 117th Ct, Miami, FL 33186
$-1,423
Cash flow
-12.1%
Cash-on-Cash Return
3.5%
Cap rate
0.5%
Rent to Value Ratio
Active
$640,000
1
bds
|
1
ba
|
816
sqft
|
built
2008
475 Brickell Ave, Miami, FL 33131
$-2,295
Cash flow
-18.7%
Cash-on-Cash Return
2.0%
Cap rate
0.6%
Rent to Value Ratio
Active
$425,000
3
bds
|
2
ba
|
1,518
sqft
|
built
1930
2125 NW 43rd St, Miami, FL 33142
$-394
Cash flow
-4.8%
Cash-on-Cash Return
5.2%
Cap rate
0.7%
Rent to Value Ratio

Active
$750,000
3
bds
|
2
ba
|
1,558
sqft
|
built
1954
4121 SW 99th Ave, Miami, FL 33165
$-2,265
Cash flow
-15.8%
Cash-on-Cash Return
2.7%
Cap rate
0.5%
Rent to Value Ratio

Active
$599,000
2
bds
|
2
ba
|
1,007
sqft
|
built
2006
480 NE 30th St, Miami, FL 33137
$-2,152
Cash flow
-18.7%
Cash-on-Cash Return
2.0%
Cap rate
0.7%
Rent to Value Ratio
Active
$280,000
2
bds
|
2
ba
|
900
sqft
|
built
1970
10903 SW 88th St, Miami, FL 33176
$-584
Cash flow
-10.9%
Cash-on-Cash Return
3.8%
Cap rate
0.8%
Rent to Value Ratio
Active
$312,500
1
bds
|
2
ba
|
760
sqft
|
built
2005
2400 SW 27th Ave, Miami, FL 33145
$-848
Cash flow
-14.2%
Cash-on-Cash Return
3.0%
Cap rate
0.8%
Rent to Value Ratio
Active
$285,000
2
bds
|
2
ba
|
1,036
sqft
|
built
1972
870 NW 87th Ave, Miami, FL 33172
$-723
Cash flow
-13.2%
Cash-on-Cash Return
3.2%
Cap rate
0.8%
Rent to Value Ratio

Active
$299,000
1
bds
|
1
ba
|
514
sqft
|
built
1966
3245 Virginia St, Miami, FL 33133
$-853
Cash flow
-14.9%
Cash-on-Cash Return
2.9%
Cap rate
0.7%
Rent to Value Ratio

Active
$700,000
3
bds
|
2
ba
|
1,801
sqft
|
built
1992
15640 SW 98th St, Miami, FL 33196
$-1,460
Cash flow
-10.9%
Cash-on-Cash Return
3.8%
Cap rate
0.5%
Rent to Value Ratio
Active
$550,000
3
bds
|
2
ba
|
1,454
sqft
|
built
2007
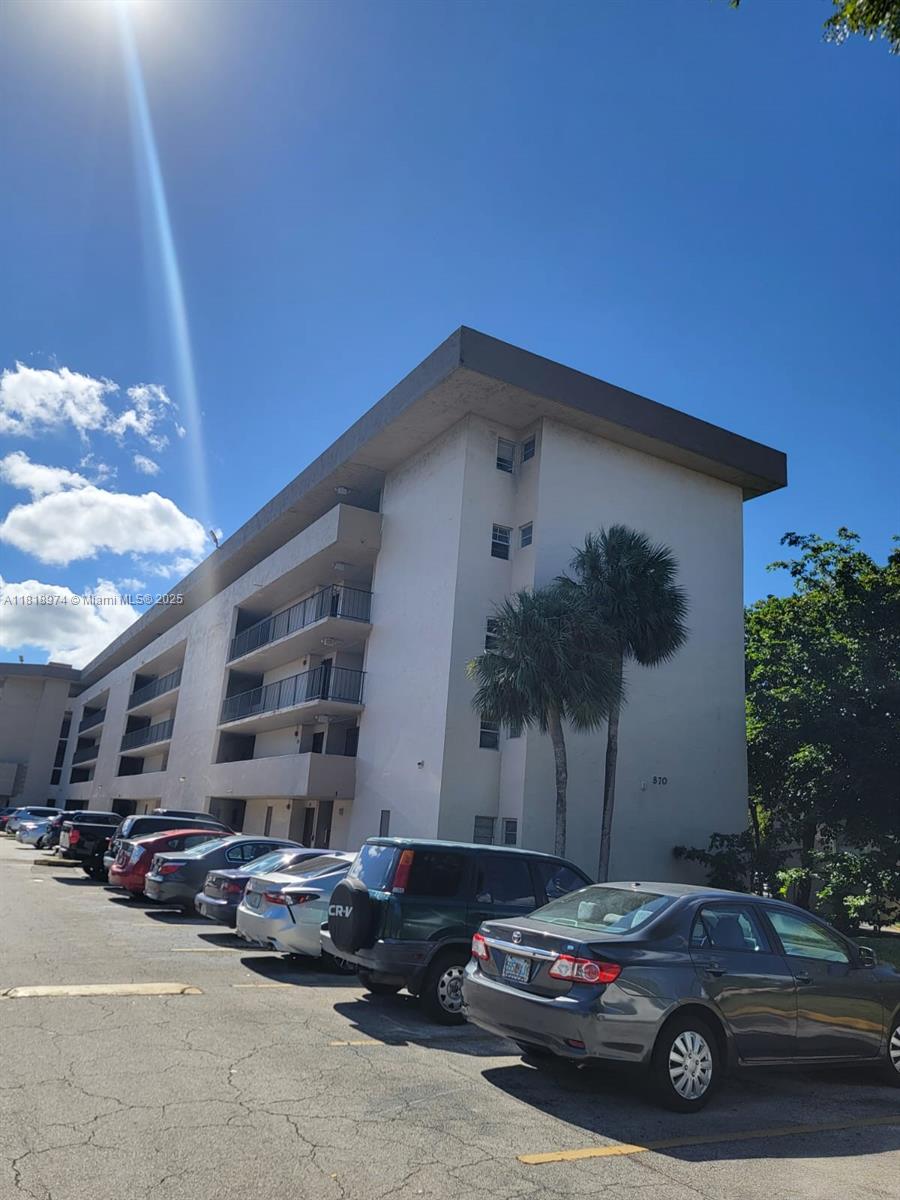
1621 NW 118th St, Miami, FL 33167
$-1,219
Cash flow
-11.6%
Cash-on-Cash Return
3.6%
Cap rate
0.6%
Rent to Value Ratio
Active
$1,800,000
3
bds
|
3
ba
|
1,659
sqft
|
built
2002
801 Brickell Key Blvd, Miami, FL 33131
$-5,746
Cash flow
-16.7%
Cash-on-Cash Return
2.5%
Cap rate
0.5%
Rent to Value Ratio
Active
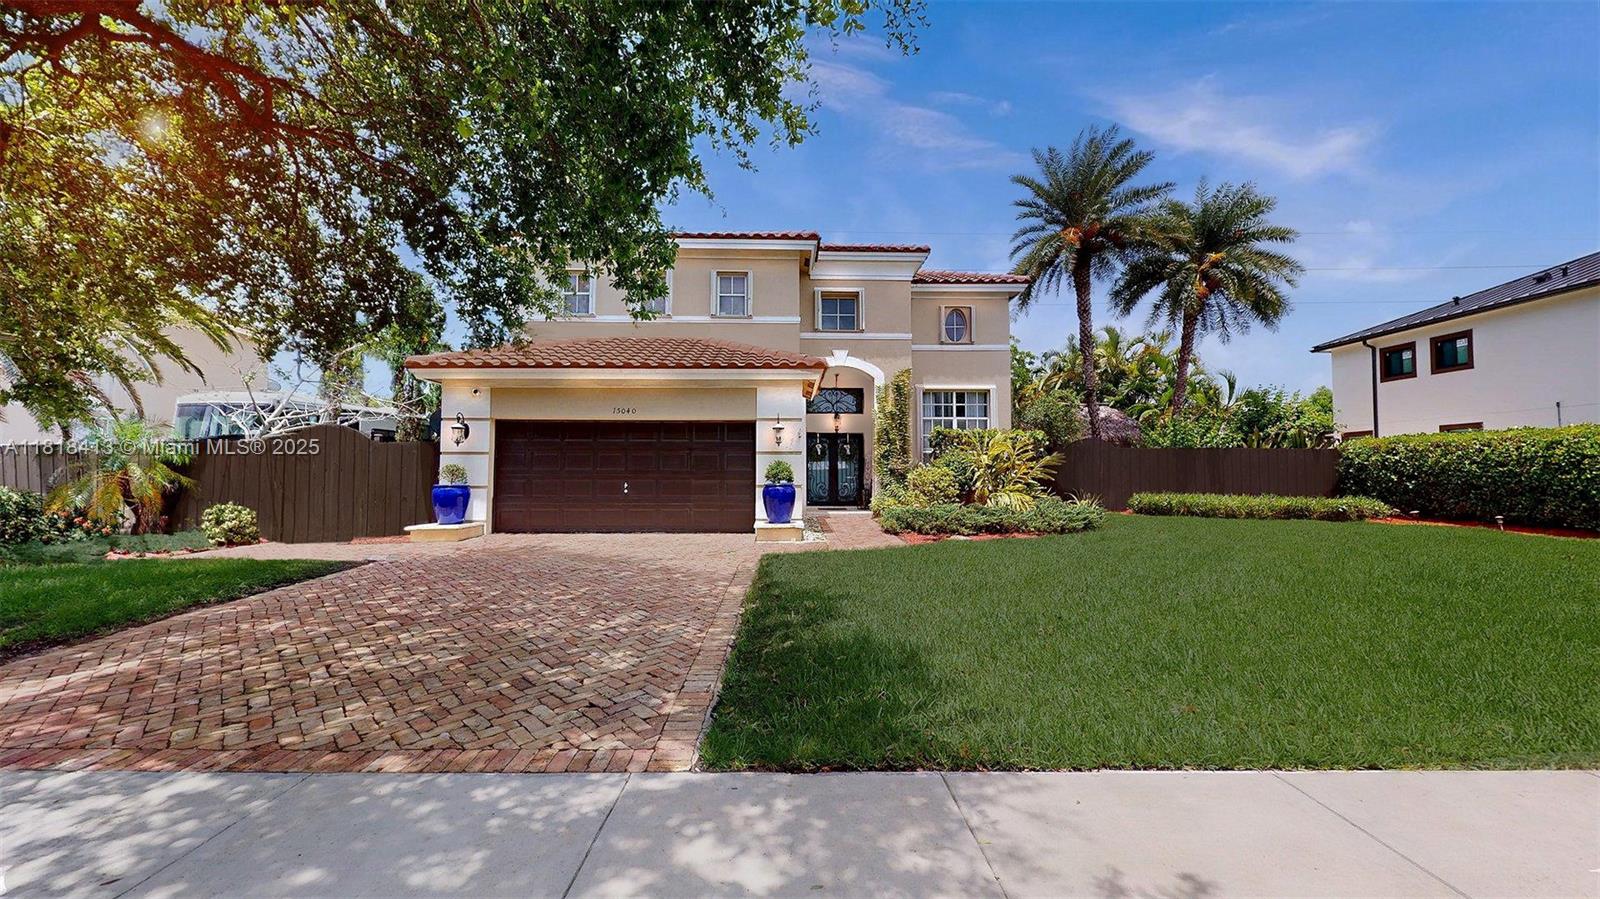
$897,500
5
bds
|
3
ba
|
2,774
sqft
|
built
2000
15040 SW 156th Ave, Miami, FL 33196
$-2,493
Cash flow
-14.5%
Cash-on-Cash Return
3.0%
Cap rate
0.5%
Rent to Value Ratio
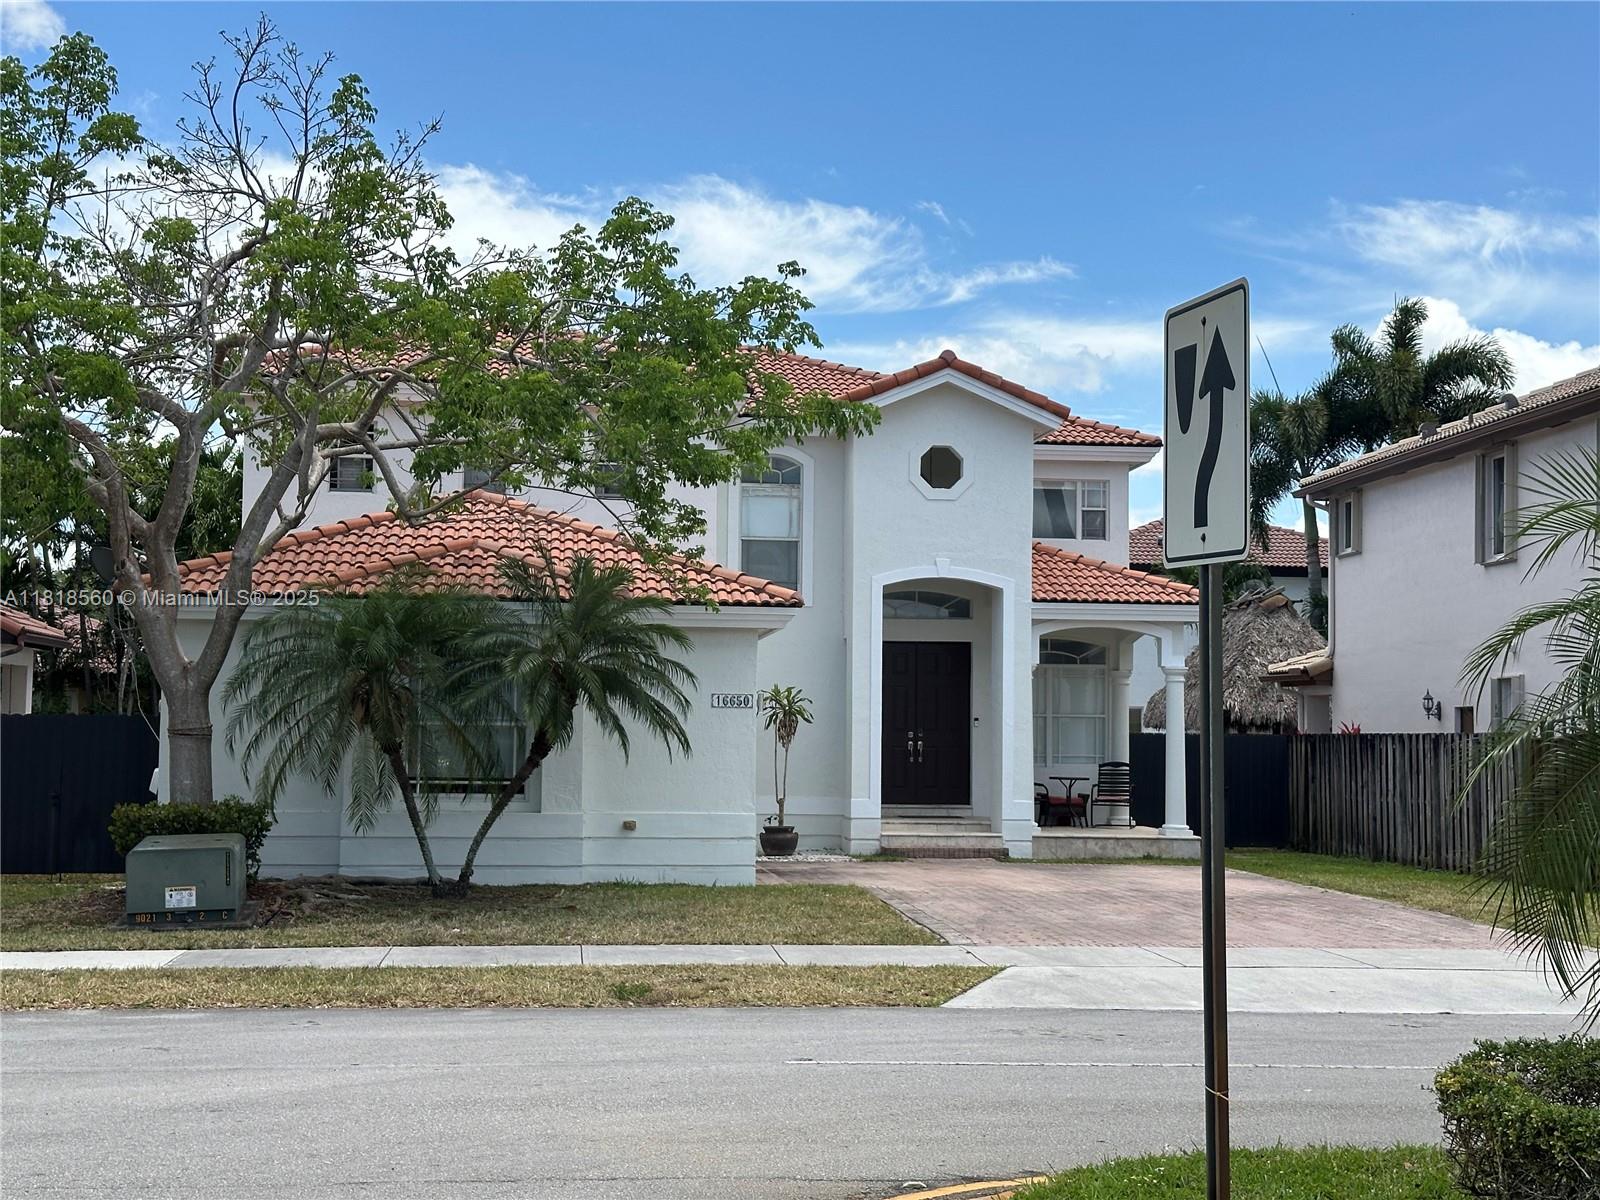
Active
$750,000
3
bds
|
3
ba
|
2,208
sqft
|
built
2004
16650 SW 61st Ln, Miami, FL 33193
$-1,872
Cash flow
-13.0%
Cash-on-Cash Return
3.3%
Cap rate
0.5%
Rent to Value Ratio
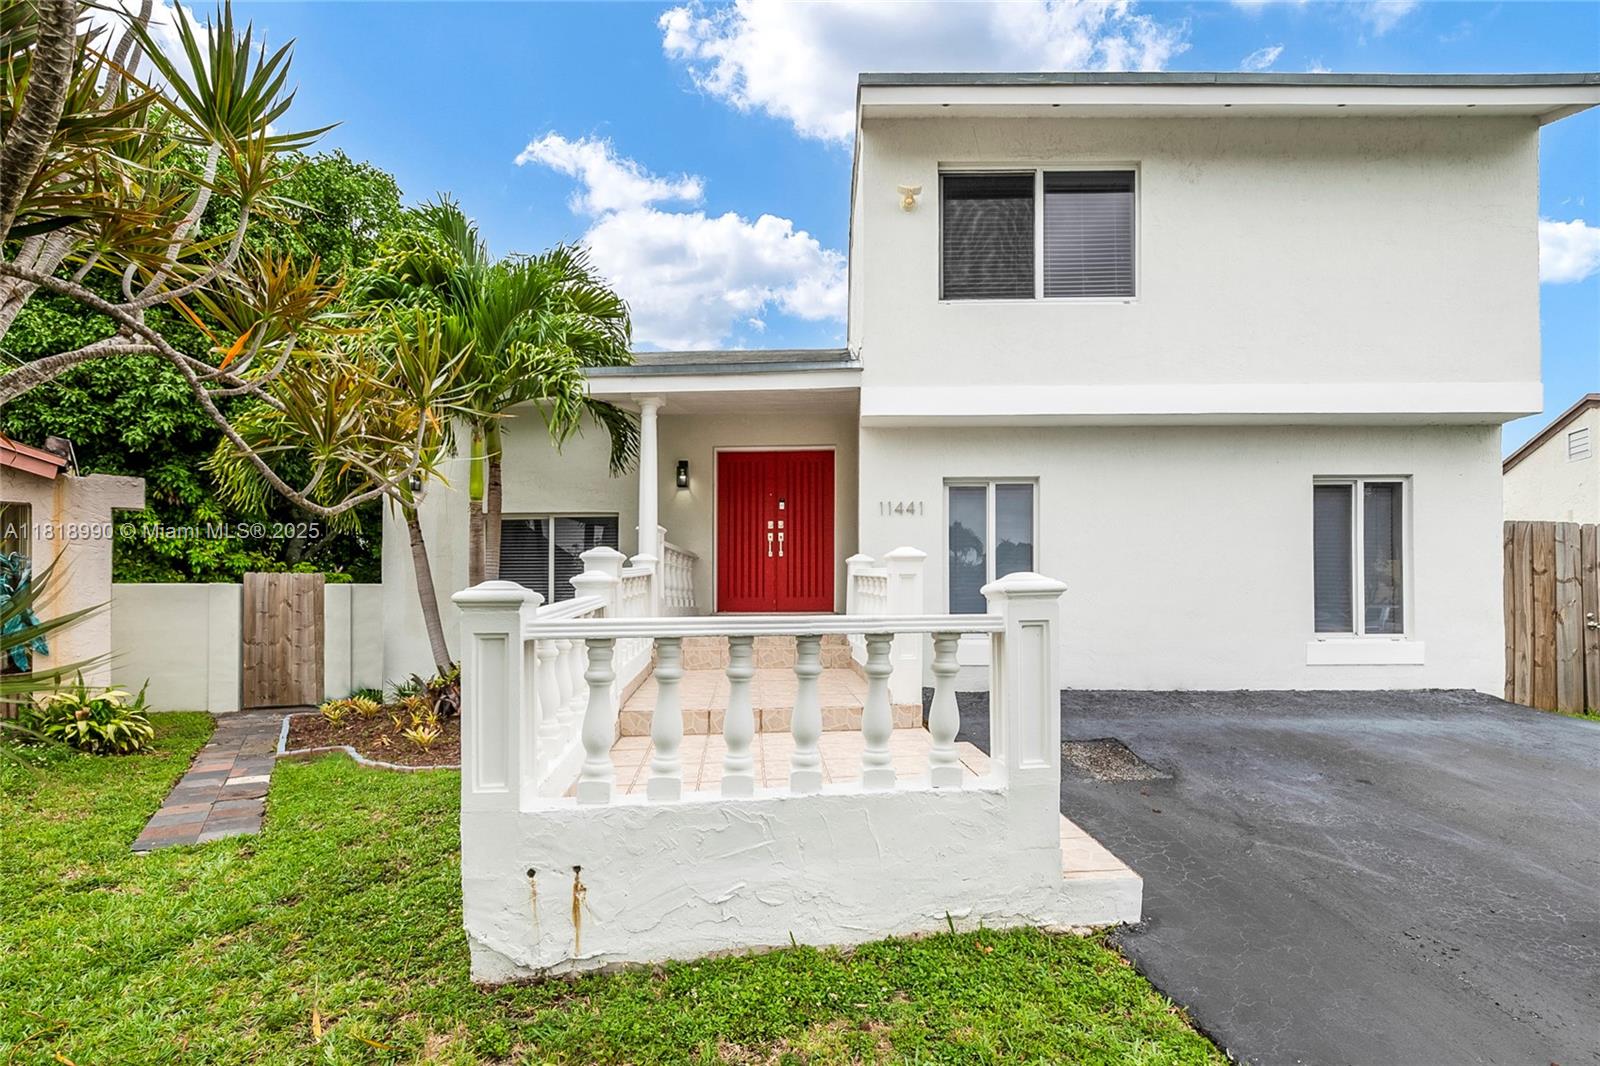
Active
$799,900
4
bds
|
3
ba
|
2,540
sqft
|
built
1980
11441 SW 33rd Ln, Miami, FL 33165
$-1,263
Cash flow
-8.2%
Cash-on-Cash Return
4.4%
Cap rate
0.6%
Rent to Value Ratio
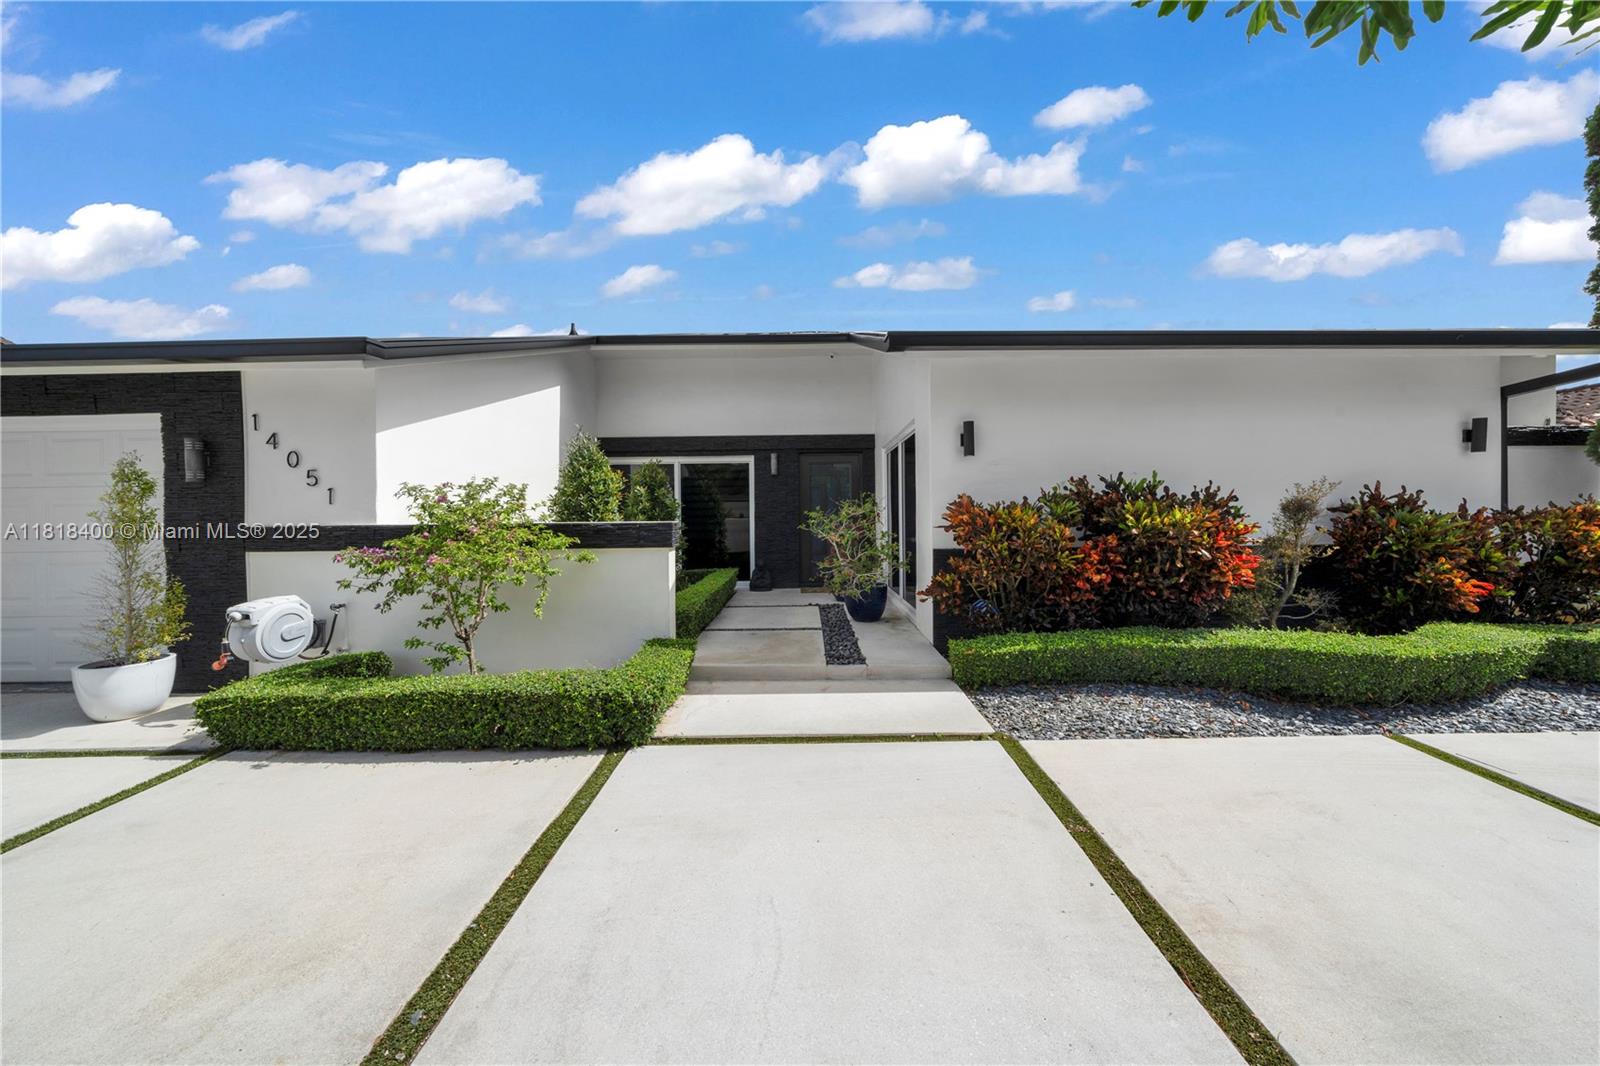
Active
$799,000
3
bds
|
2
ba
|
1,770
sqft
|
built
1979
14051 SW 48th St, Miami, FL 33175
$-1,397
Cash flow
-9.1%
Cash-on-Cash Return
4.2%
Cap rate
0.6%
Rent to Value Ratio
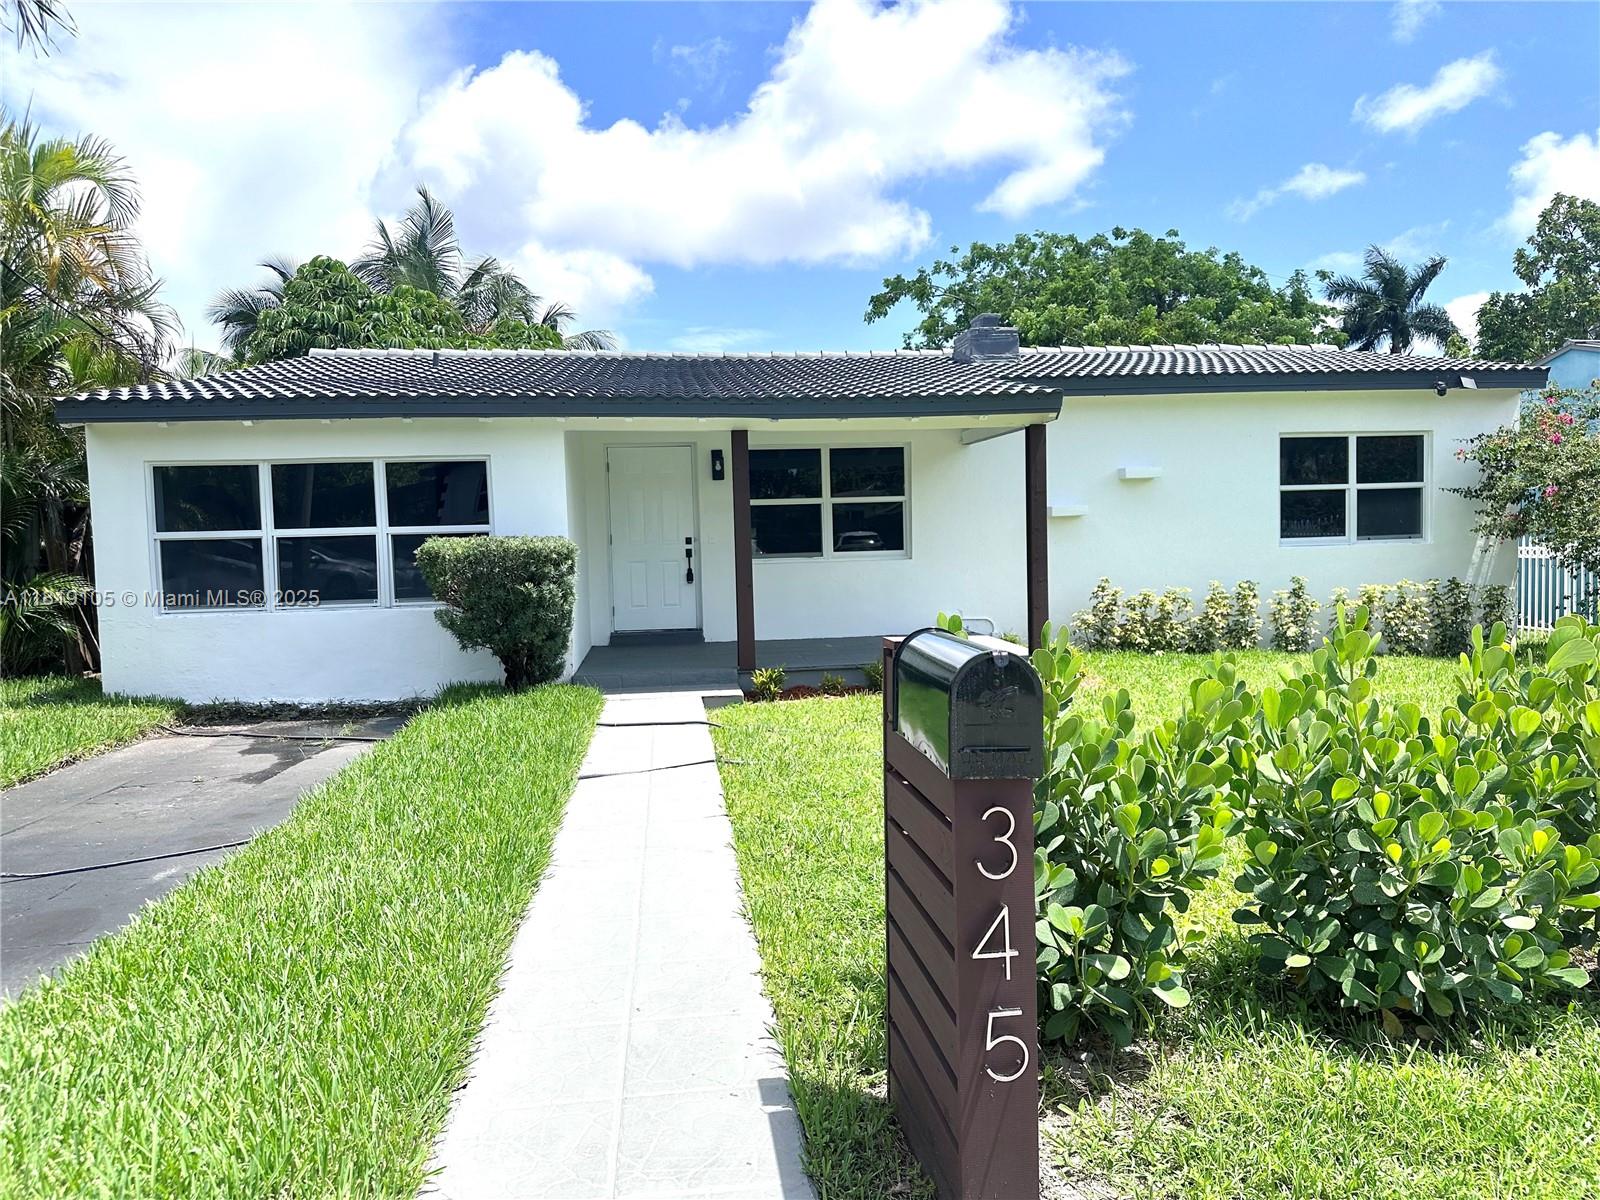
Active
$749,000
3
bds
|
2
ba
|
1,284
sqft
|
built
1952
345 NE 112th St, Miami, FL 33161
$-1,882
Cash flow
-13.1%
Cash-on-Cash Return
3.3%
Cap rate
0.5%
Rent to Value Ratio
Active
$650,000
4
bds
|
2
ba
|
1,674
sqft
|
built
1968
1330 North Dr, Miami, FL 33179
$-1,285
Cash flow
-10.3%
Cash-on-Cash Return
3.9%
Cap rate
0.6%
Rent to Value Ratio
Pending
$410,000
3
bds
|
1
ba
|
1,008
sqft
|
built
1954
1950 NW 57th St, Miami, FL 33142
$-501
Cash flow
-6.4%
Cash-on-Cash Return
4.8%
Cap rate
0.7%
Rent to Value Ratio