Miami, FL Investment Properties for Sale
Browse homes for sale and investment properties in Miami, FL. Refine your search by price, property type, or more.
Best cash flowing properties in Miami, FL
Active
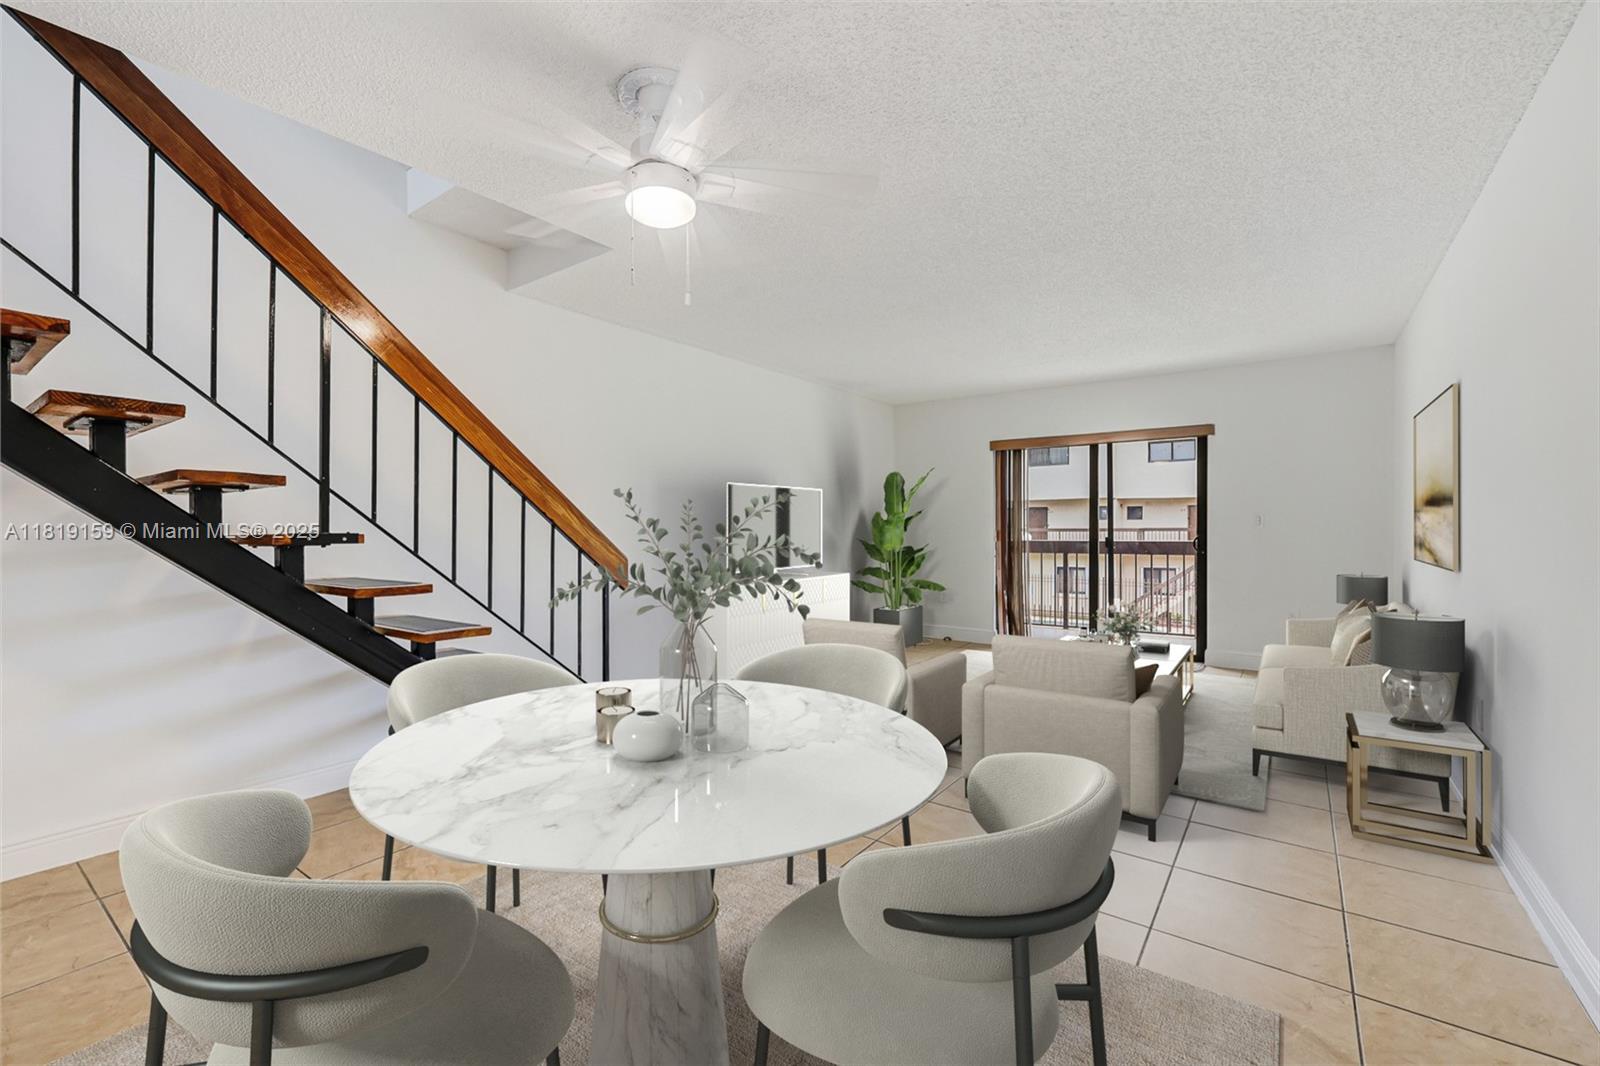
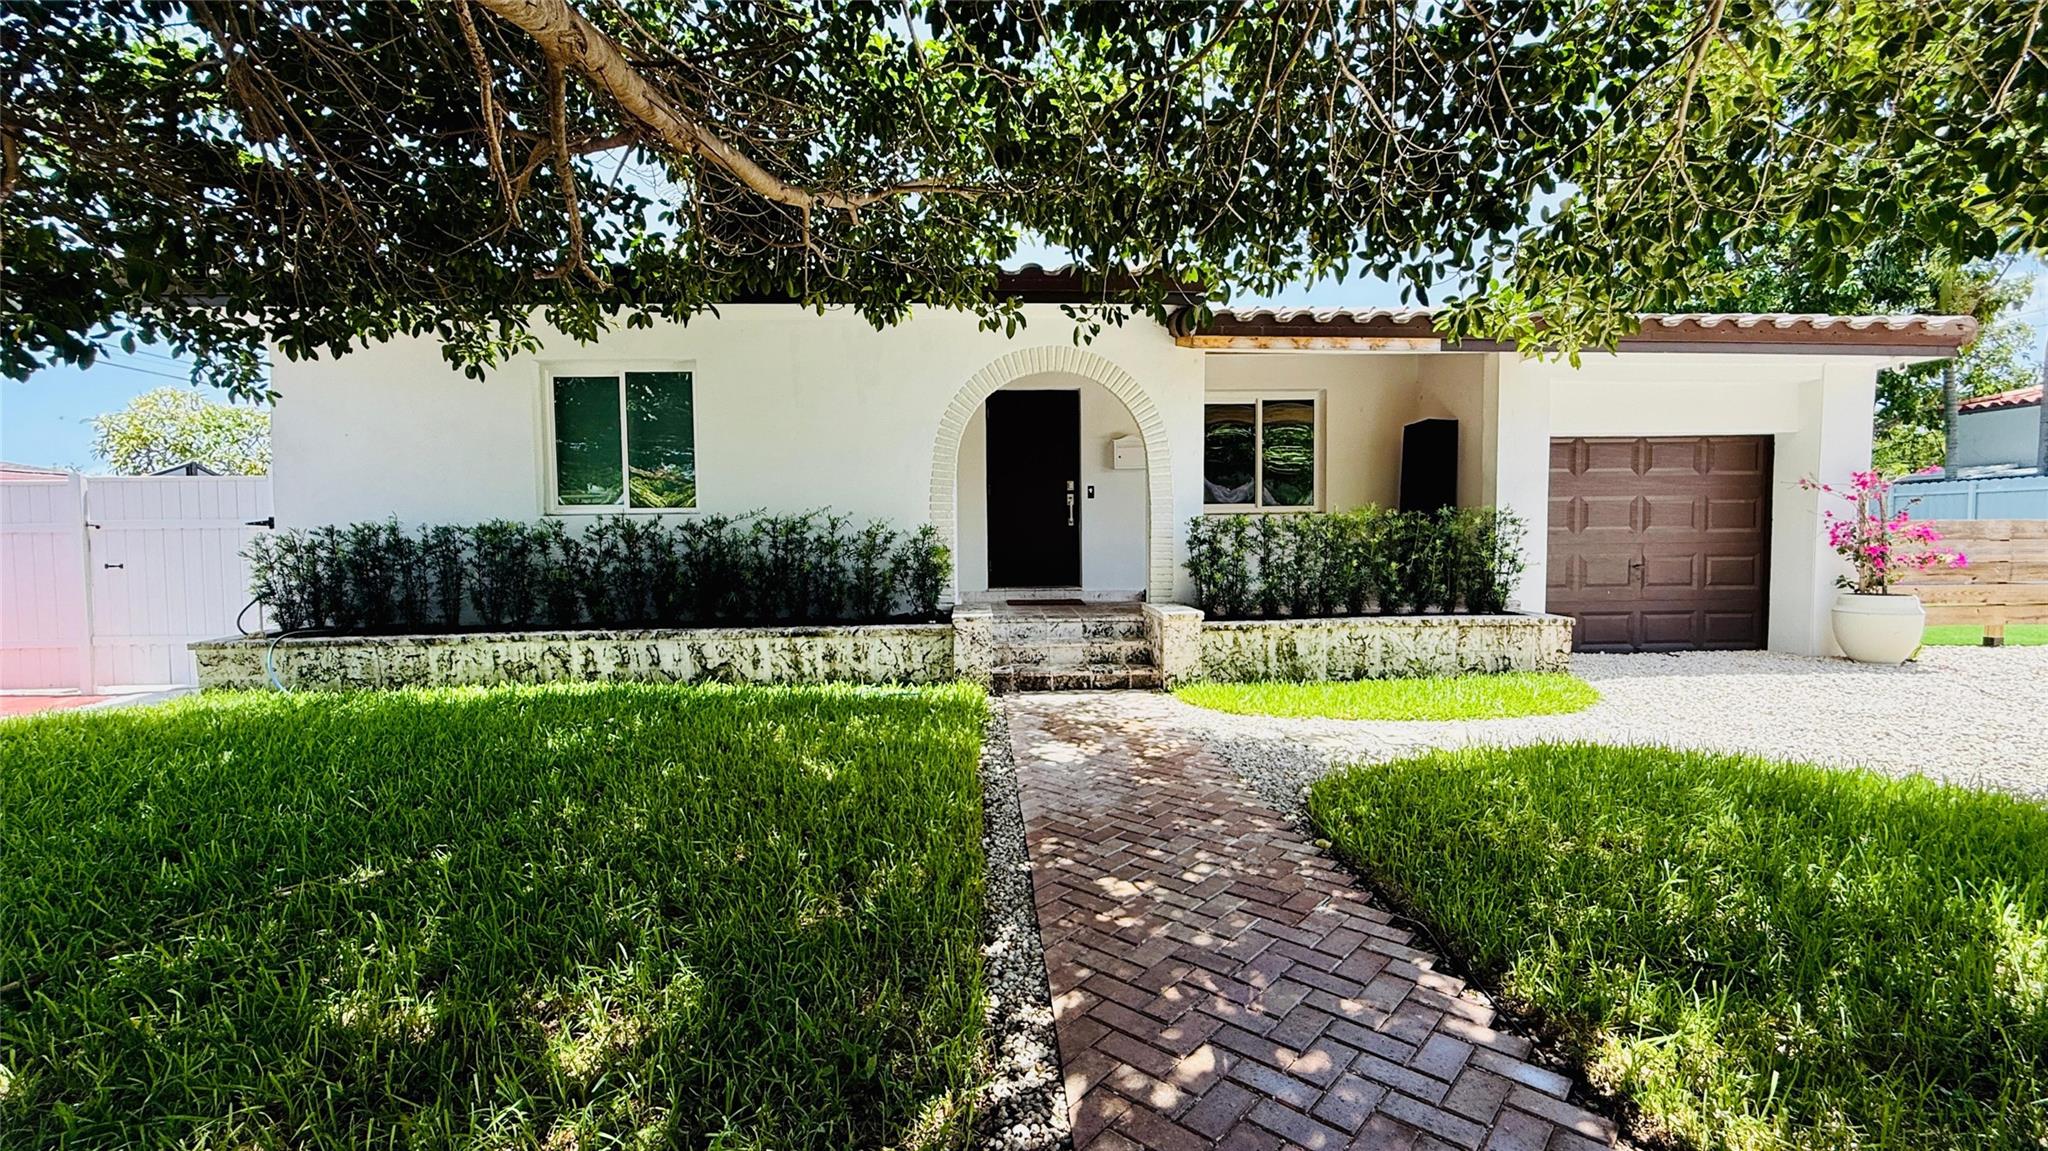
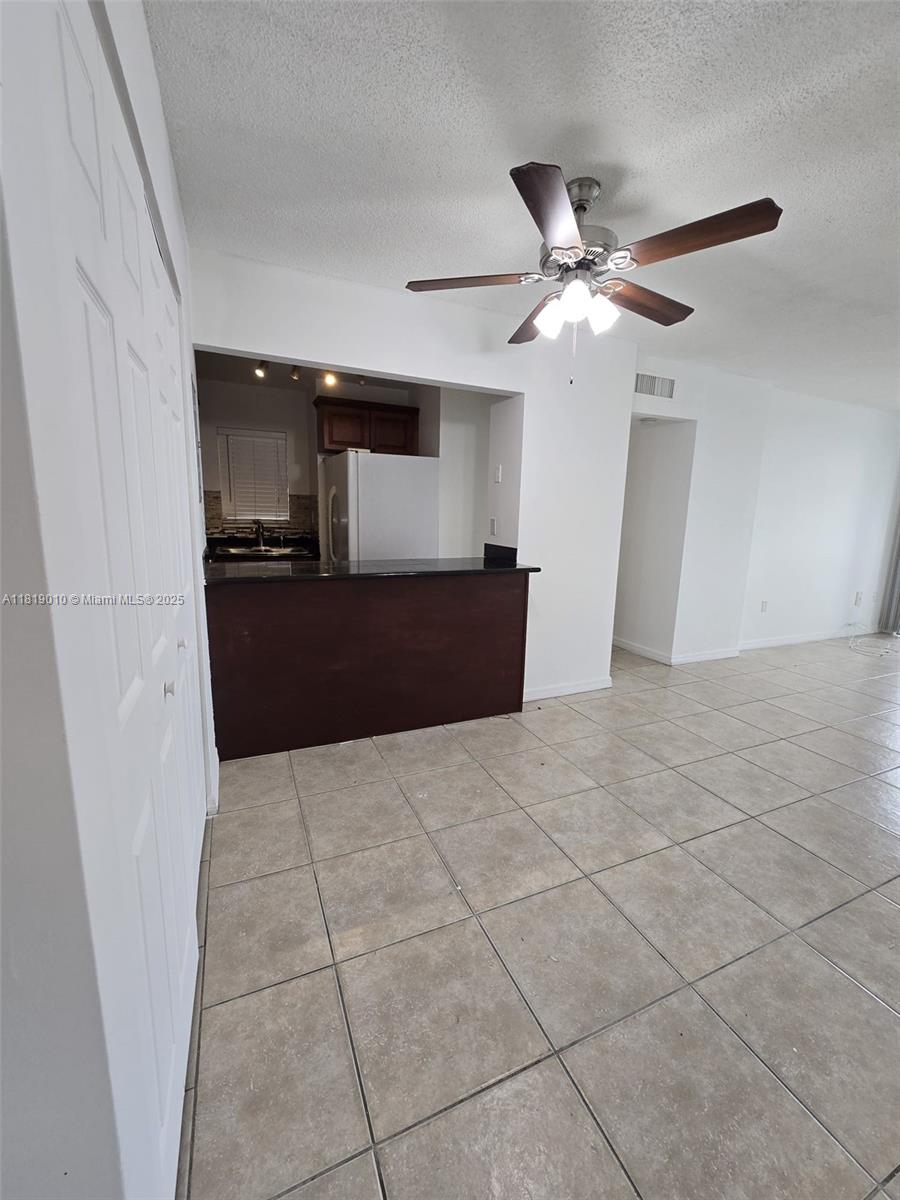
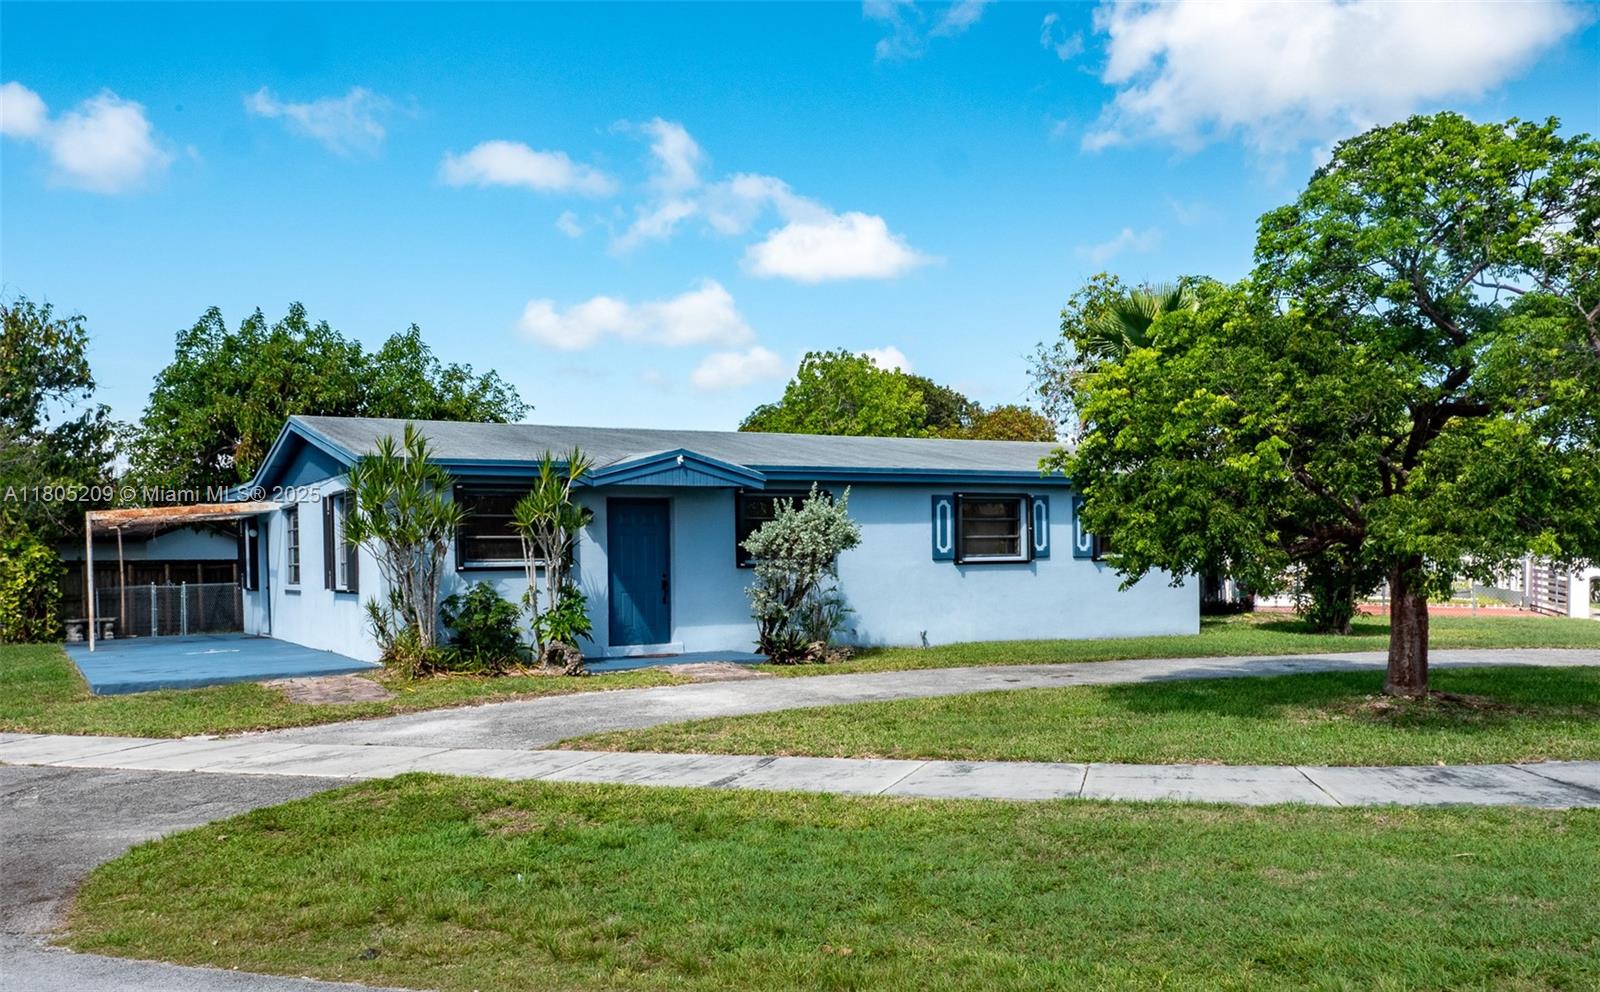
$300,000
2
bds
|
3
ba
|
1,045
sqft
|
built
1979
1121 SW 105th Ave, Miami, FL 33174
$-353
Cash flow
-6.1%
Cash-on-Cash Return
4.9%
Cap rate
0.8%
Rent to Value Ratio
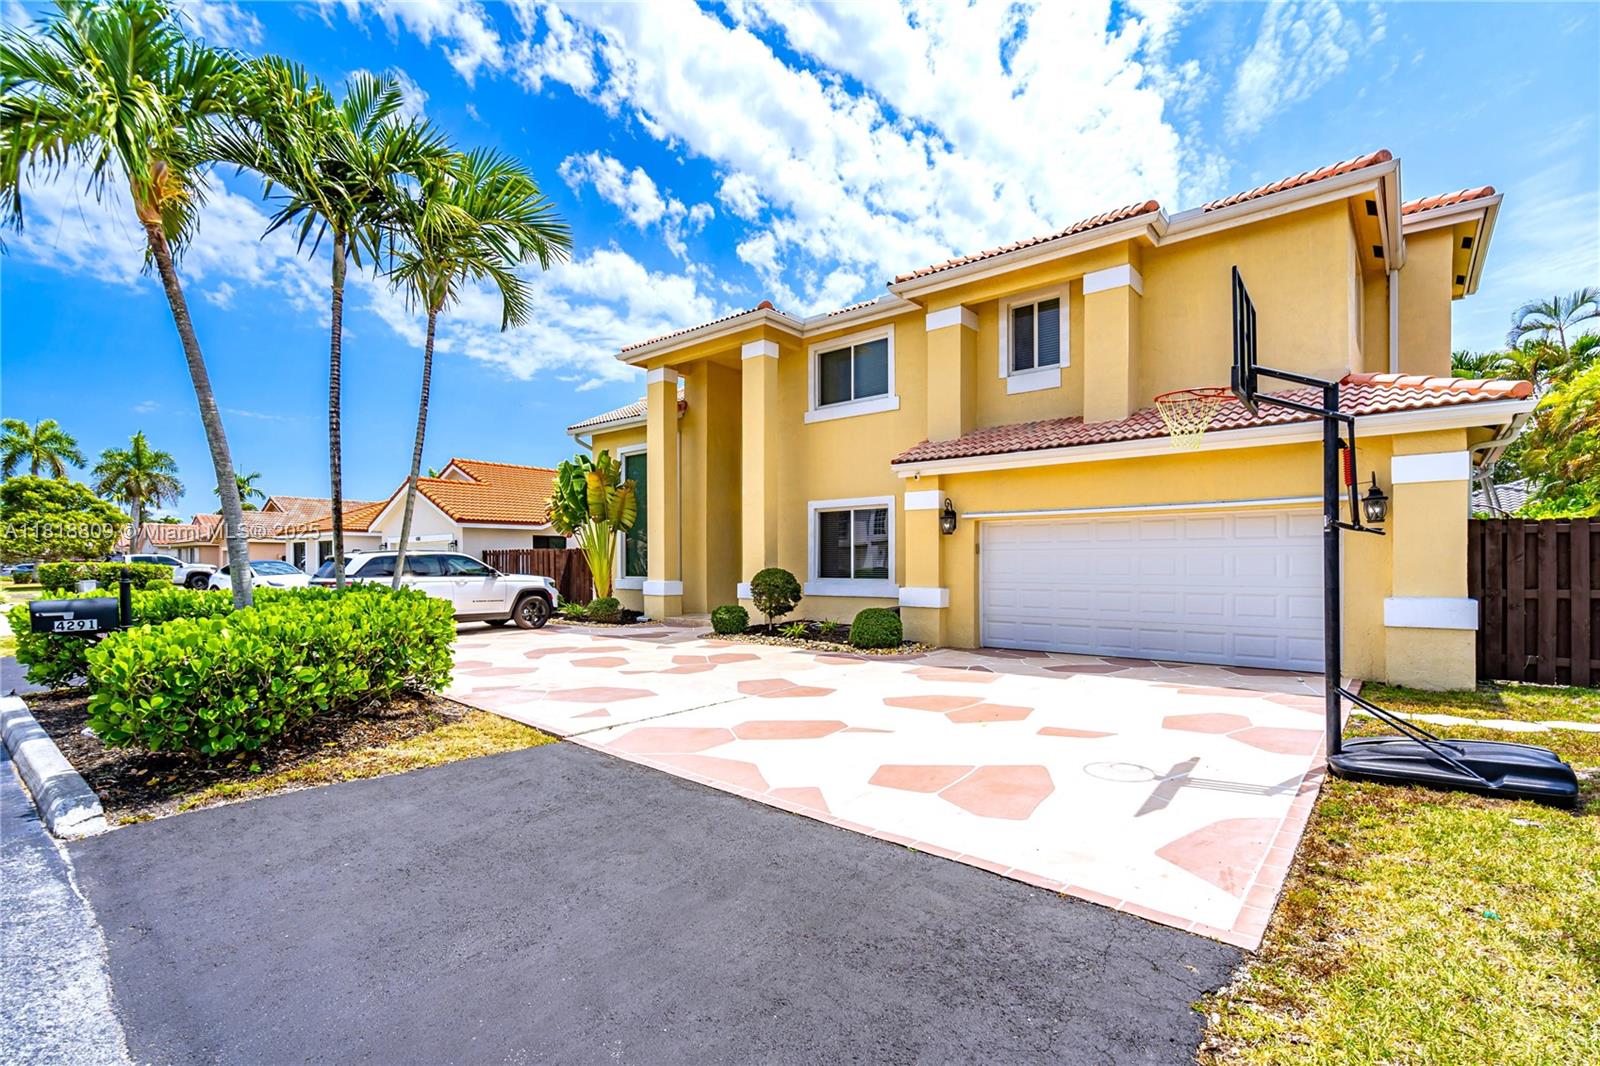
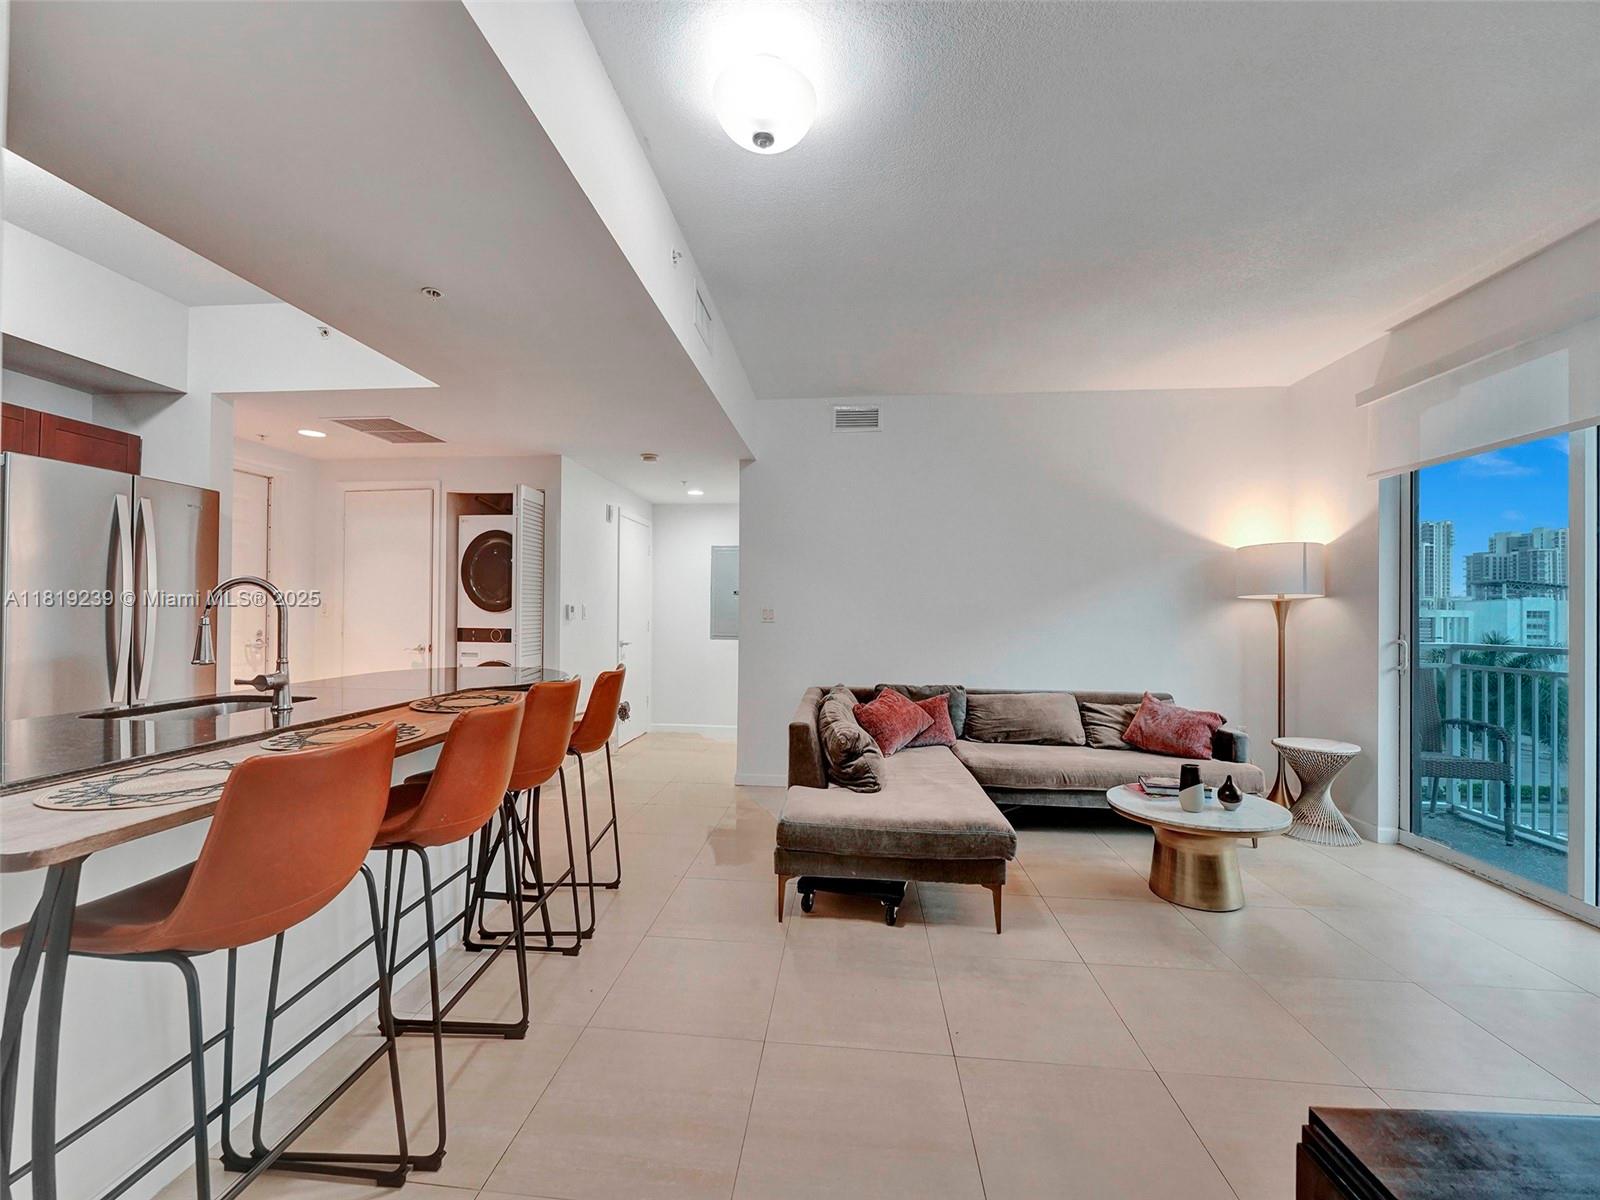
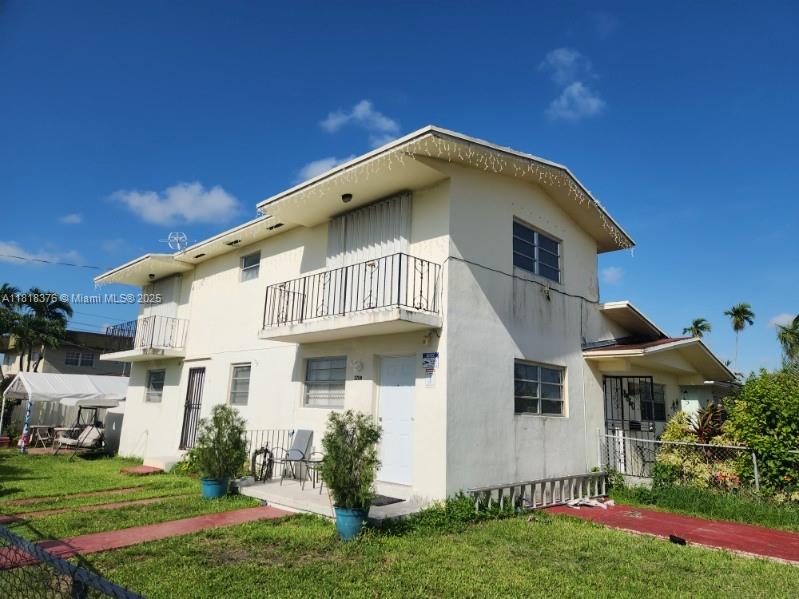
Active
$1,020,000
5
bds
|
4
ba
|
3,383
sqft
|
built
1995
4291 SW 154th Pl, Miami, FL 33185
$-484
Cash flow
-2.5%
Cash-on-Cash Return
5.7%
Cap rate
0.8%
Rent to Value Ratio
6,349 out of 7,208 properties for sale in Miami, FL
Limited Results Shown
Create a free account, or log in to reveal all property listings and enjoy the complete experience.
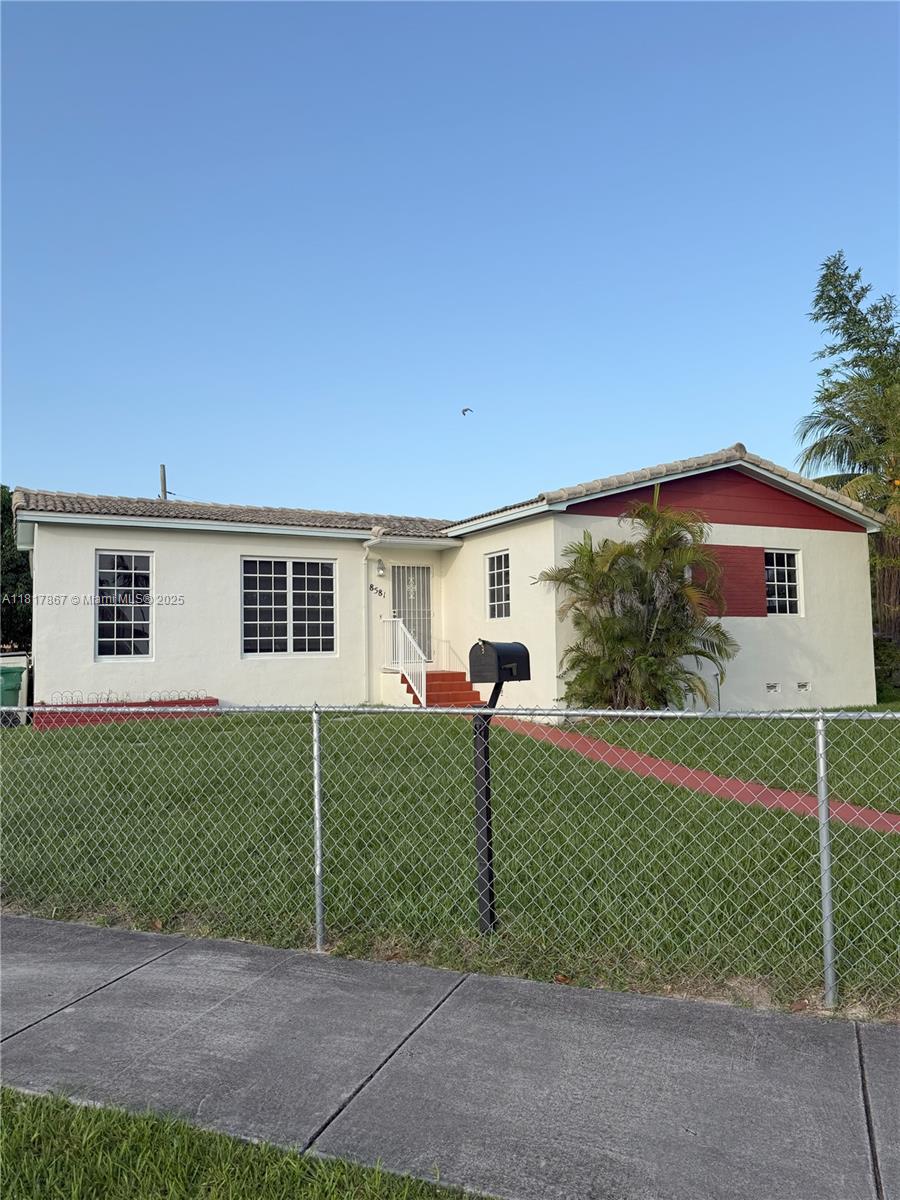
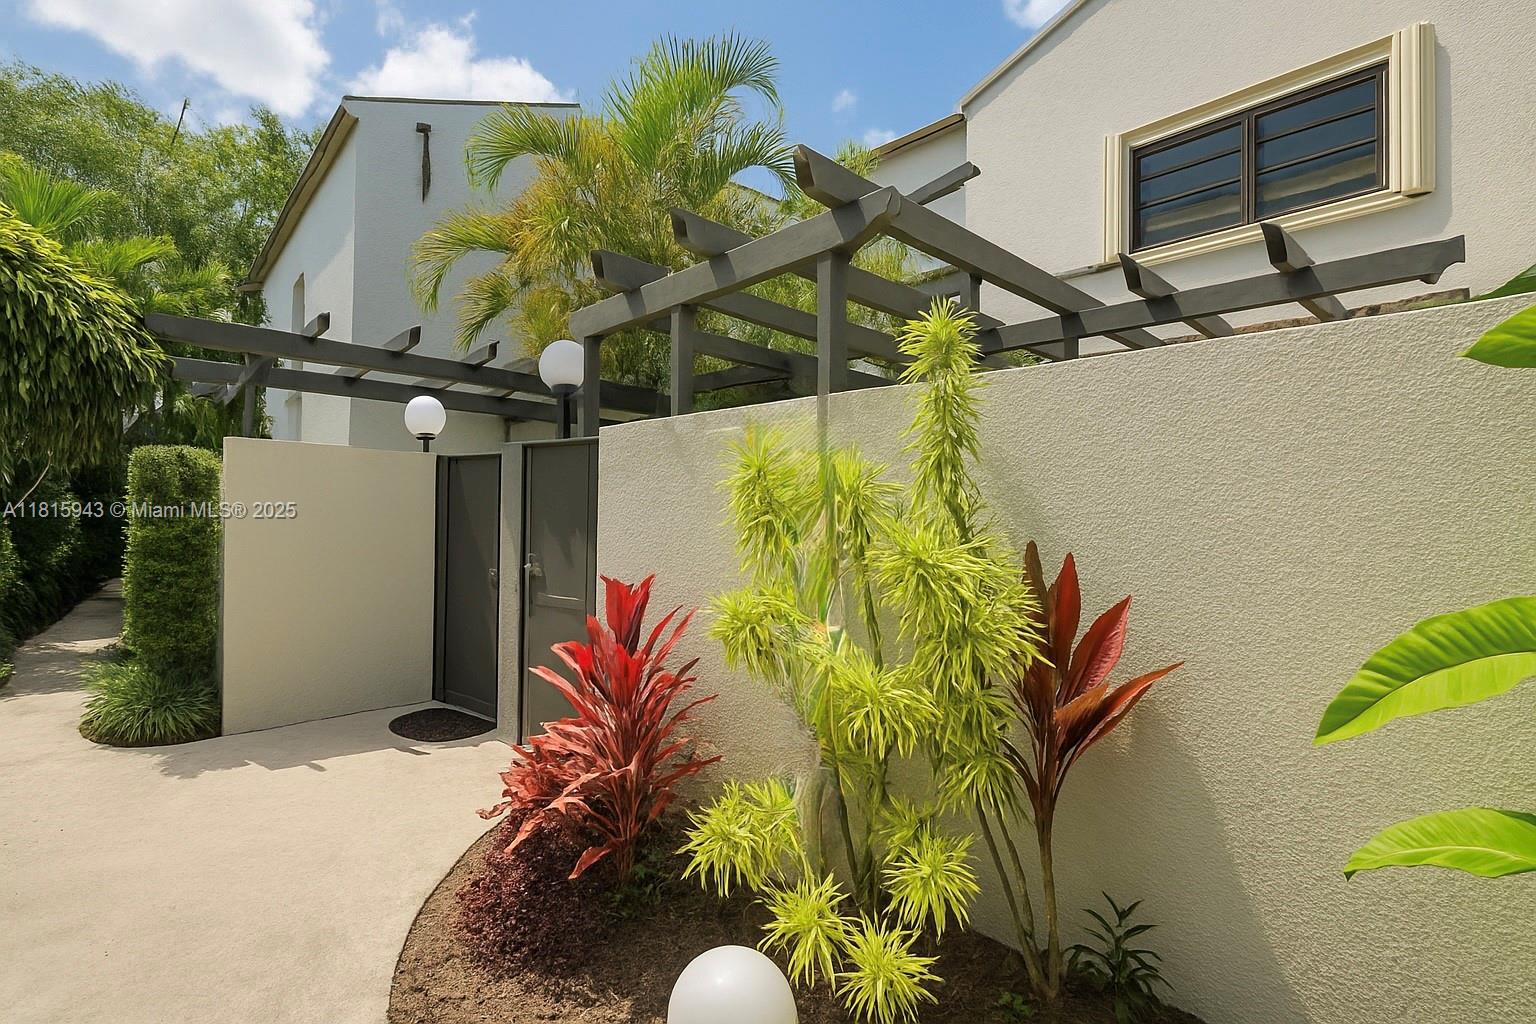
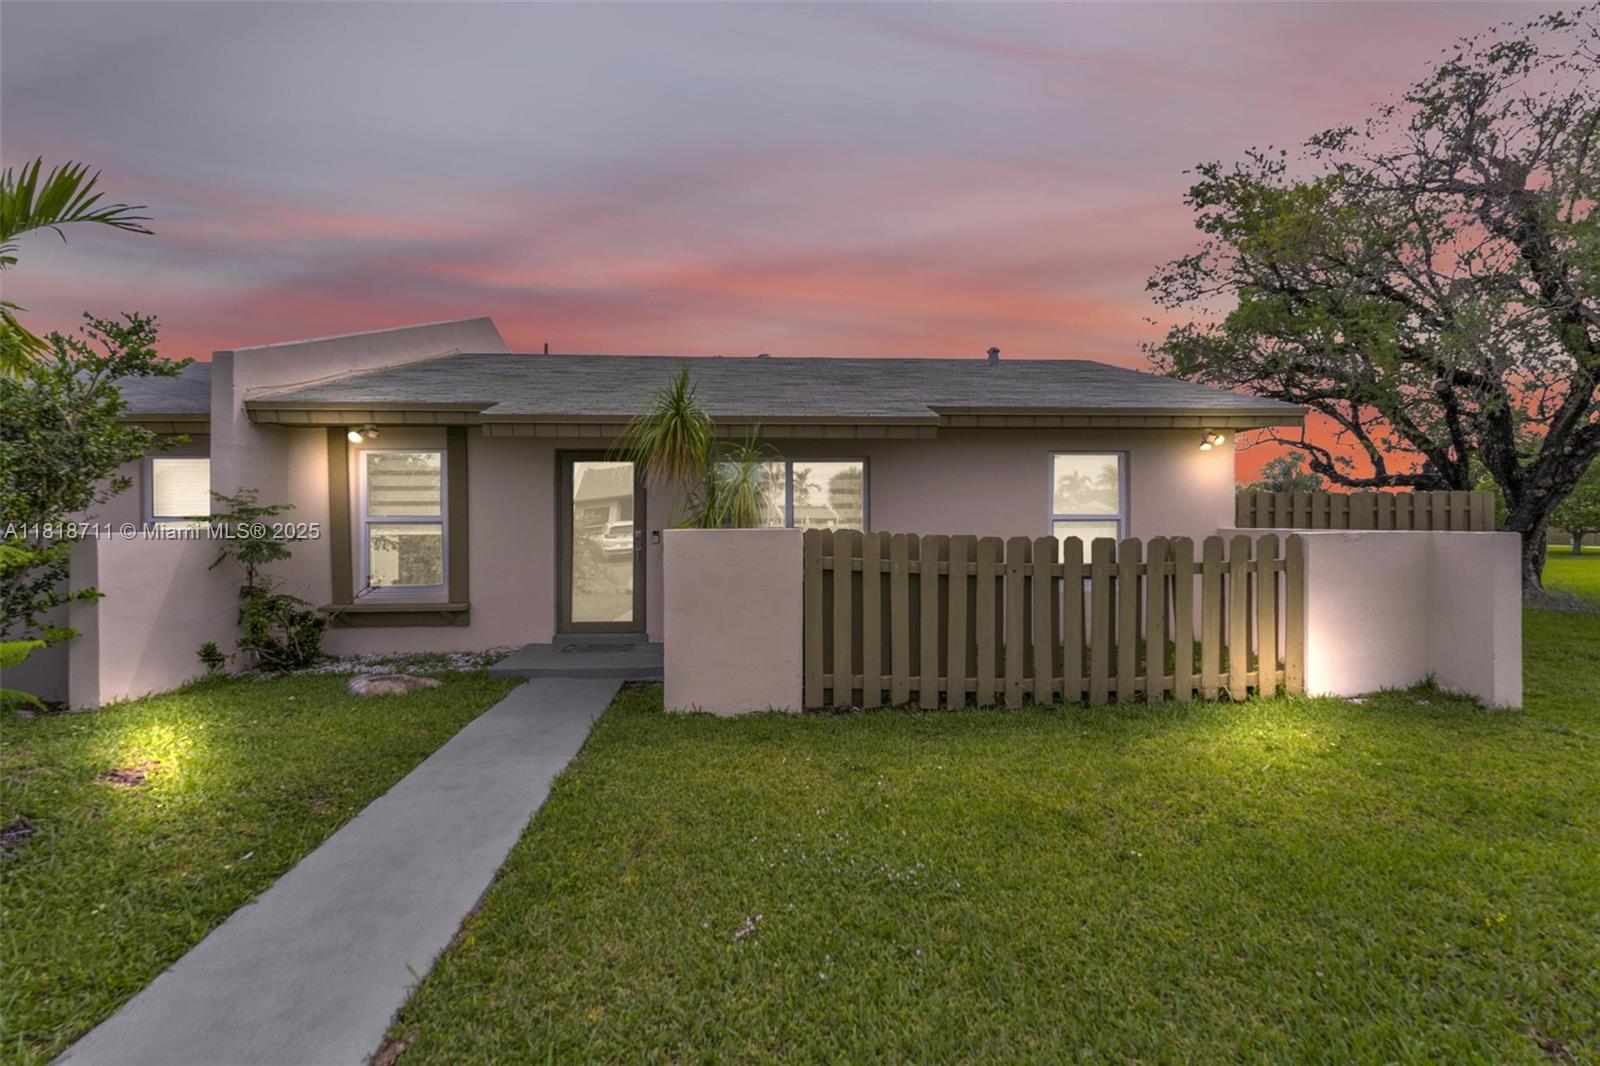
Active
$700,000
3
bds
|
2
ba
|
1,375
sqft
|
built
1956
8581 SW 36th St, Miami, FL 33155
$-2,051
Cash flow
-15.3%
Cash-on-Cash Return
2.8%
Cap rate
0.5%
Rent to Value Ratio
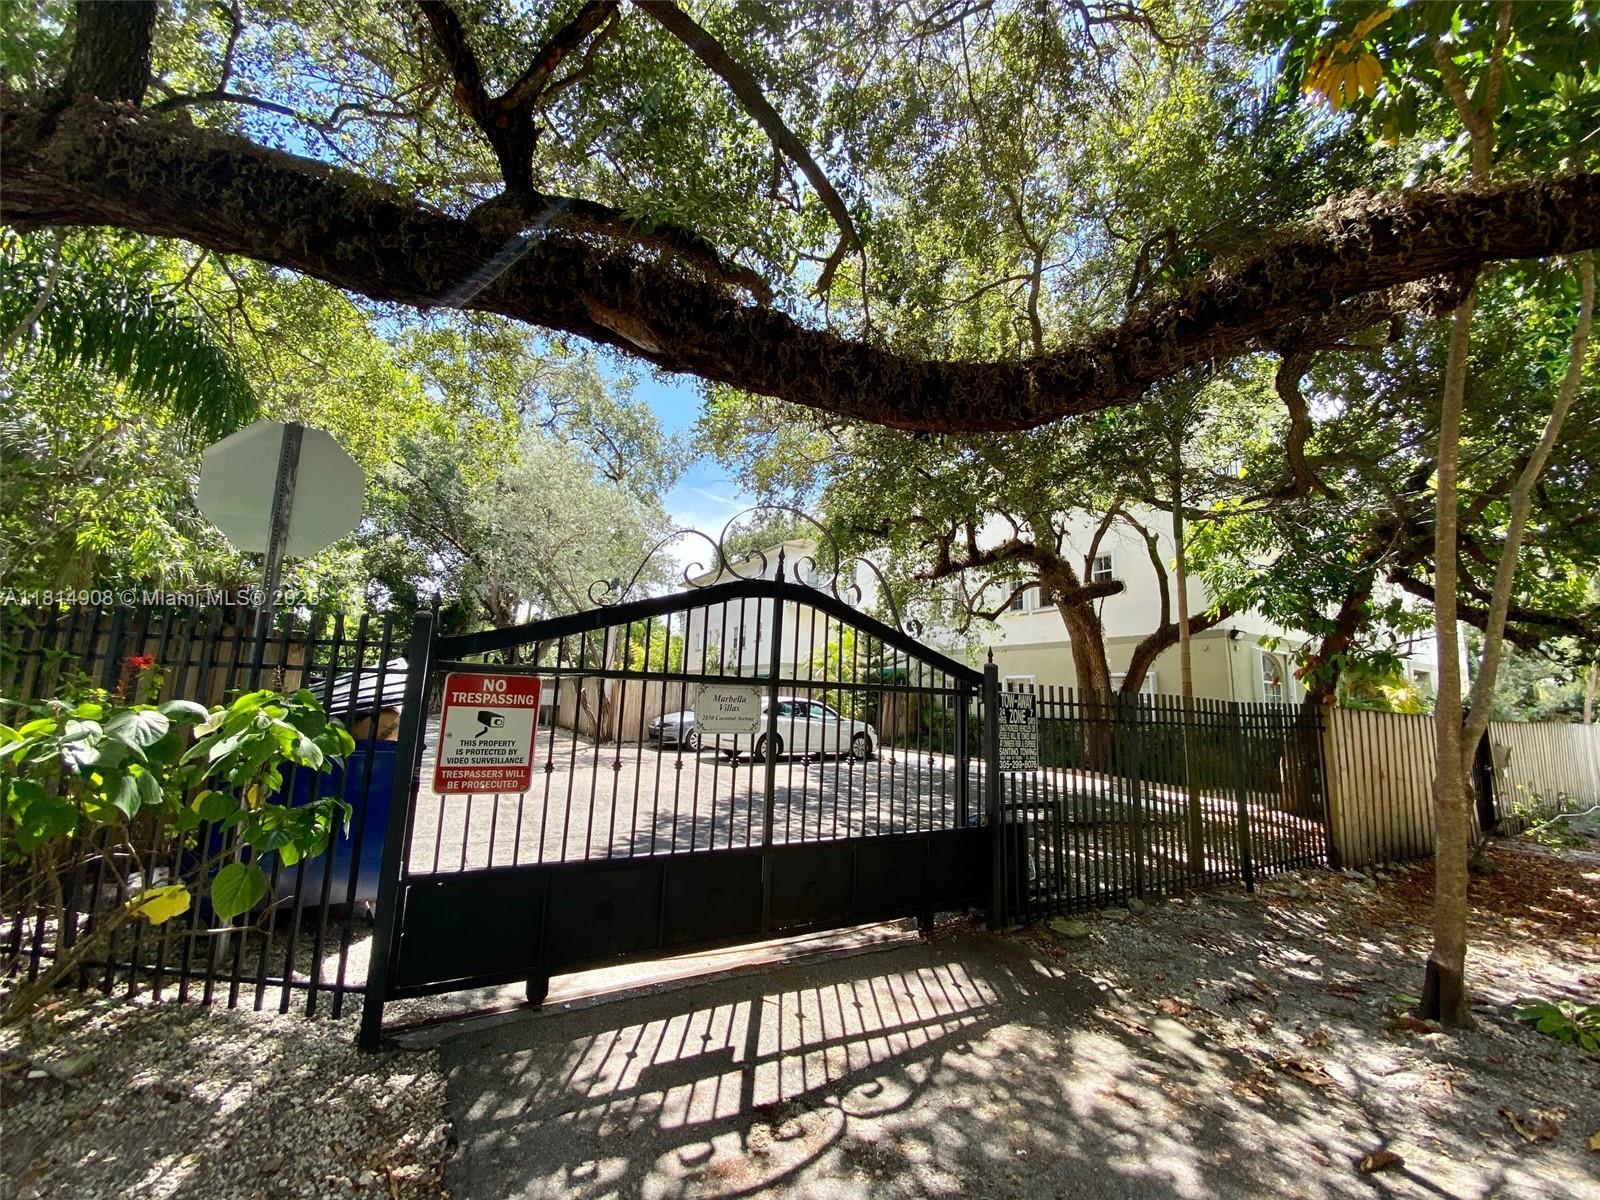
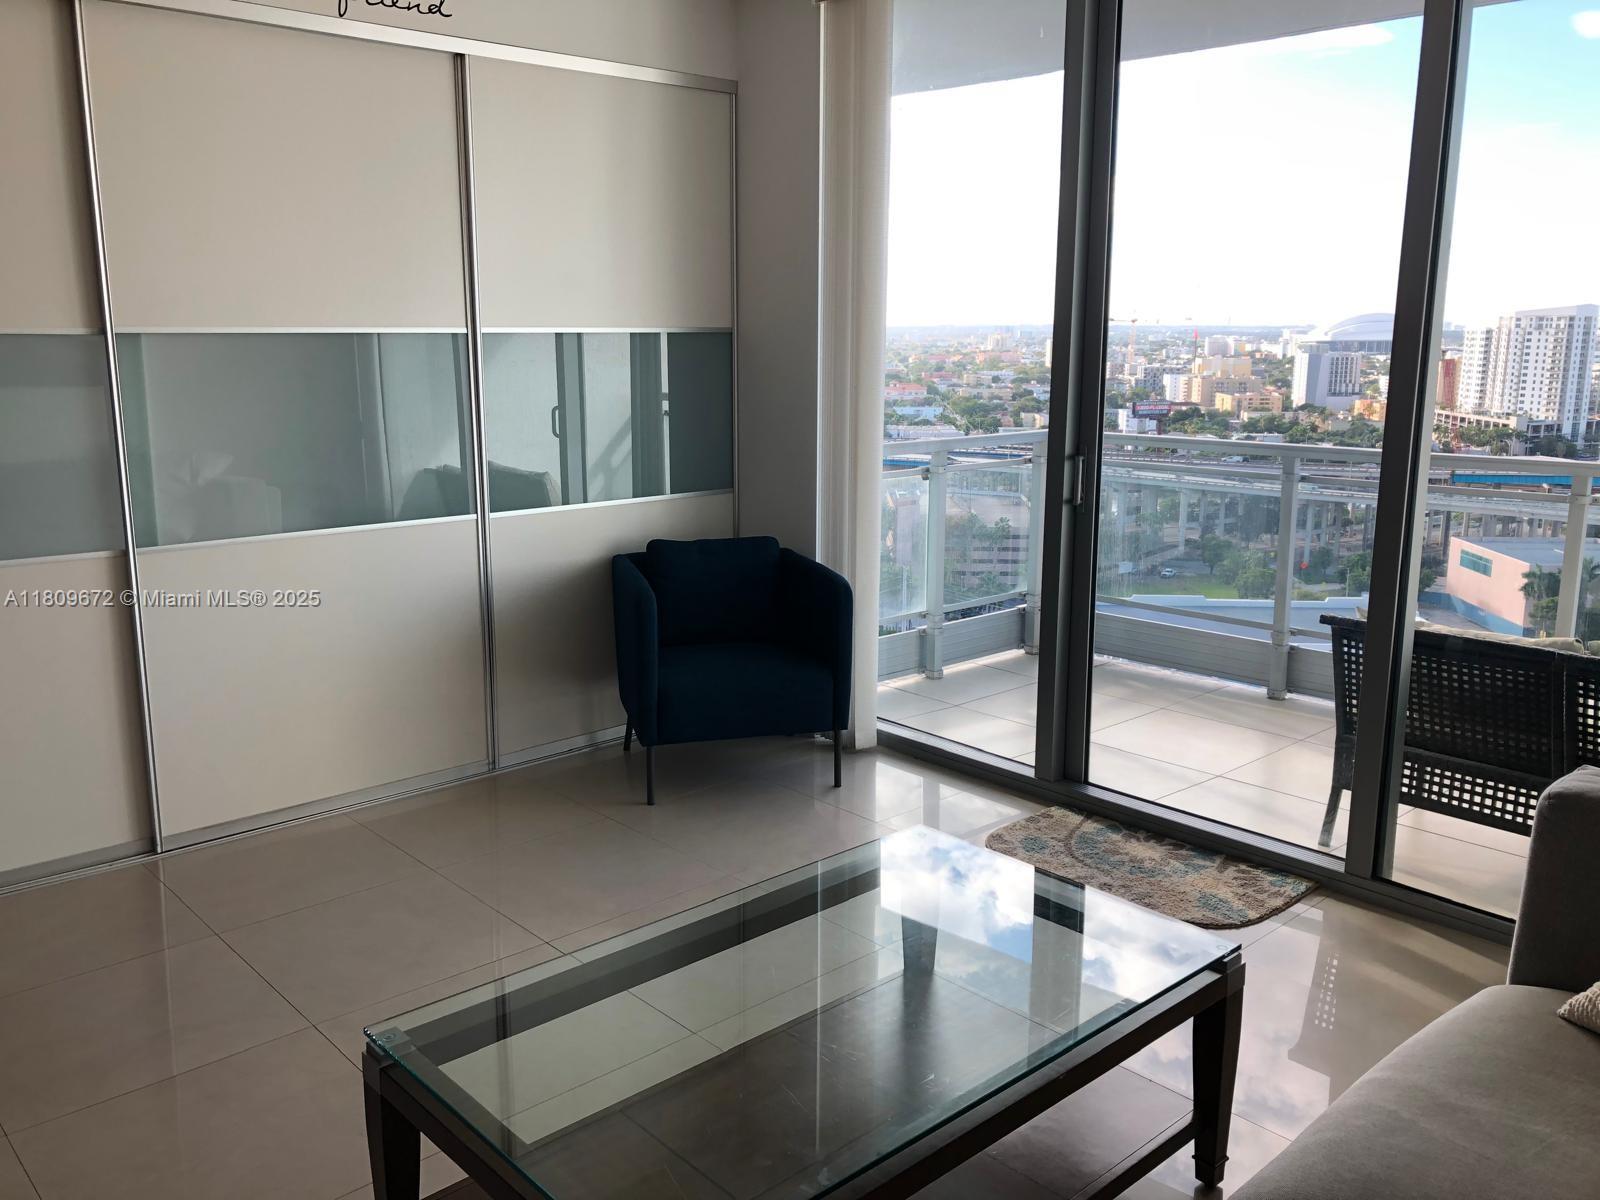
Active
$393,955
1
bds
|
1
ba
|
580
sqft
|
built
1998
2850 Coconut Ave, Miami, FL 33133
$-1,206
Cash flow
-16.0%
Cash-on-Cash Return
2.6%
Cap rate
0.6%
Rent to Value Ratio
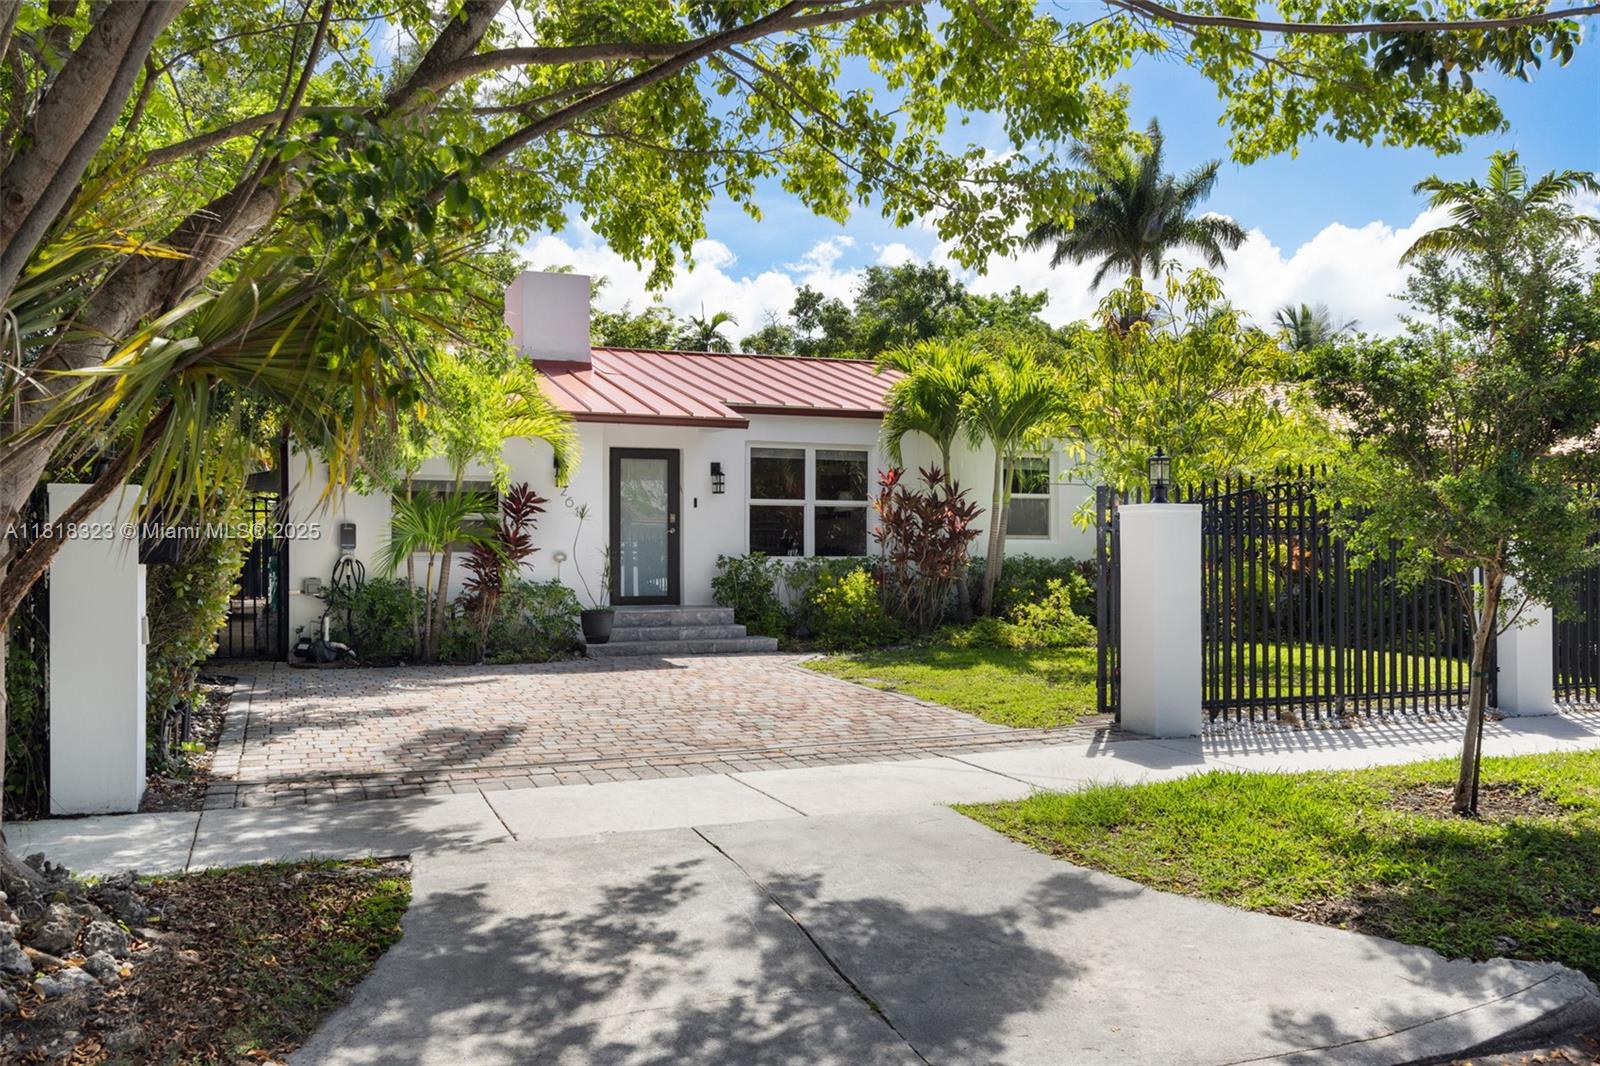
Active
$915,000
4
bds
|
3
ba
|
1,934
sqft
|
built
1947
6820 SW 32nd St, Miami, FL 33155
$-2,805
Cash flow
-16.0%
Cash-on-Cash Return
2.6%
Cap rate
0.4%
Rent to Value Ratio

Active
$450,000
2
bds
|
3
ba
|
1,375
sqft
|
built
1984
5975 SW 137th Ave, Miami, FL 33183
$-1,335
Cash flow
-15.5%
Cash-on-Cash Return
2.7%
Cap rate
0.6%
Rent to Value Ratio
Active
$410,000
2
bds
|
2
ba
|
1,114
sqft
|
built
2006
7270 N Kendall Dr, Miami, FL 33156
$-1,420
Cash flow
-18.1%
Cash-on-Cash Return
2.1%
Cap rate
0.7%
Rent to Value Ratio
Active
$585,000
3
bds
|
3
ba
|
1,349
sqft
|
built
1979
4700 SW 67th Ave, Miami, FL 33155
$-1,939
Cash flow
-17.3%
Cash-on-Cash Return
2.3%
Cap rate
0.5%
Rent to Value Ratio
Active
$420,000
1
bds
|
1
ba
|
747
sqft
|
built
2008
90 SW 3rd St, Miami, FL 33130
$-1,574
Cash flow
-19.6%
Cash-on-Cash Return
1.8%
Cap rate
0.7%
Rent to Value Ratio
Active
$385,000
0
bds
|
1
ba
|
580
sqft
|
built
2018
1600 NE 1st Ave, Miami, FL 33132
$-573
Cash flow
-7.8%
Cash-on-Cash Return
4.5%
Cap rate
0.8%
Rent to Value Ratio
Active
$789,000
4
bds
|
3
ba
|
3,060
sqft
|
built
1978
11537 SW 34th Ln, Miami, FL 33165
$-1,735
Cash flow
-11.5%
Cash-on-Cash Return
3.7%
Cap rate
0.5%
Rent to Value Ratio
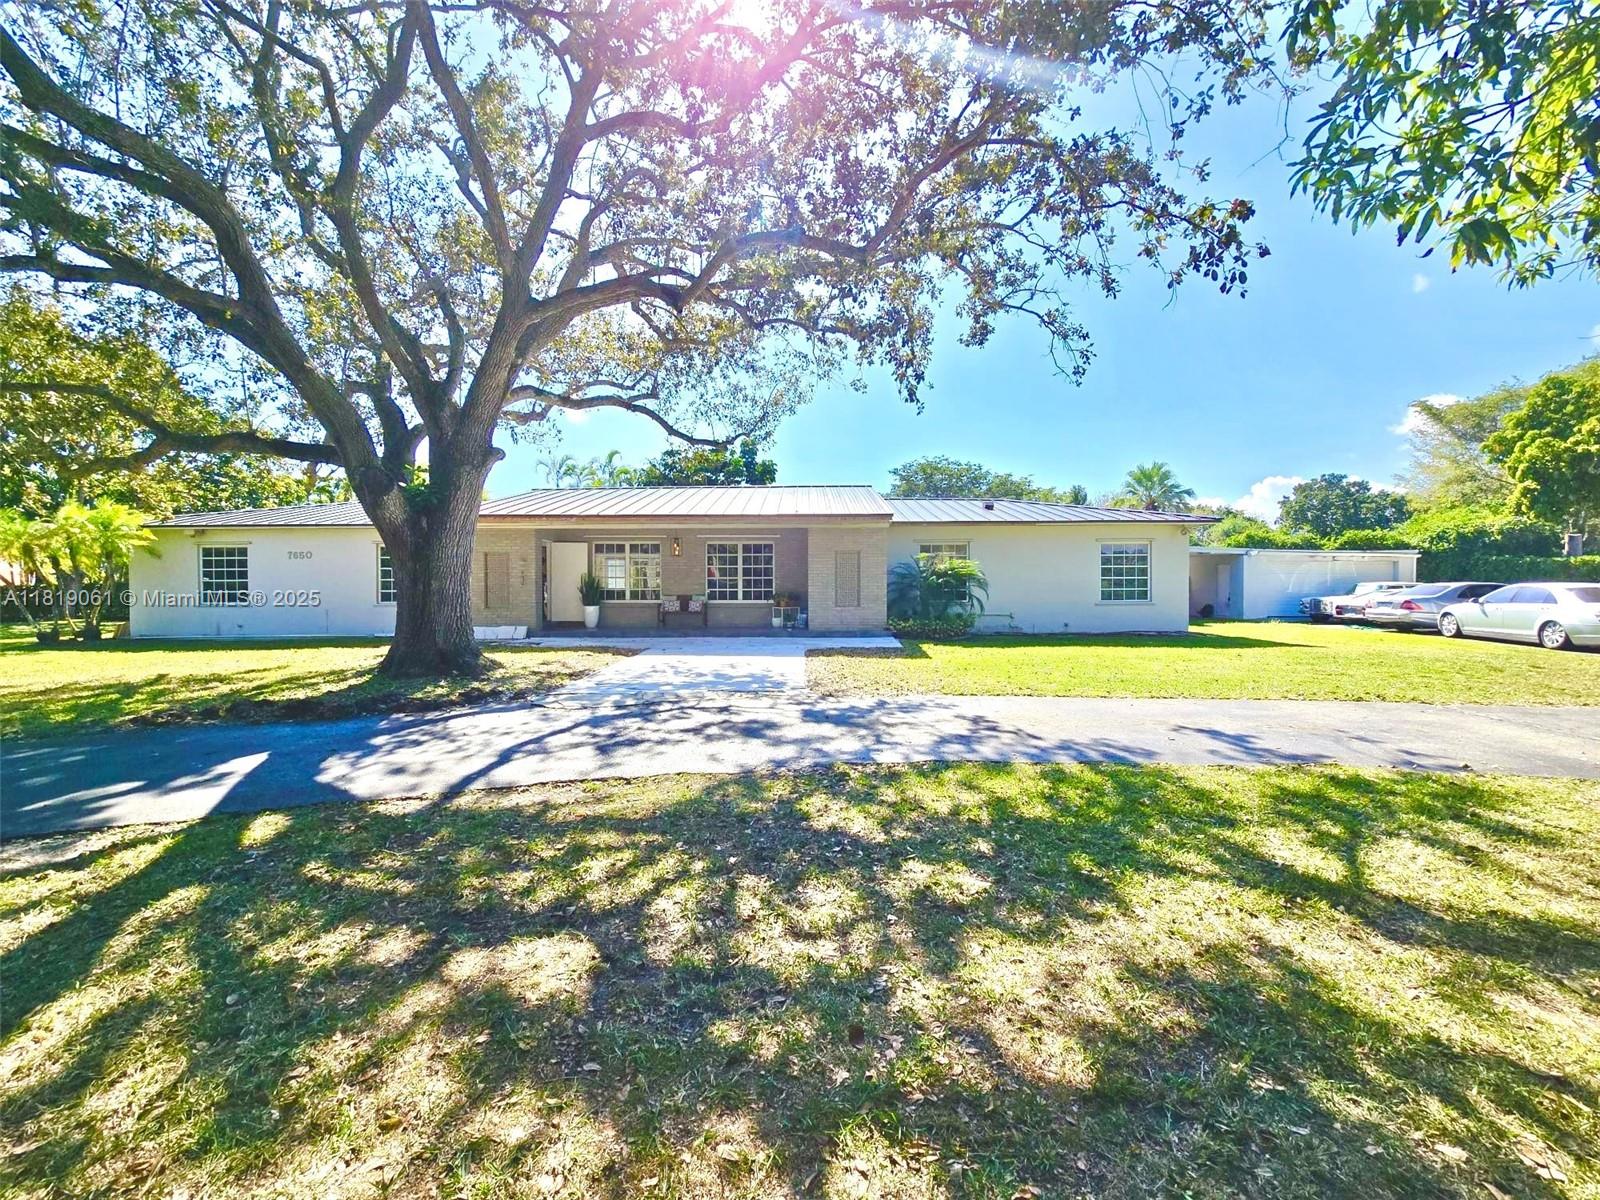
Active
$1,899,000
4
bds
|
3
ba
|
3,368
sqft
|
built
1958
7650 SW 78th Ct, Miami, FL 33143
$-3,916
Cash flow
-10.8%
Cash-on-Cash Return
3.8%
Cap rate
0.5%
Rent to Value Ratio
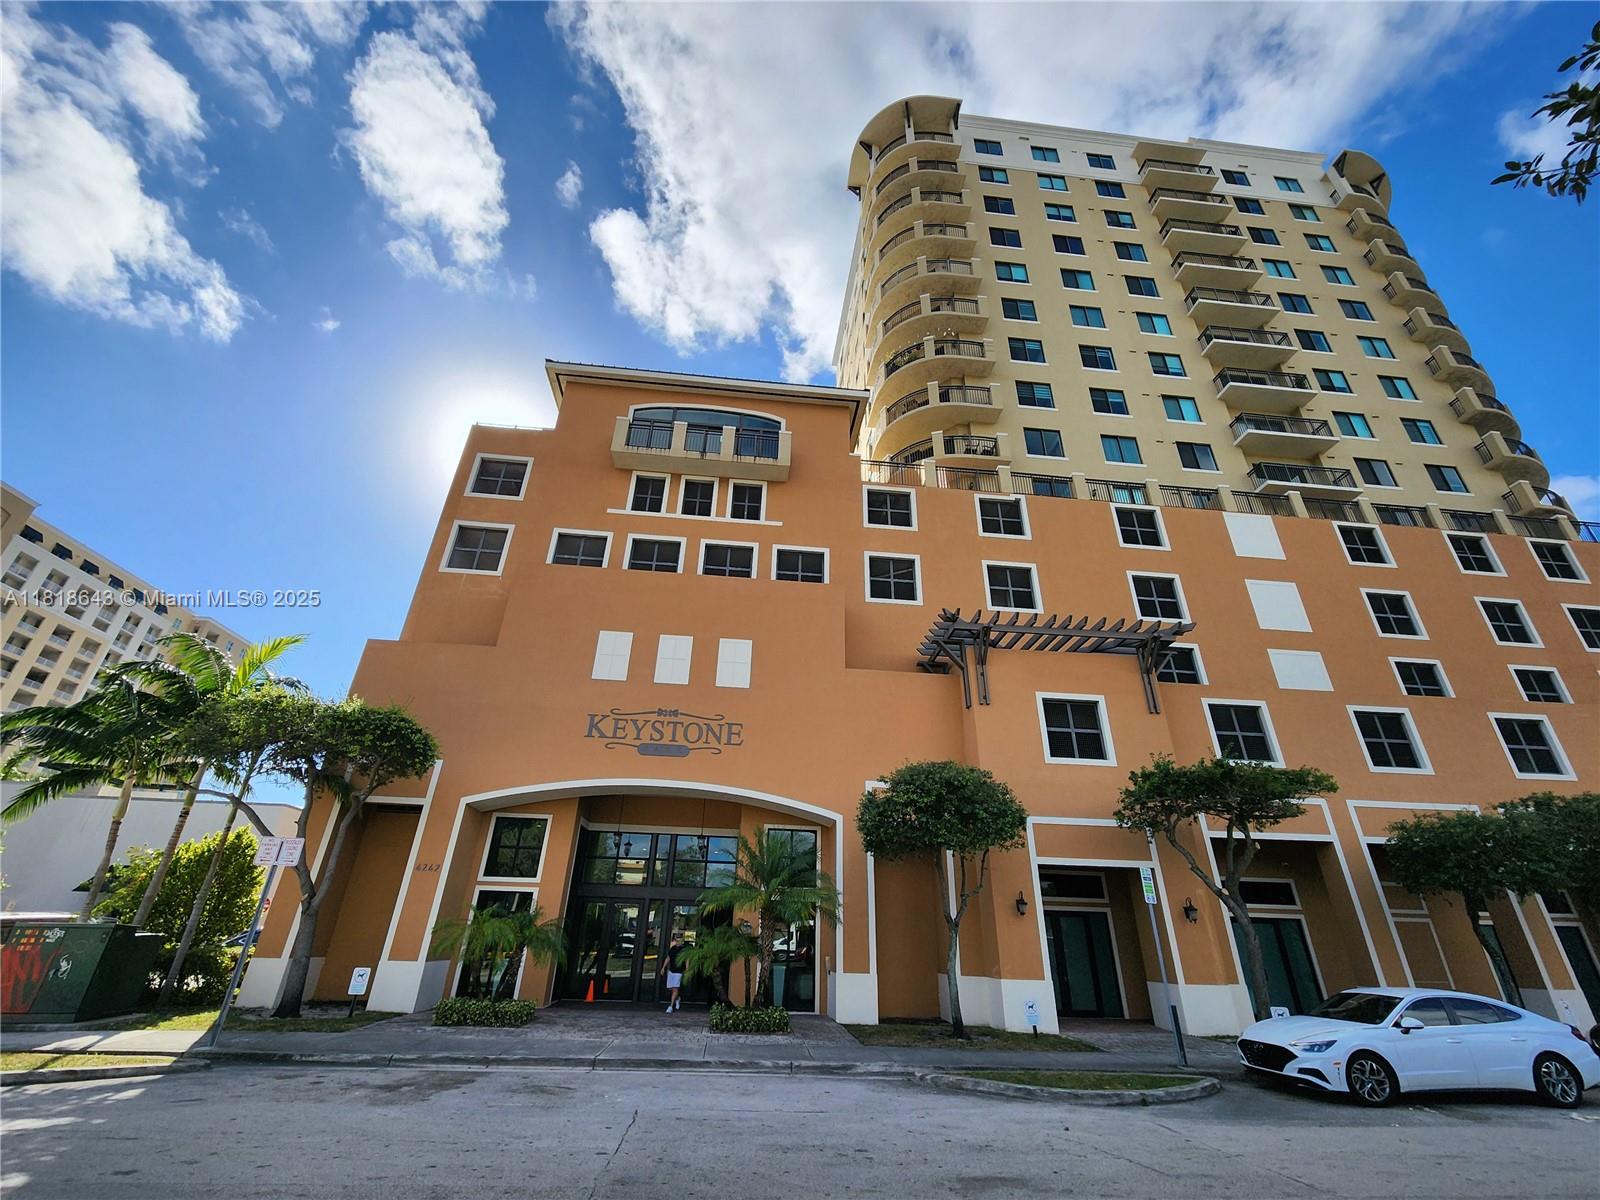
Active
$434,000
2
bds
|
2
ba
|
1,084
sqft
|
built
2006
4242 NW 2nd St, Miami, FL 33126
$-731
Cash flow
-8.8%
Cash-on-Cash Return
4.3%
Cap rate
0.7%
Rent to Value Ratio
Active
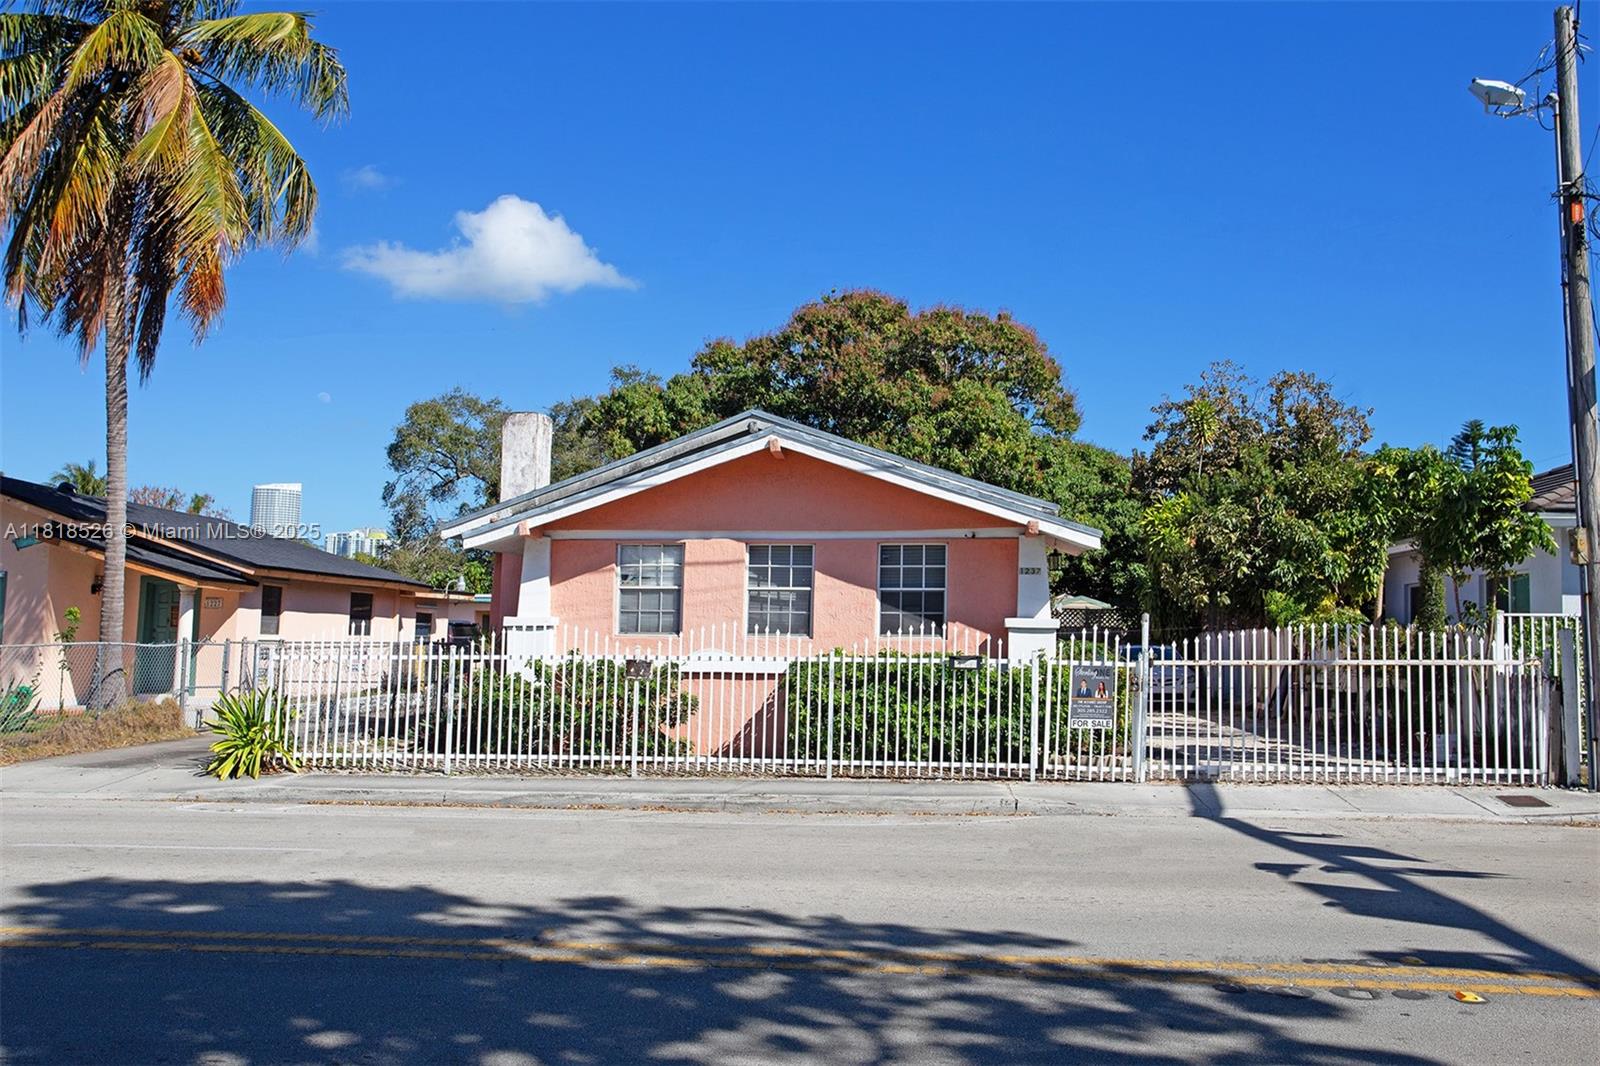
$699,999
bds
|
0
ba
|
1,721
sqft
|
built
1928
1237 SW 12th Ave, Miami, FL 33129
$-1,232
Cash flow
-9.2%
Cash-on-Cash Return
4.2%
Cap rate
0.6%
Rent to Value Ratio
Active
$289,000
2
bds
|
2
ba
|
991
sqft
|
built
1972
5501 NW 7th St, Miami, FL 33126
$-591
Cash flow
-10.7%
Cash-on-Cash Return
3.8%
Cap rate
0.9%
Rent to Value Ratio
Active
$1,900,000
5
bds
|
4
ba
|
3,104
sqft
|
built
2022
3660 SW 12th St, Miami, FL 33135
$-4,482
Cash flow
-12.3%
Cash-on-Cash Return
3.5%
Cap rate
0.6%
Rent to Value Ratio
Active
$635,000
3
bds
|
3
ba
|
1,669
sqft
|
built
1991
14534 SW 144th Ter, Miami, FL 33186
$-1,565
Cash flow
-12.9%
Cash-on-Cash Return
3.3%
Cap rate
0.5%
Rent to Value Ratio
Active
$459,700
3
bds
|
1
ba
|
1,015
sqft
|
built
1977
12303 SW 111th Ln, Miami, FL 33186
$-1,263
Cash flow
-14.3%
Cash-on-Cash Return
3.0%
Cap rate
0.6%
Rent to Value Ratio
Active
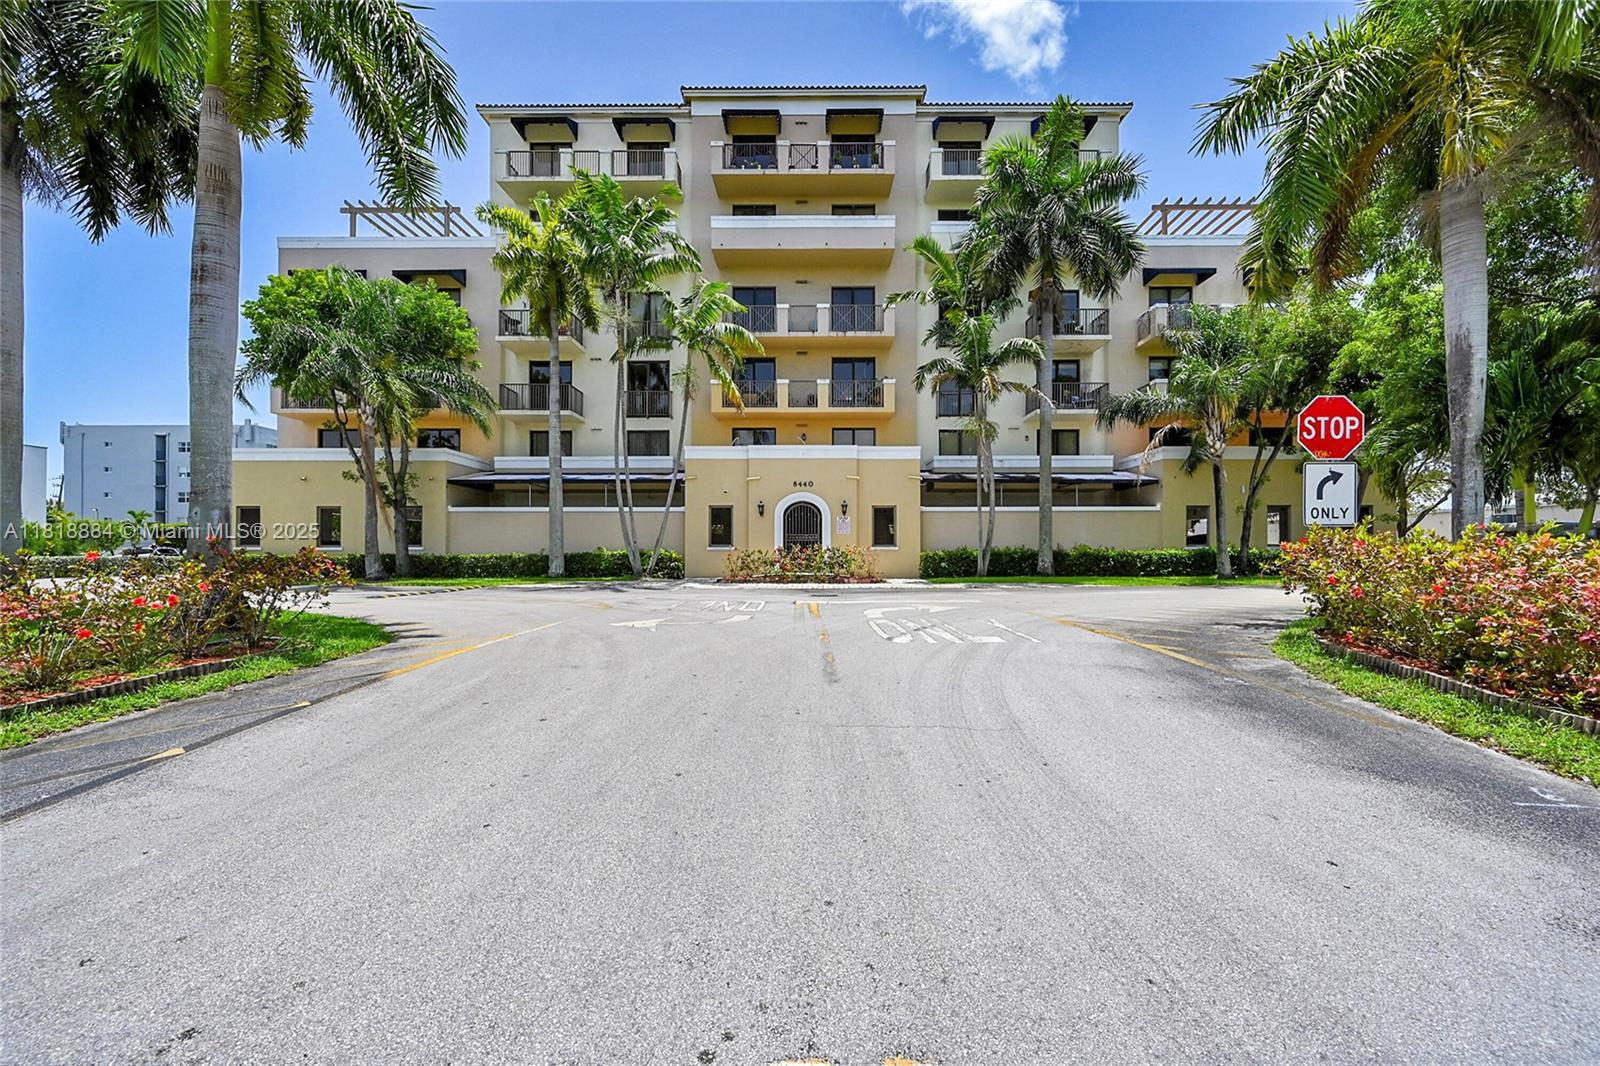
$400,000
2
bds
|
2
ba
|
934
sqft
|
built
2006
8440 SW 8th St, Miami, FL 33144
$-978
Cash flow
-12.8%
Cash-on-Cash Return
3.4%
Cap rate
0.6%
Rent to Value Ratio
Active
$1,899,000
4
bds
|
3
ba
|
2,614
sqft
|
built
1940
261 SW 30th Rd, Miami, FL 33129
$-4,922
Cash flow
-13.5%
Cash-on-Cash Return
3.2%
Cap rate
0.5%
Rent to Value Ratio
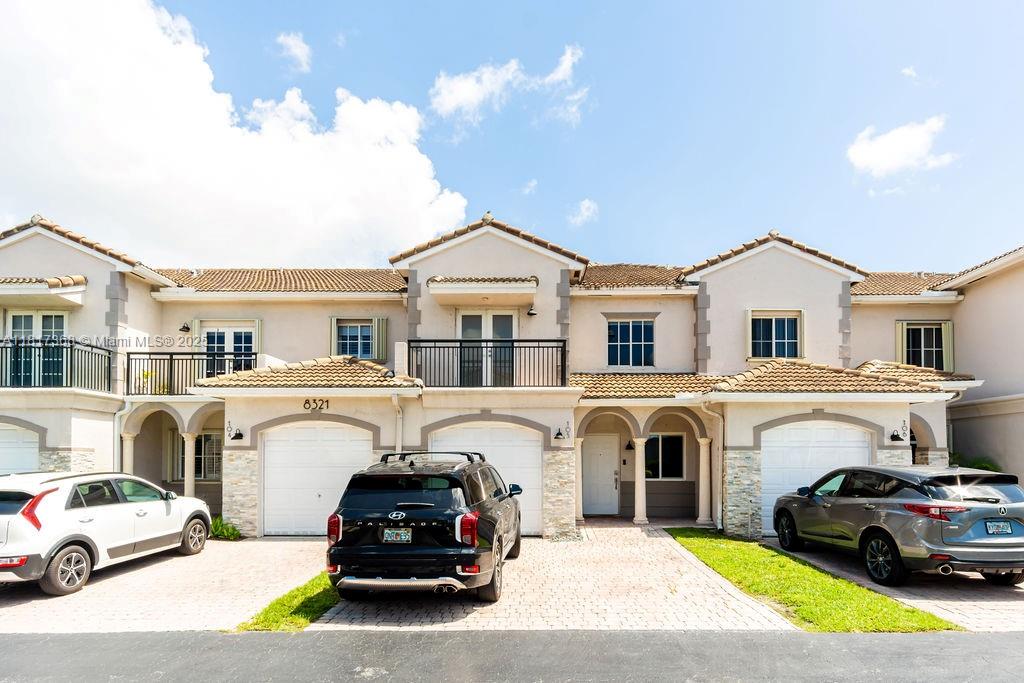
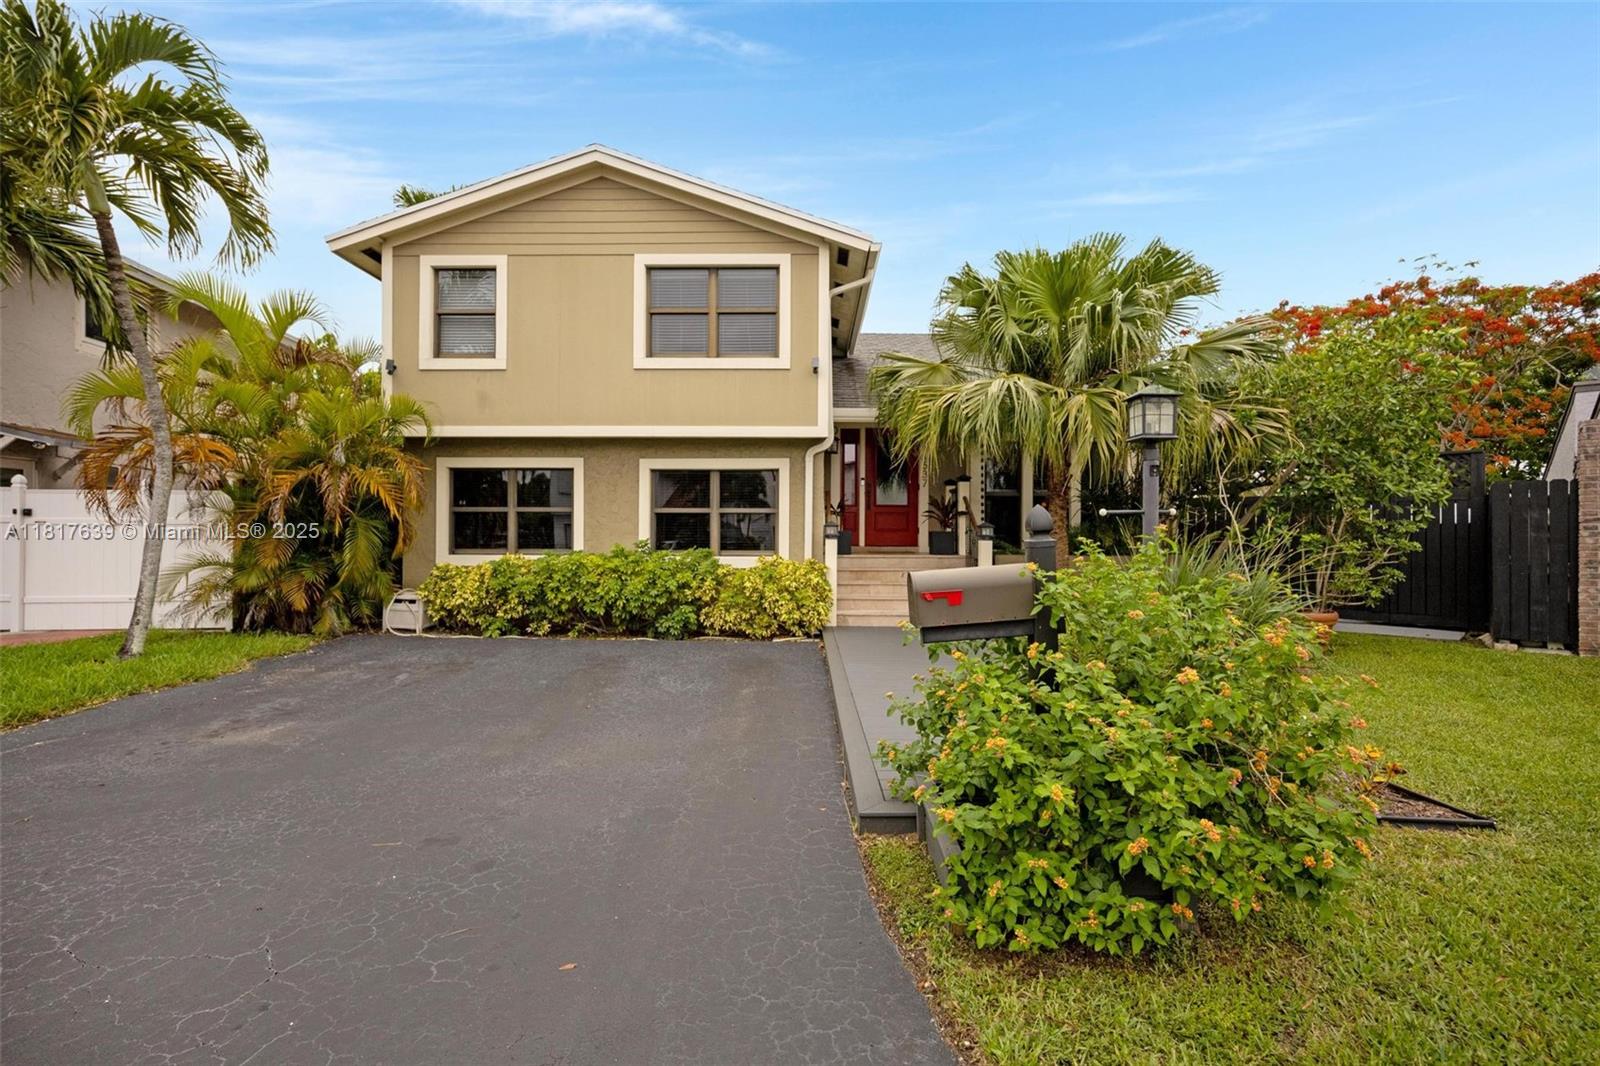
Active
$595,000
4
bds
|
3
ba
|
1,743
sqft
|
built
2001
8321 SW 124th Ave, Miami, FL 33183
$-2,073
Cash flow
-18.2%
Cash-on-Cash Return
2.1%
Cap rate
0.5%
Rent to Value Ratio
Active
$675,000
4
bds
|
3
ba
|
2,310
sqft
|
built
2002
12281 SW 121st Ter, Miami, FL 33186
$-1,726
Cash flow
-13.3%
Cash-on-Cash Return
3.2%
Cap rate
0.6%
Rent to Value Ratio

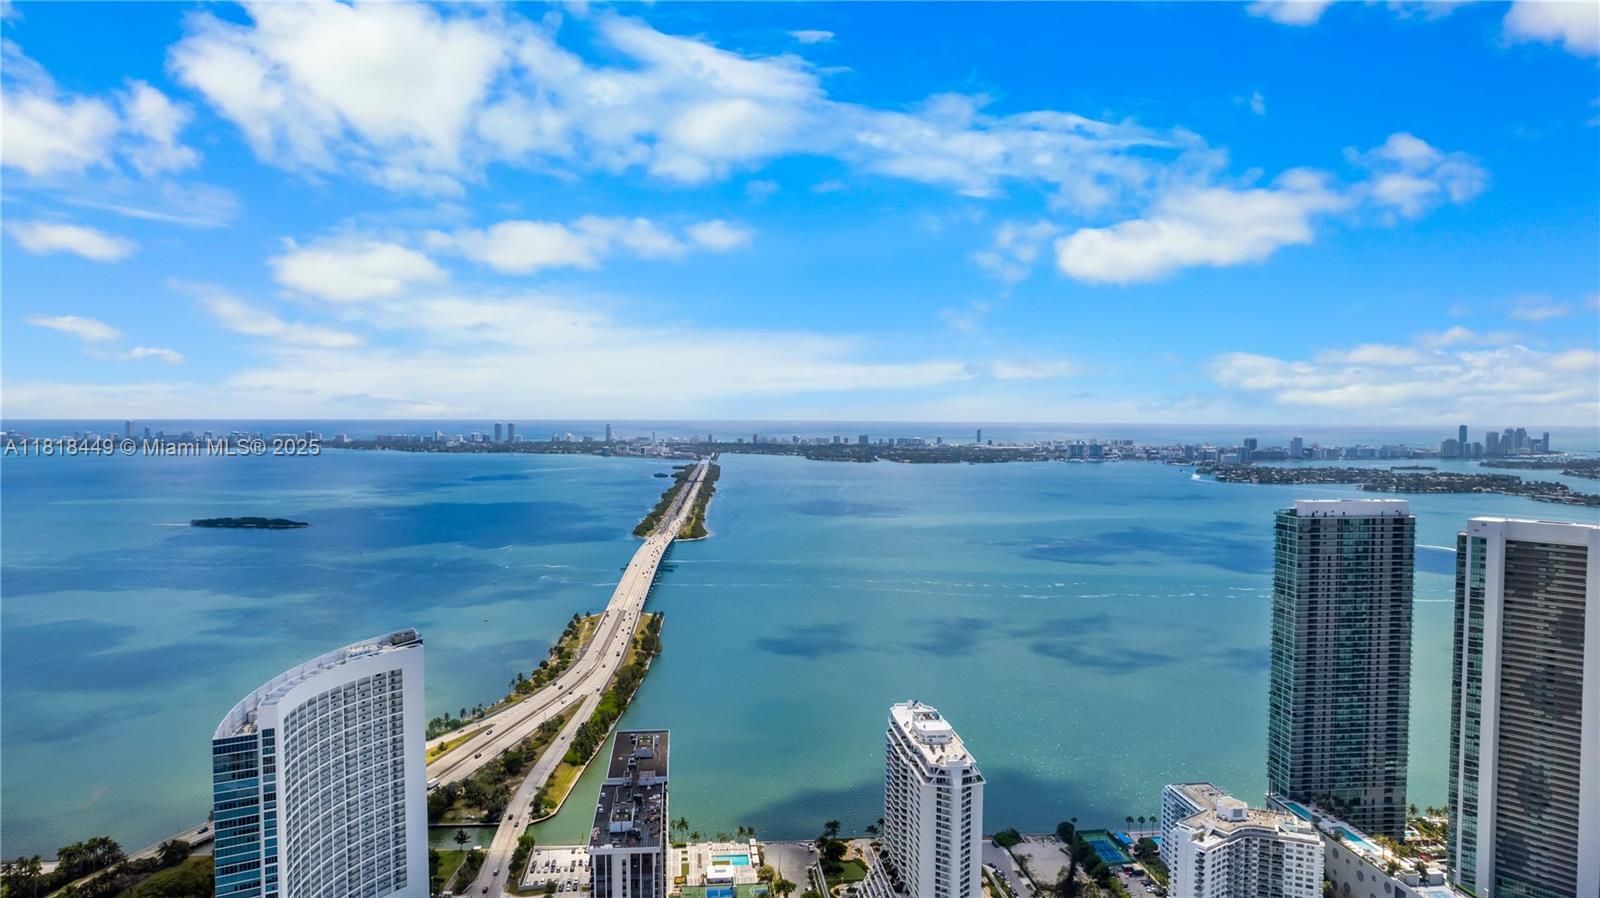
Active
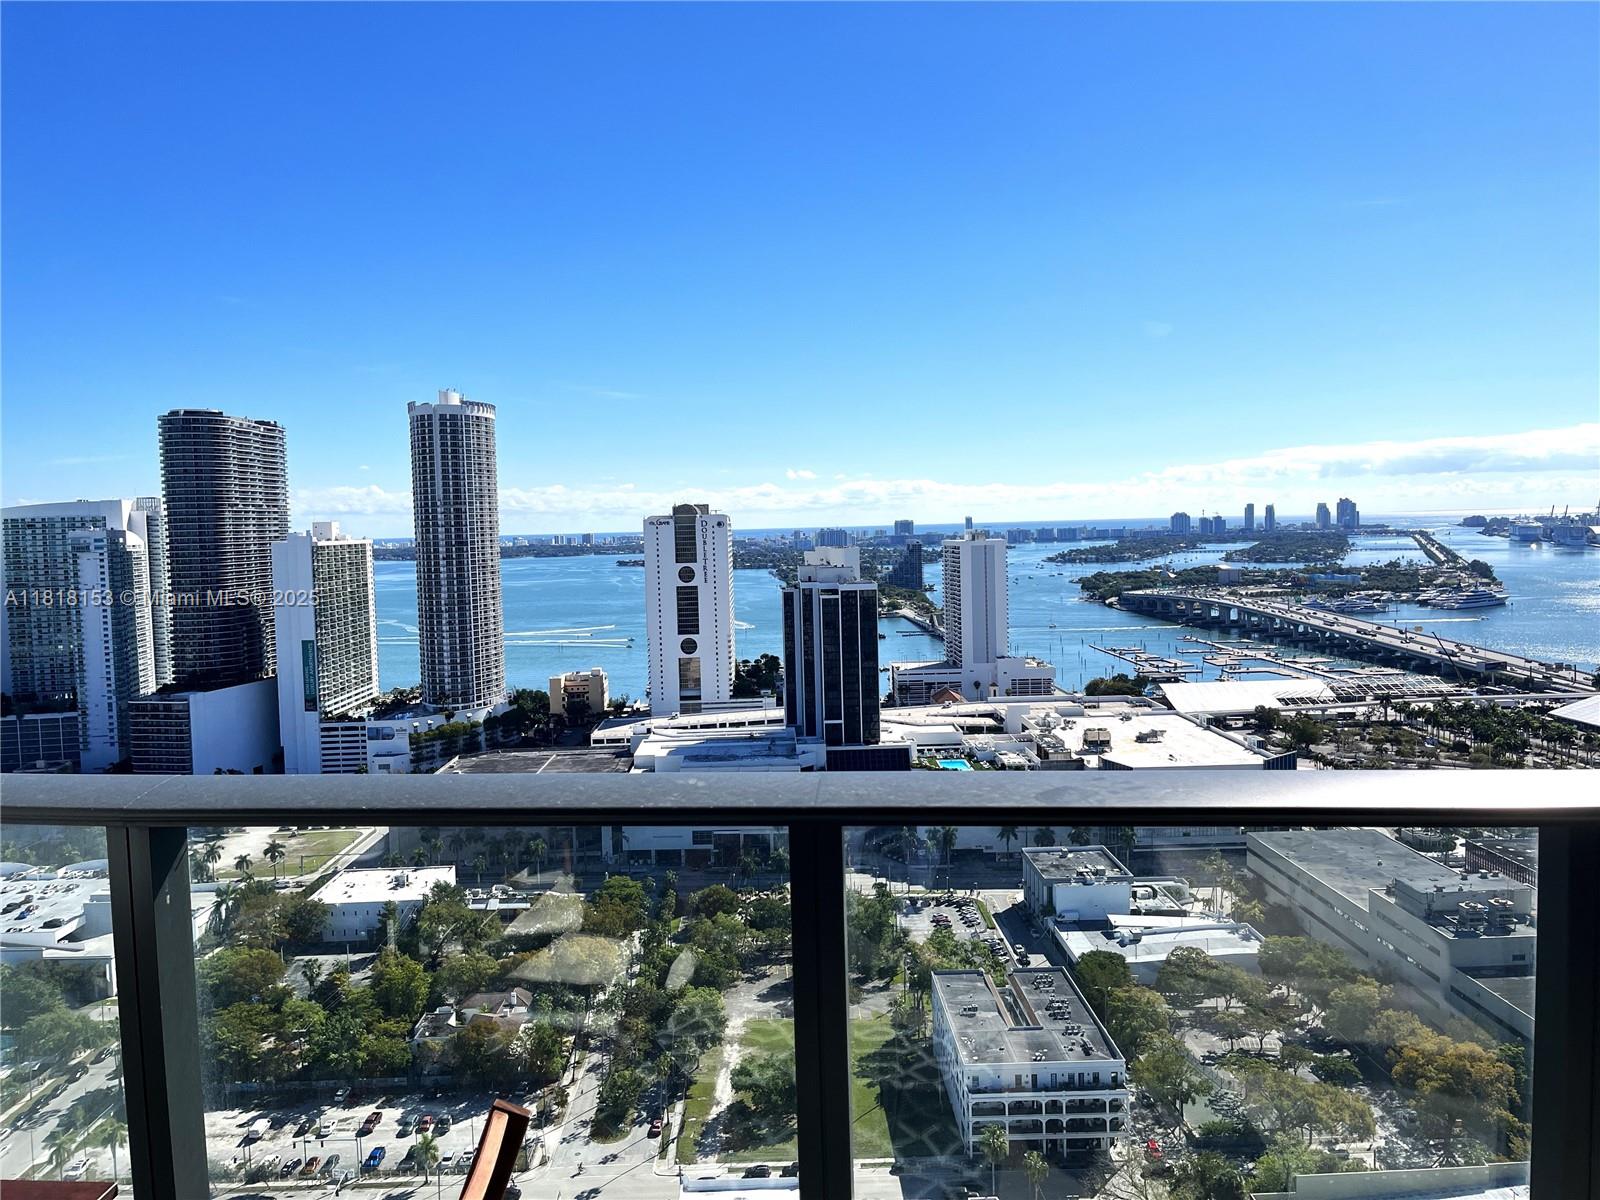
$515,000
2
bds
|
2
ba
|
1,009
sqft
|
built
1977
1450 Brickell Bay Dr, Miami, FL 33131
$-2,003
Cash flow
-20.3%
Cash-on-Cash Return
1.6%
Cap rate
0.7%
Rent to Value Ratio
Active
$300,000
2
bds
|
3
ba
|
1,045
sqft
|
built
1979
1121 SW 105th Ave, Miami, FL 33174
$-353
Cash flow
-6.1%
Cash-on-Cash Return
4.9%
Cap rate
0.8%
Rent to Value Ratio
Active
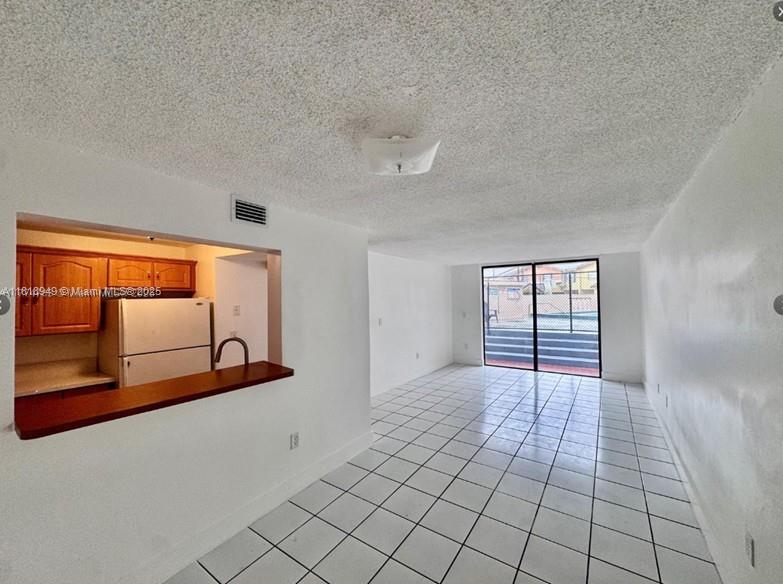
$280,000
2
bds
|
2
ba
|
985
sqft
|
built
1983
8415 SW 107th Ave, Miami, FL 33173
$-546
Cash flow
-10.2%
Cash-on-Cash Return
4.0%
Cap rate
0.8%
Rent to Value Ratio
Active
$779,000
2
bds
|
3
ba
|
1,574
sqft
|
built
1964
1408 Brickell Bay Dr, Miami, FL 33131
$-3,815
Cash flow
-25.6%
Cash-on-Cash Return
0.4%
Cap rate
0.6%
Rent to Value Ratio
Active
$899,000
4
bds
|
3
ba
|
2,493
sqft
|
built
1994
14908 SW 143rd Pl, Miami, FL 33186
$-2,389
Cash flow
-13.9%
Cash-on-Cash Return
3.1%
Cap rate
0.5%
Rent to Value Ratio
Active
$285,000
2
bds
|
2
ba
|
1,036
sqft
|
built
1972
816 NW 87th Ave, Miami, FL 33172
$-640
Cash flow
-11.7%
Cash-on-Cash Return
3.6%
Cap rate
0.8%
Rent to Value Ratio
Active
$280,000
2
bds
|
2
ba
|
914
sqft
|
built
1977
9678 Fontainebleau Blvd, Miami, FL 33172
$-504
Cash flow
-9.4%
Cash-on-Cash Return
4.1%
Cap rate
0.8%
Rent to Value Ratio

Active
$2,350,000
5
bds
|
5
ba
|
3,205
sqft
|
built
1997
9532 SW 124th Ter, Miami, FL 33176
$-7,472
Cash flow
-16.6%
Cash-on-Cash Return
2.5%
Cap rate
0.5%
Rent to Value Ratio
Active
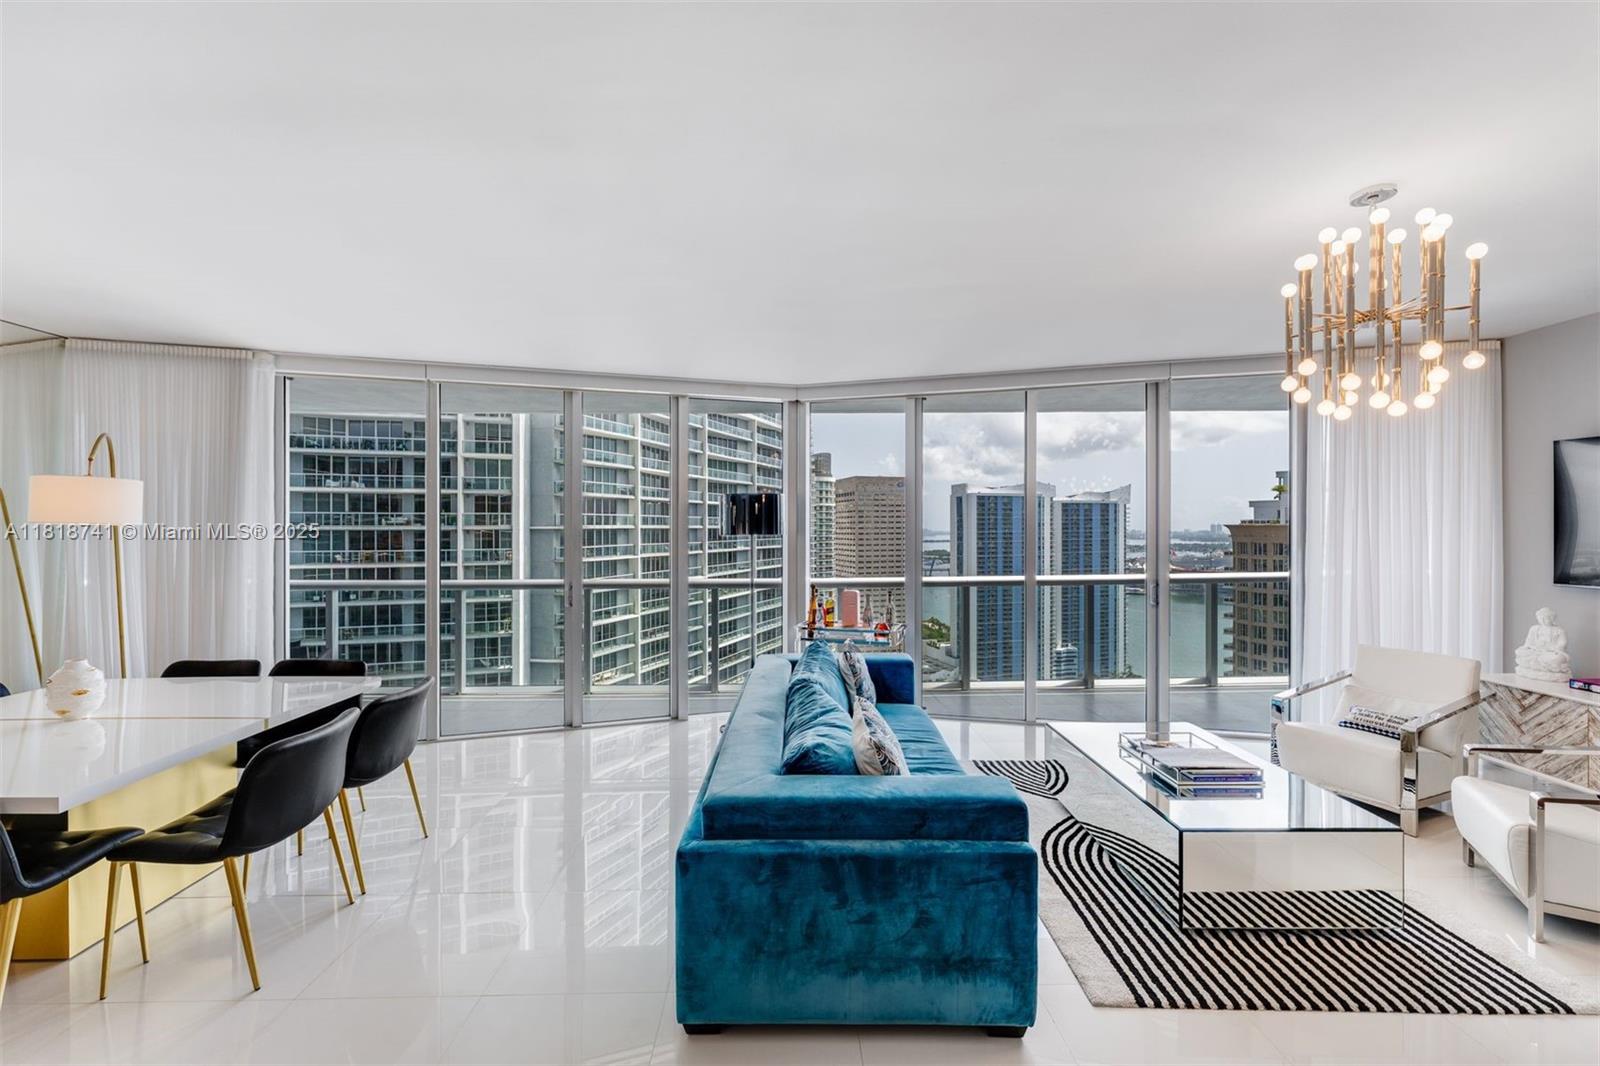
$1,395,000
2
bds
|
2
ba
|
1,633
sqft
|
built
2009
495 Brickell Ave, Miami, FL 33131
$-5,861
Cash flow
-21.9%
Cash-on-Cash Return
1.2%
Cap rate
0.5%
Rent to Value Ratio
Active
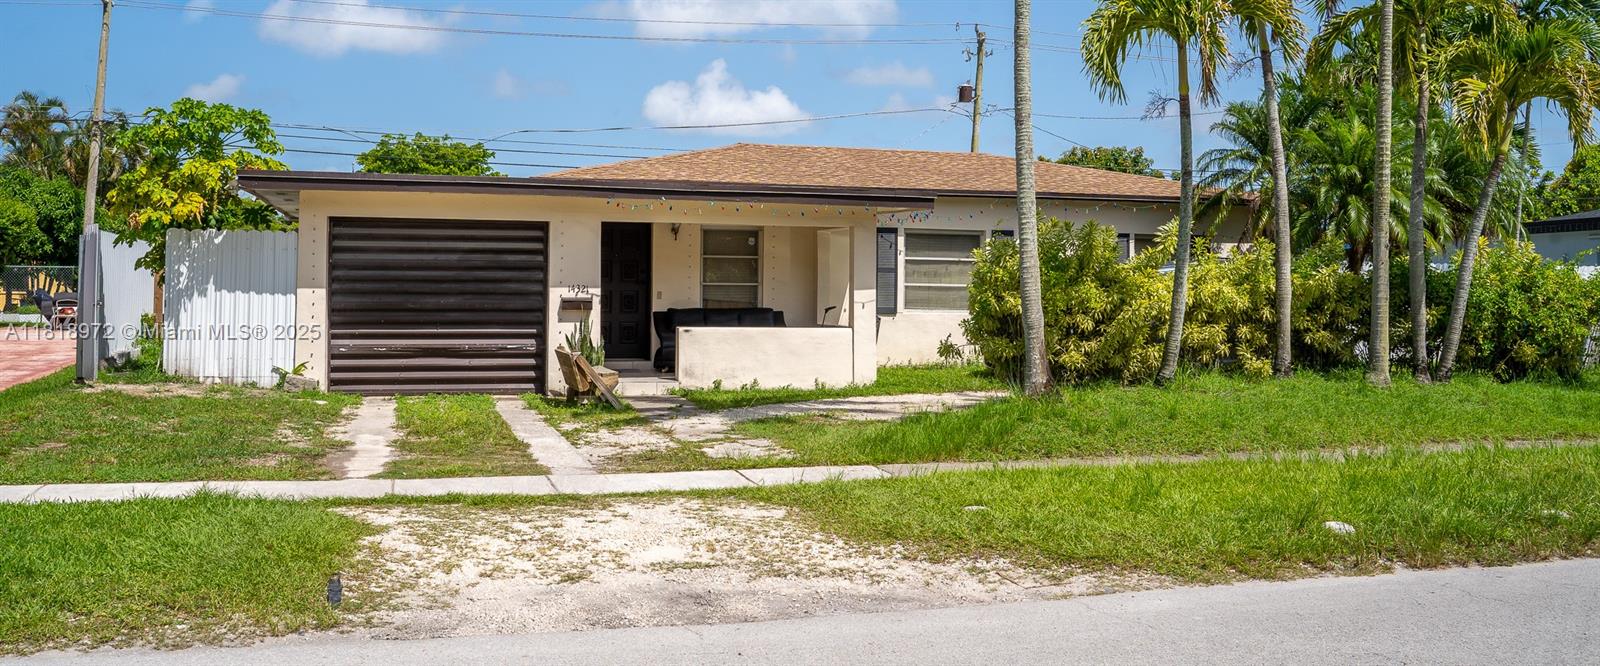
$575,000
5
bds
|
2
ba
|
1,906
sqft
|
built
1951
14321 Boggs Dr, Miami, FL 33176
$-1,177
Cash flow
-10.7%
Cash-on-Cash Return
3.8%
Cap rate
0.6%
Rent to Value Ratio
Active
$550,000
2
bds
|
2
ba
|
1,455
sqft
|
built
1971
11800 SW 179th Ter, Miami, FL 33177
$-827
Cash flow
-7.8%
Cash-on-Cash Return
4.5%
Cap rate
0.6%
Rent to Value Ratio
Active
$785,000
4
bds
|
0
ba
|
2,193
sqft
|
built
1970
3200 SW 88th Pl, Miami, FL 33165
$-3,128
Cash flow
-20.8%
Cash-on-Cash Return
1.5%
Cap rate
0.3%
Rent to Value Ratio
Active
$728,000
2
bds
|
2
ba
|
1,263
sqft
|
built
2008
3301 NE 1st Ave, Miami, FL 33137
$-2,543
Cash flow
-18.2%
Cash-on-Cash Return
2.1%
Cap rate
0.7%
Rent to Value Ratio
Active
$1,020,000
5
bds
|
4
ba
|
3,383
sqft
|
built
1995
4291 SW 154th Pl, Miami, FL 33185
$-484
Cash flow
-2.5%
Cash-on-Cash Return
5.7%
Cap rate
0.8%
Rent to Value Ratio
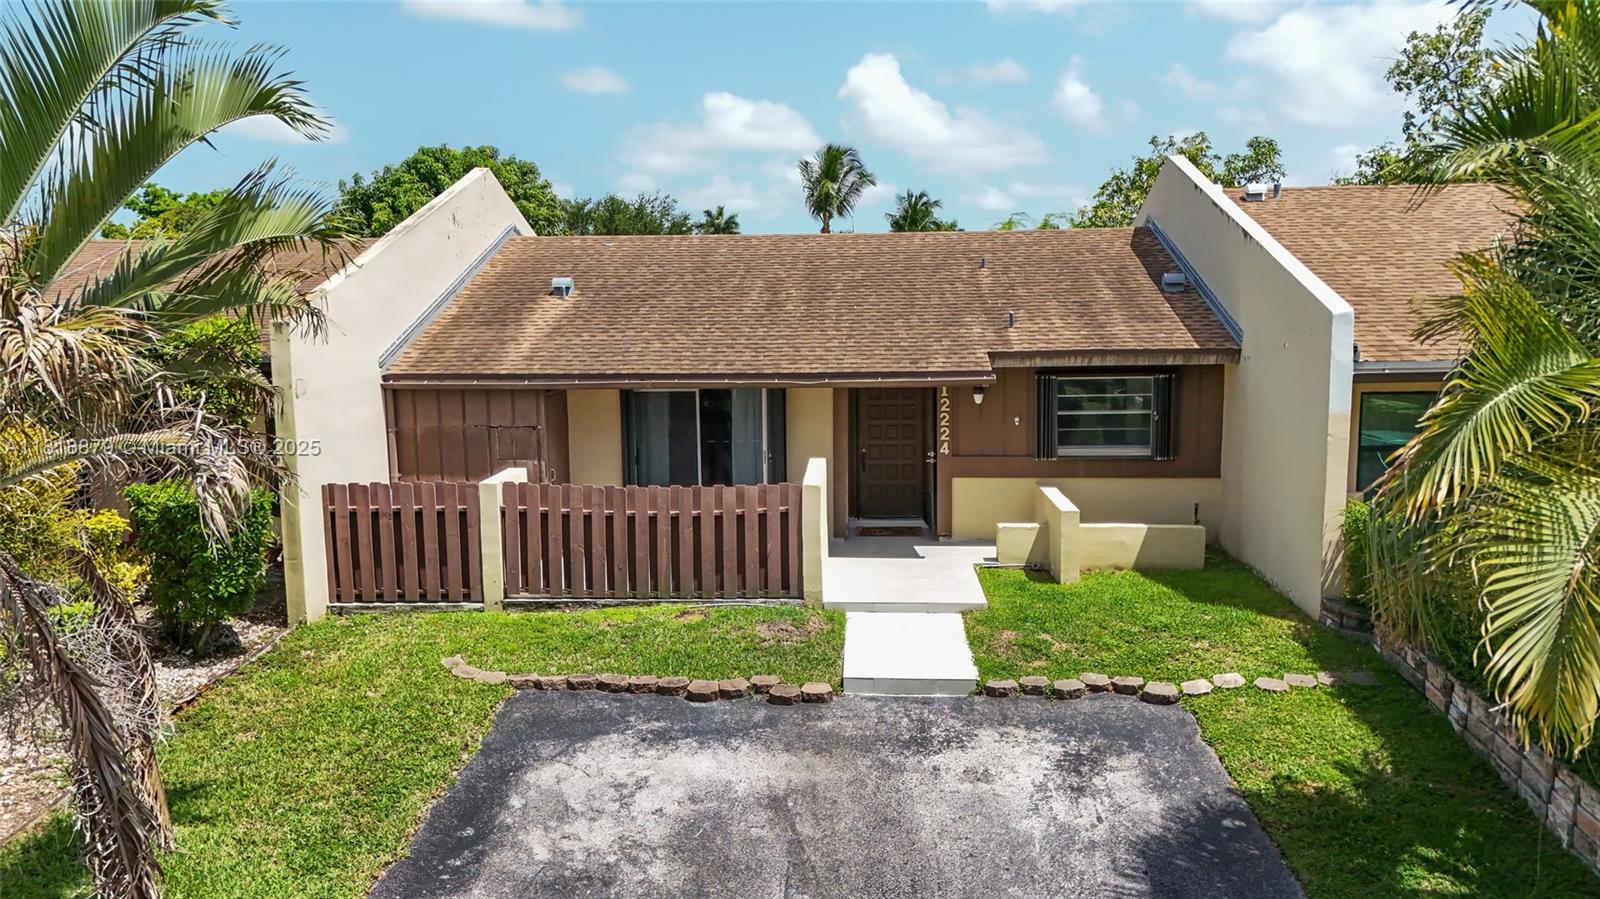
Active
$450,000
2
bds
|
2
ba
|
1,101
sqft
|
built
1980
12224 SW 118th Ln, Miami, FL 33186
$-1,045
Cash flow
-12.1%
Cash-on-Cash Return
3.5%
Cap rate
0.6%
Rent to Value Ratio
Active
$315,000
2
bds
|
2
ba
|
1,312
sqft
|
built
1987
9550 SW 140th Ct, Miami, FL 33186
$-874
Cash flow
-14.5%
Cash-on-Cash Return
3.0%
Cap rate
0.8%
Rent to Value Ratio
Active
$1,185,000
3
bds
|
2
ba
|
1,772
sqft
|
built
1975
6751 SW 48th St, Miami, FL 33155
$-3,414
Cash flow
-15.0%
Cash-on-Cash Return
2.8%
Cap rate
0.4%
Rent to Value Ratio
Active
$815,000
4
bds
|
2
ba
|
1,714
sqft
|
built
1964
11206 SW 1st St, Miami, FL 33174
$-2,508
Cash flow
-16.1%
Cash-on-Cash Return
2.6%
Cap rate
0.4%
Rent to Value Ratio
Active
$1,150,000
2
bds
|
2
ba
|
1,529
sqft
|
built
2004
1331 Brickell Bay Dr, Miami, FL 33131
$-6,664
Cash flow
-30.2%
Cash-on-Cash Return
-0.7%
Cap rate
0.5%
Rent to Value Ratio
Active
$450,000
3
bds
|
3
ba
|
1,319
sqft
|
built
2000
14085 SW 179th Ter, Miami, FL 33177
$-952
Cash flow
-11.0%
Cash-on-Cash Return
3.8%
Cap rate
0.7%
Rent to Value Ratio