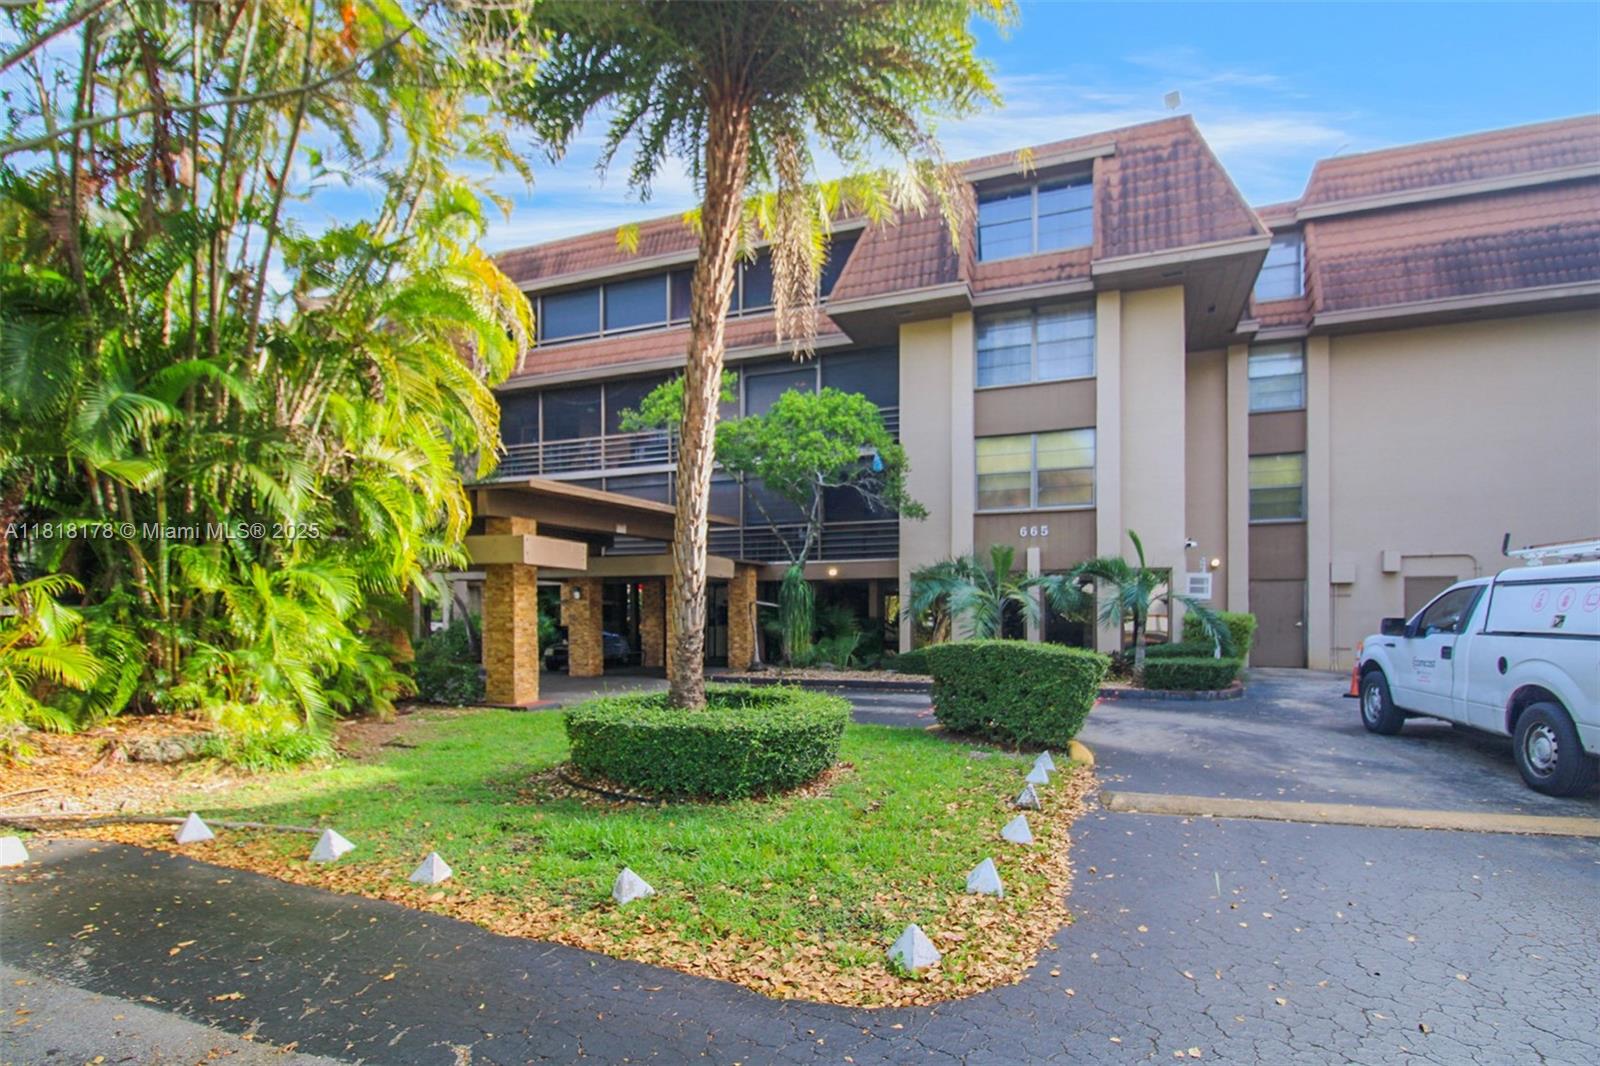
Miami, FL Investment Properties for Sale
Browse homes for sale and investment properties in Miami, FL. Refine your search by price, property type, or more.
Best cash flowing properties in Miami, FL
Active
$215,000
2
bds
|
2
ba
|
900
sqft
|
built
1973
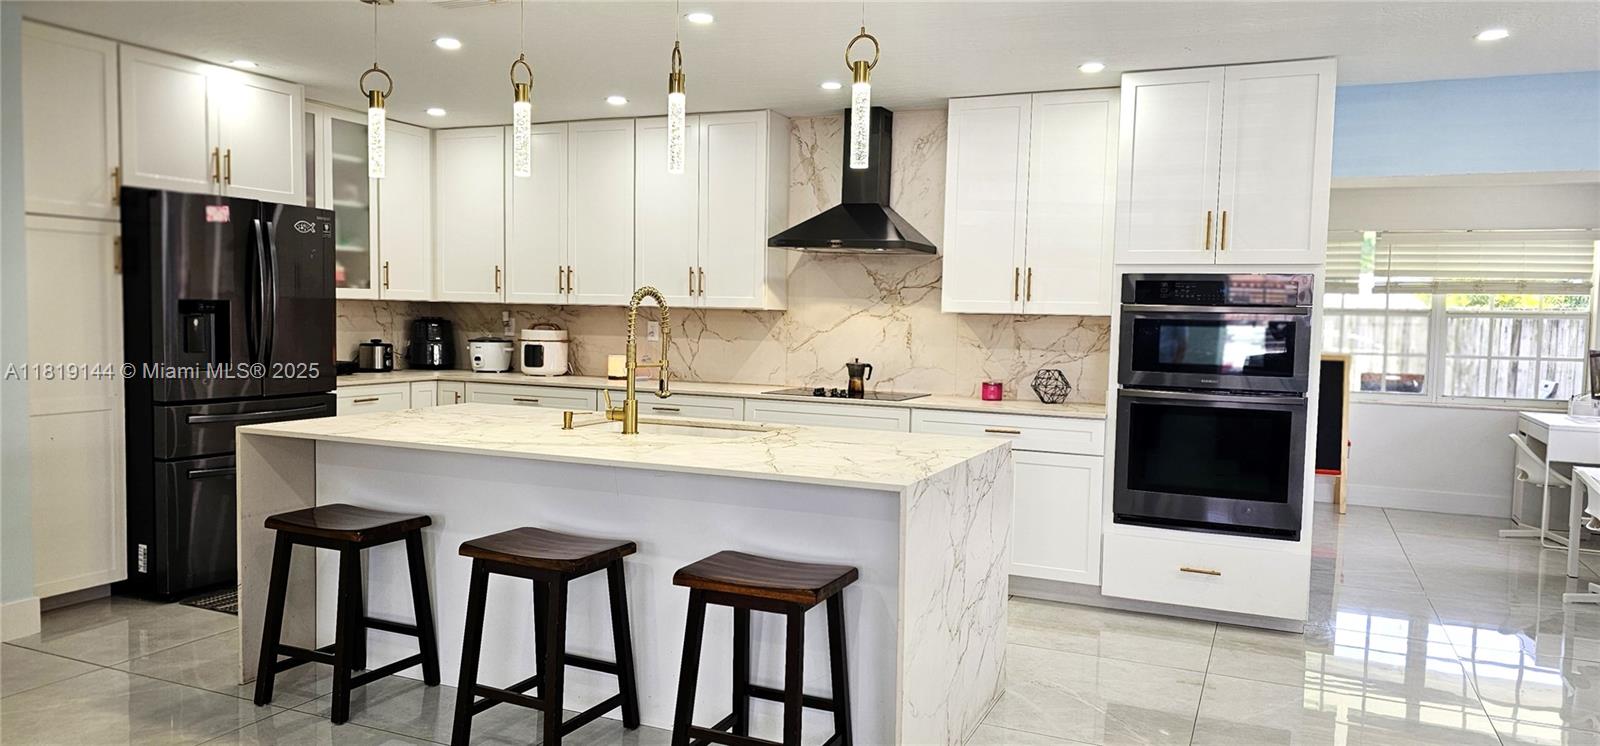
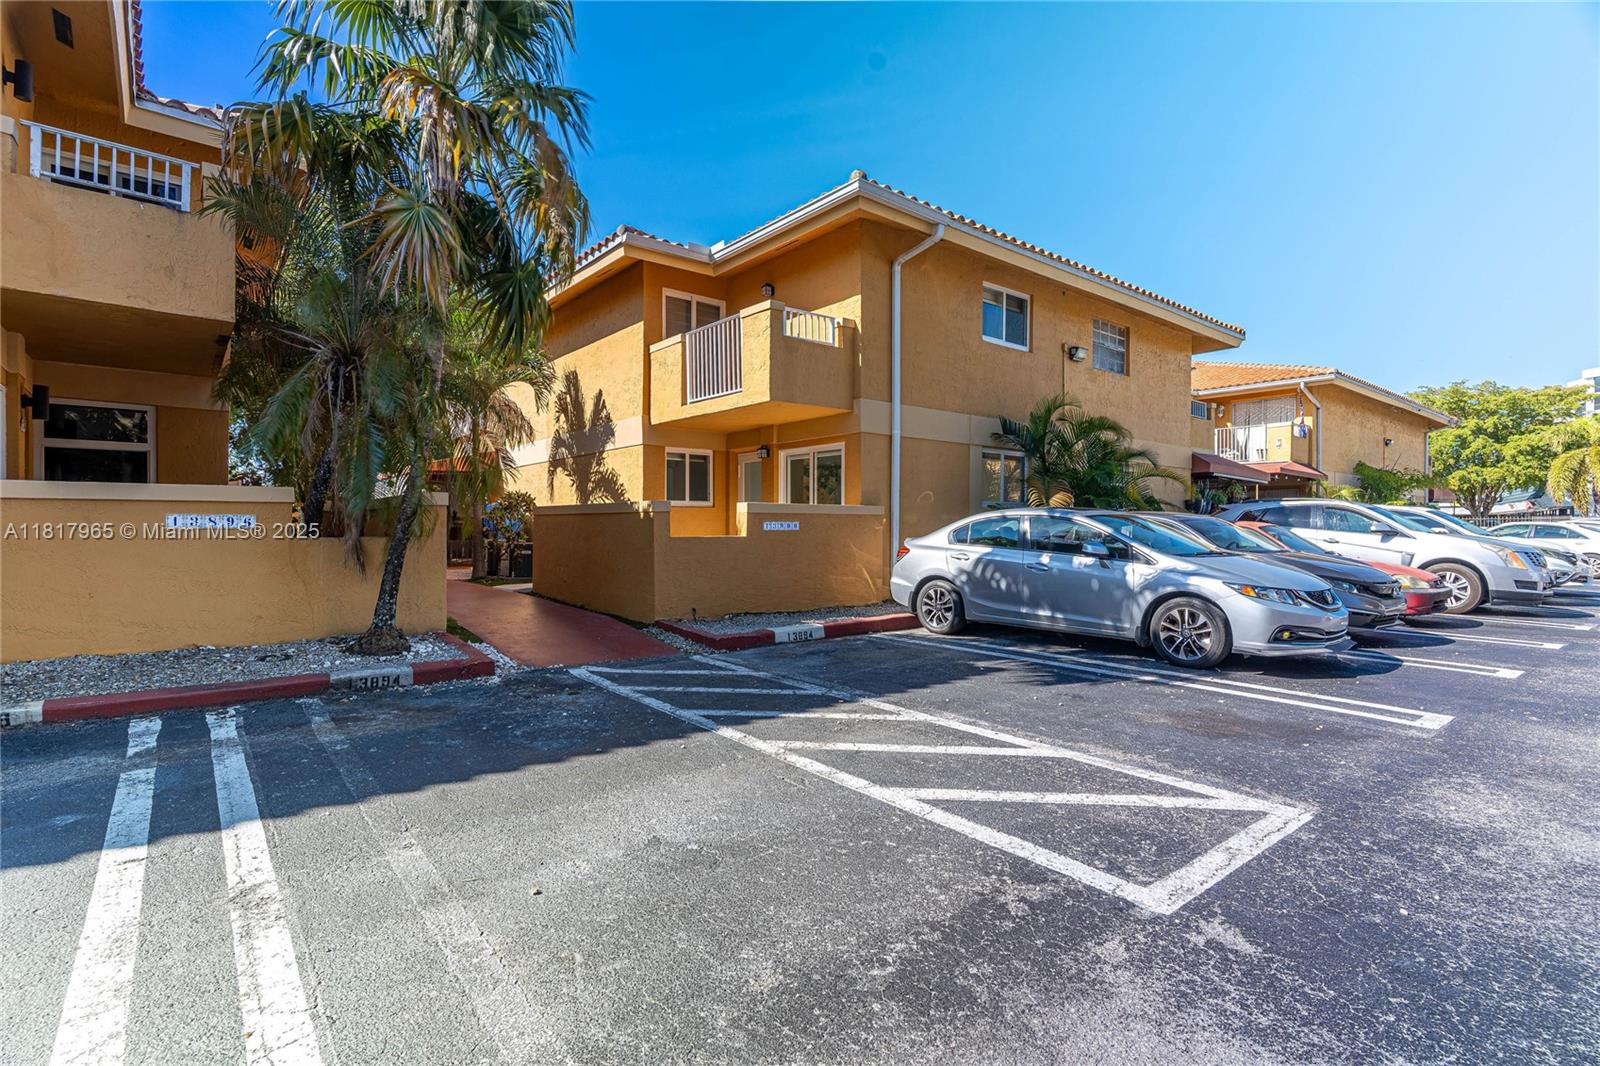
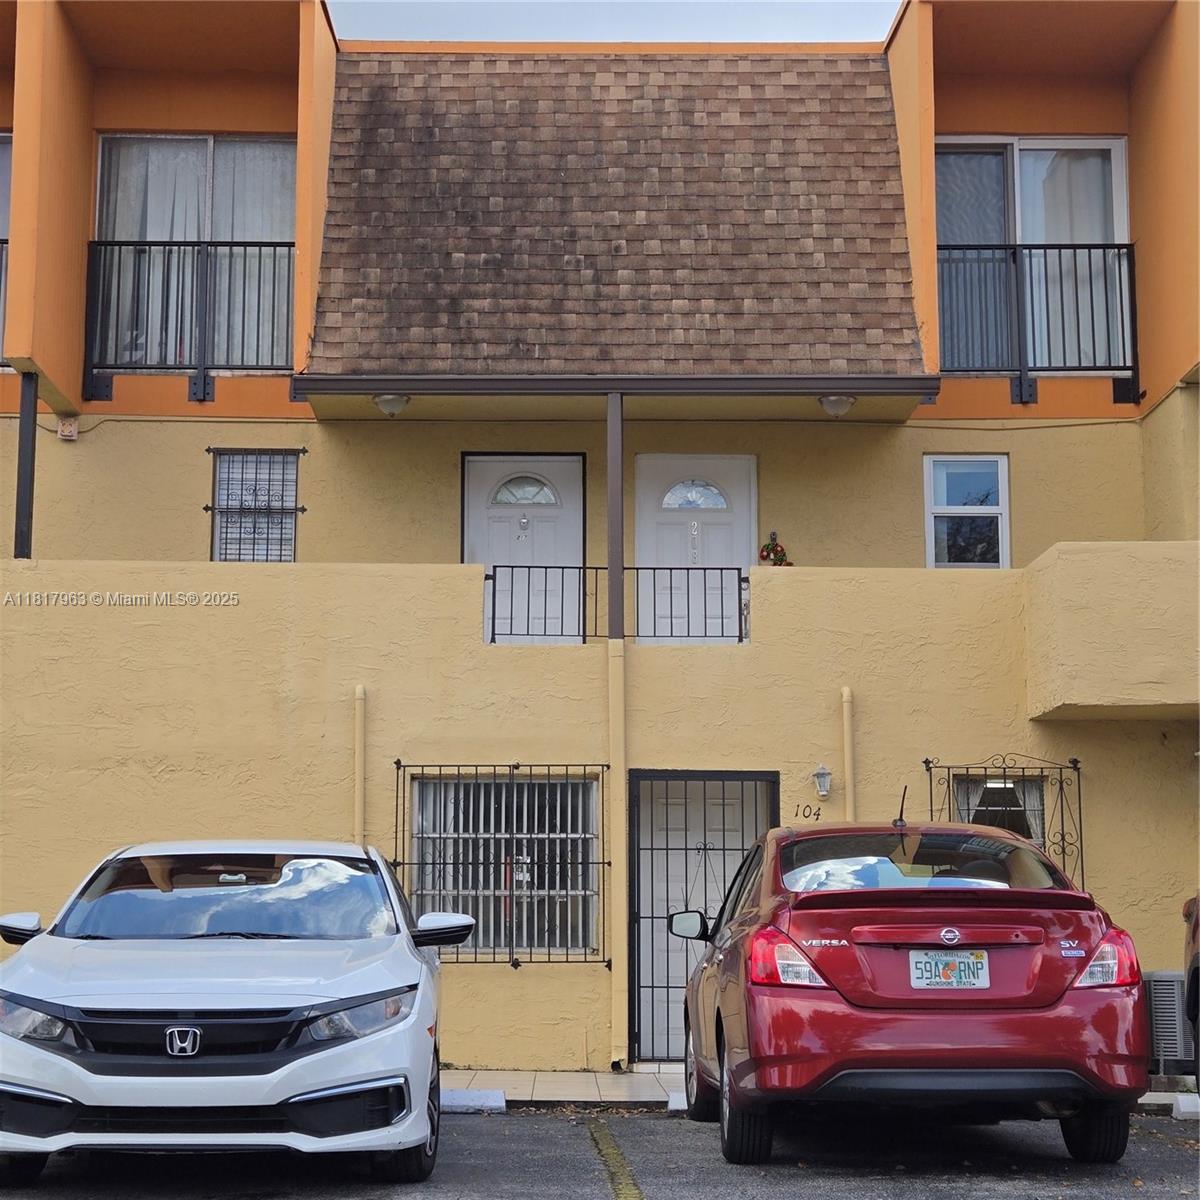
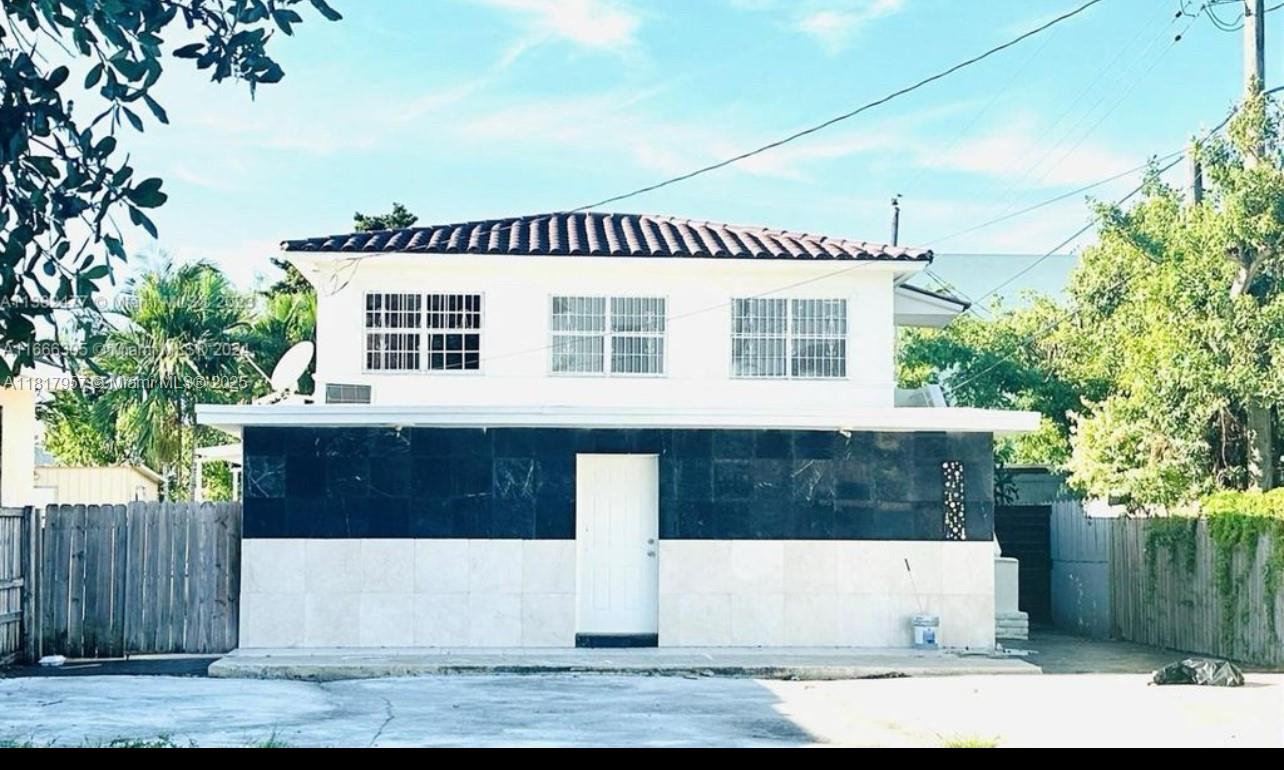
9455 W Flagler St, Miami, FL 33174
$3
Cash flow
0.1%
Cash-on-Cash Return
6.3%
Cap rate
1.1%
Rent to Value Ratio
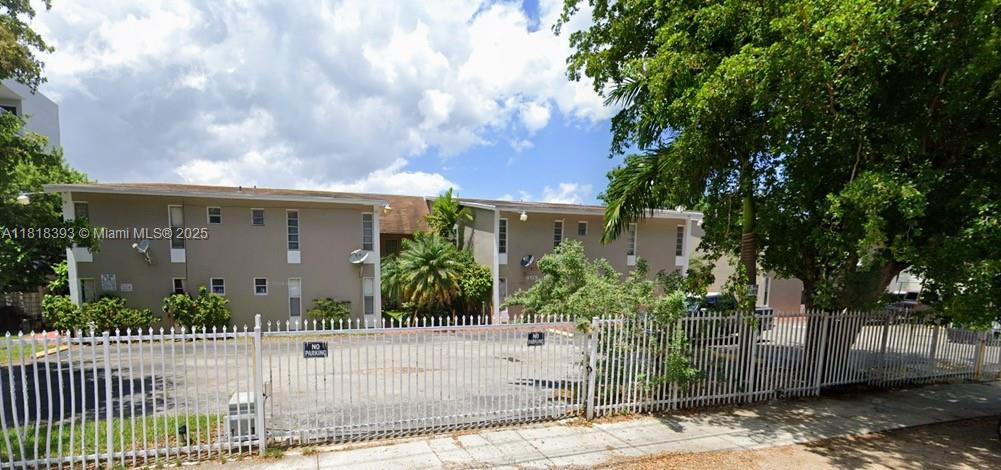
Active
$156,999
1
bds
|
1
ba
|
496
sqft
|
built
1971
1525 NW 19th Ter, Miami, FL 33125
$-25
Cash flow
-0.8%
Cash-on-Cash Return
6.1%
Cap rate
1.1%
Rent to Value Ratio
6,349 out of 7,208 properties for sale in Miami, FL
Limited Results Shown
Create a free account, or log in to reveal all property listings and enjoy the complete experience.
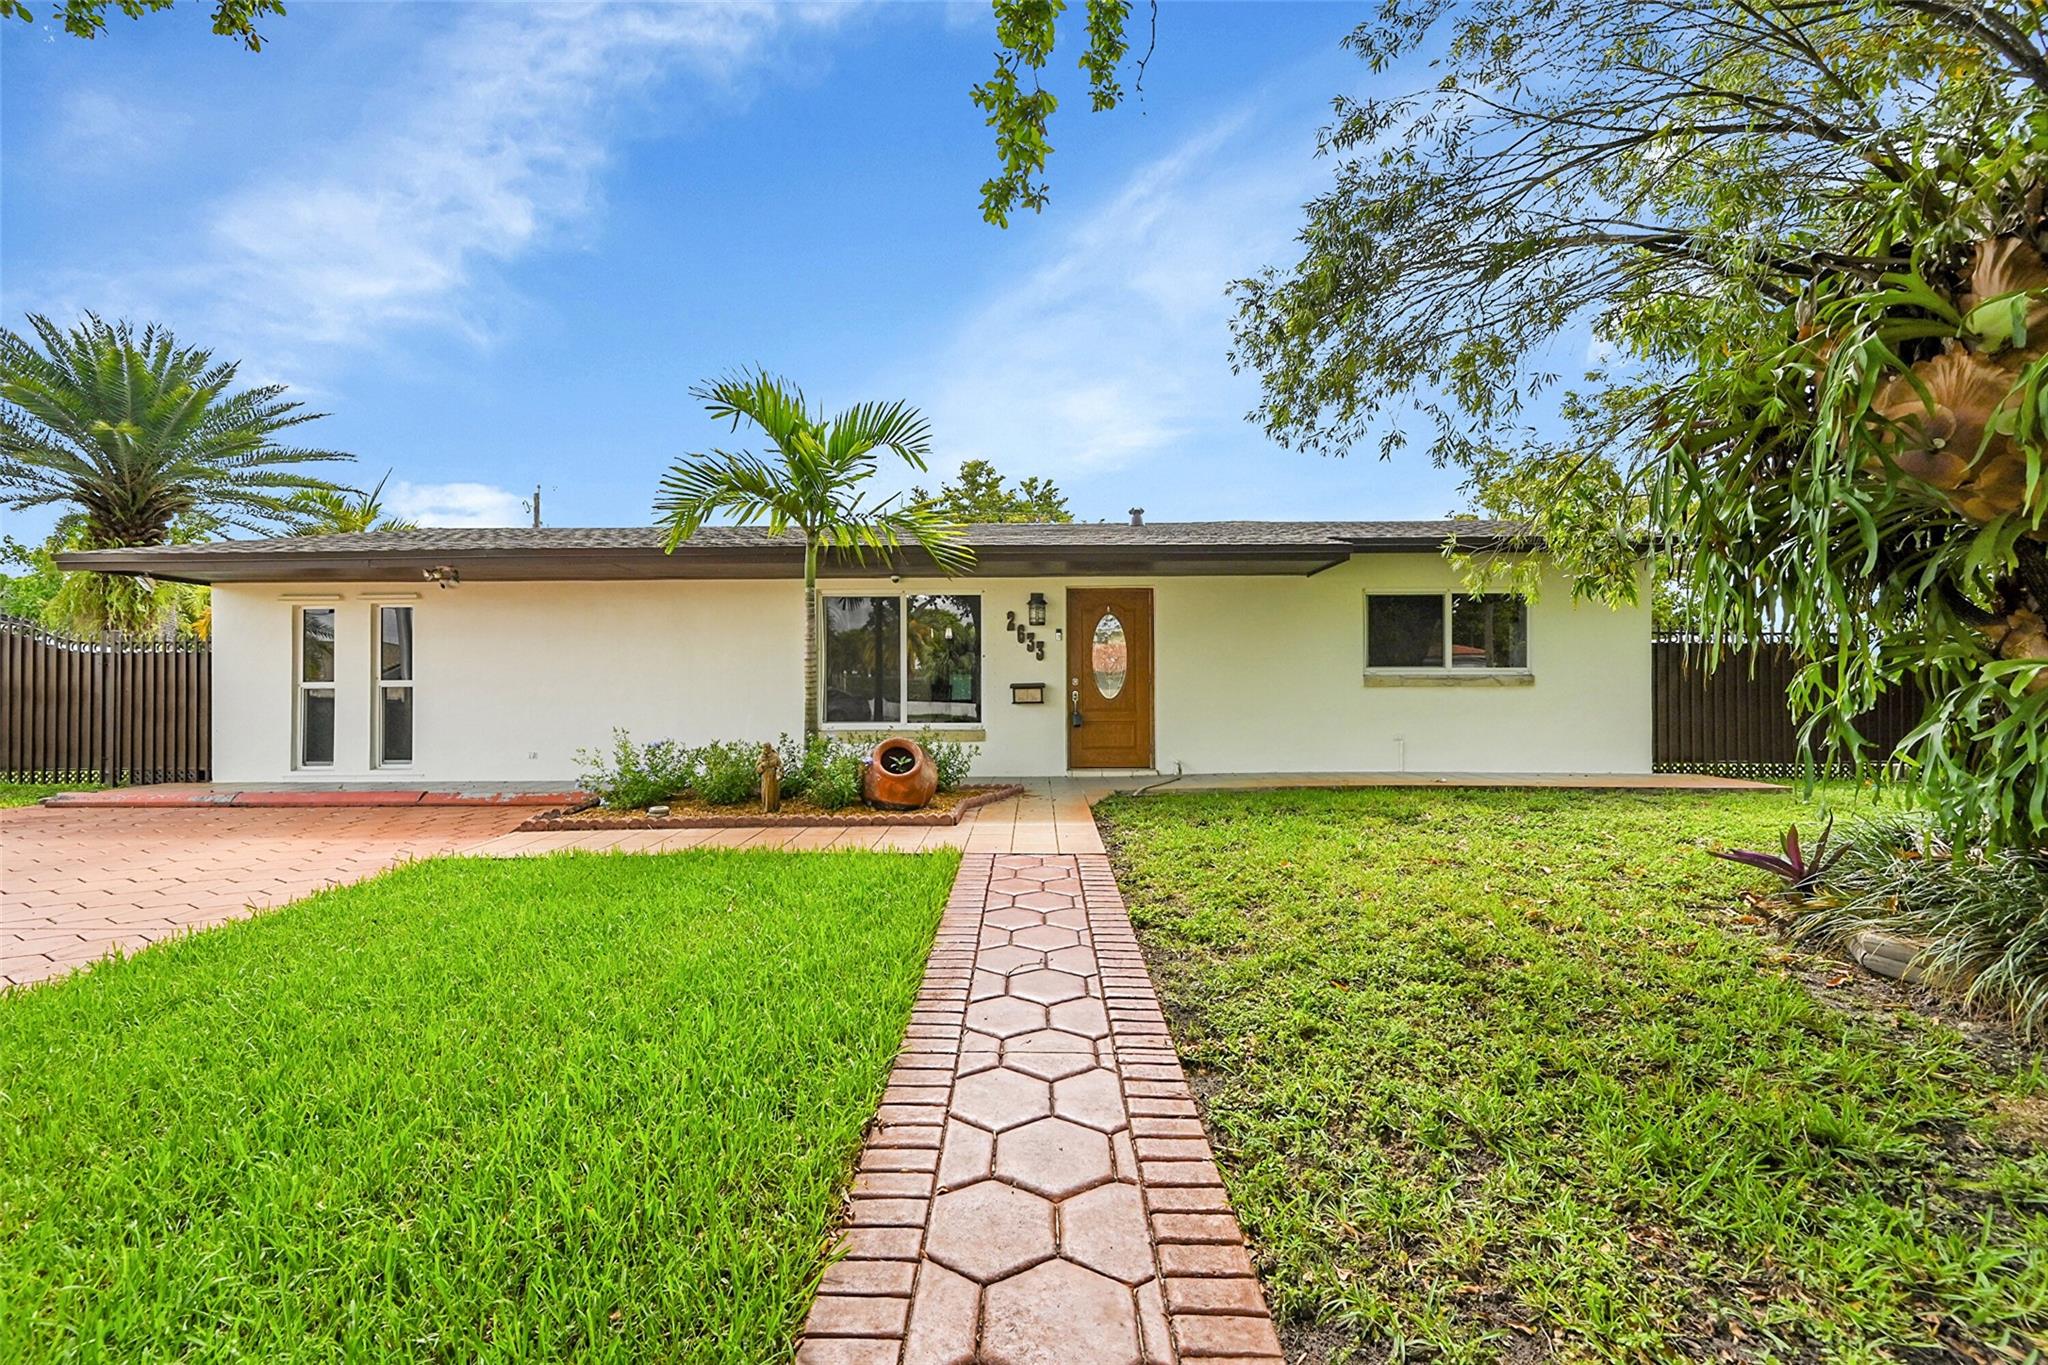
Active
$750,000
3
bds
|
2
ba
|
2,385
sqft
|
built
1968
2633 SW 127th Ave, Miami, FL 33175
$-1,695
Cash flow
-11.8%
Cash-on-Cash Return
3.6%
Cap rate
0.5%
Rent to Value Ratio
Active
$239,000
2
bds
|
2
ba
|
1,197
sqft
|
built
1973
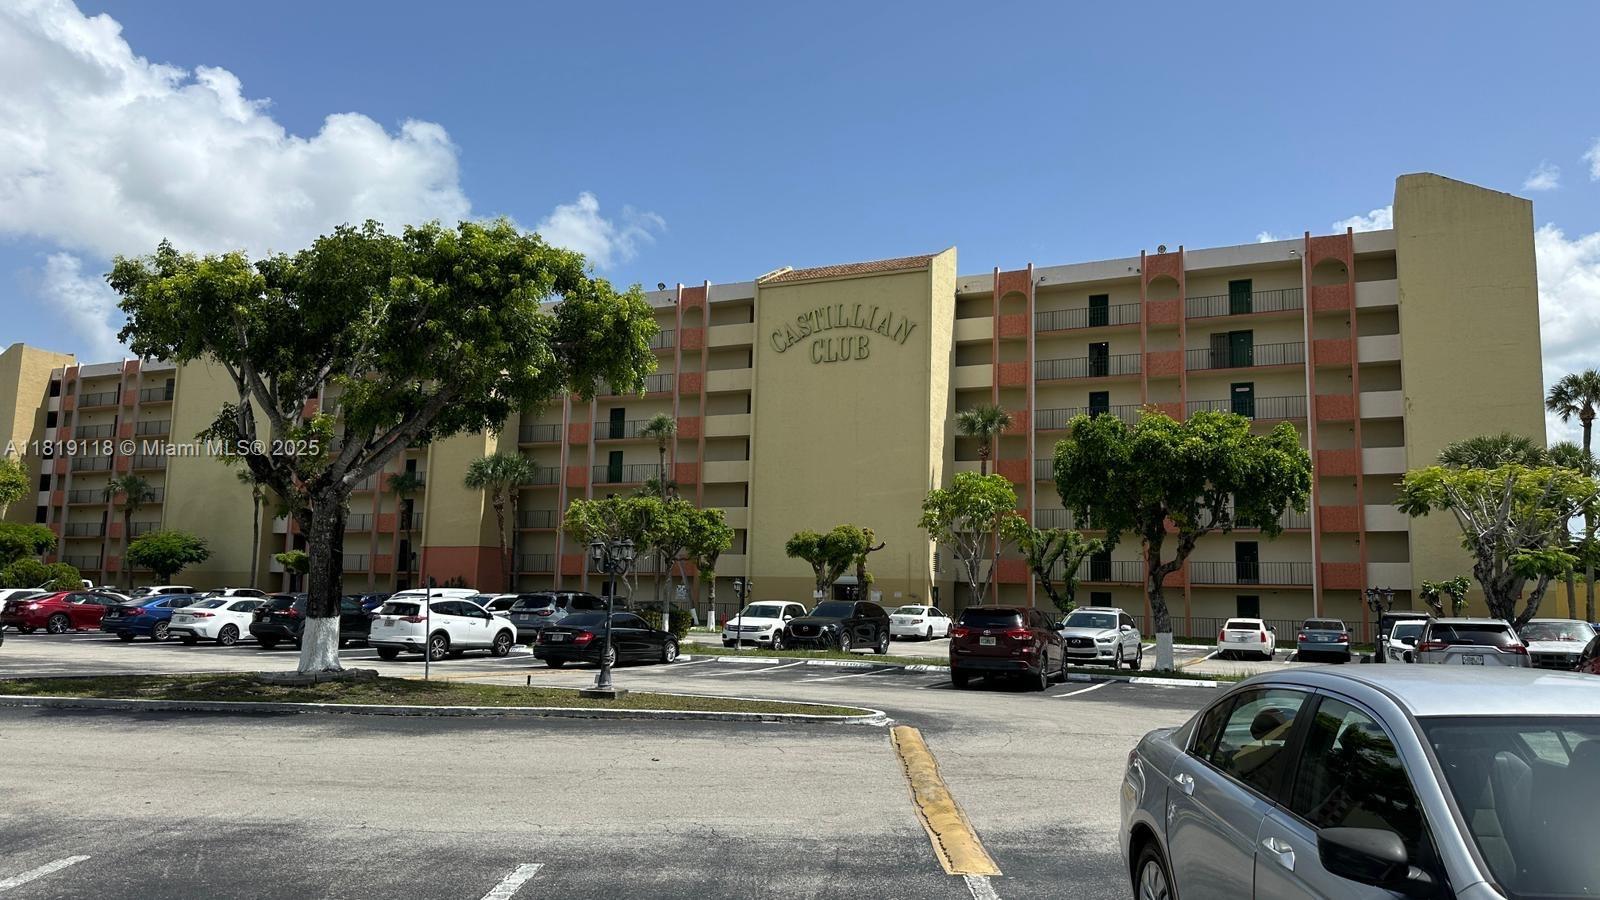
665 NE 195th St, Miami, FL 33179
$-460
Cash flow
-10.0%
Cash-on-Cash Return
4.0%
Cap rate
1.0%
Rent to Value Ratio
Active
$949,999
3
bds
|
2
ba
|
1,450
sqft
|
built
1960
9770 SW 13th Ter, Miami, FL 33174
$-3,148
Cash flow
-17.3%
Cash-on-Cash Return
2.3%
Cap rate
0.4%
Rent to Value Ratio
Active under contract
$599,000
4
bds
|
3
ba
|
2,050
sqft
|
built
2008
11860 SW 154th Ave, Miami, FL 33196
$-1,663
Cash flow
-14.5%
Cash-on-Cash Return
3.0%
Cap rate
0.5%
Rent to Value Ratio
Active
$2,600,000
6
bds
|
2
ba
|
3,950
sqft
|
built
1957
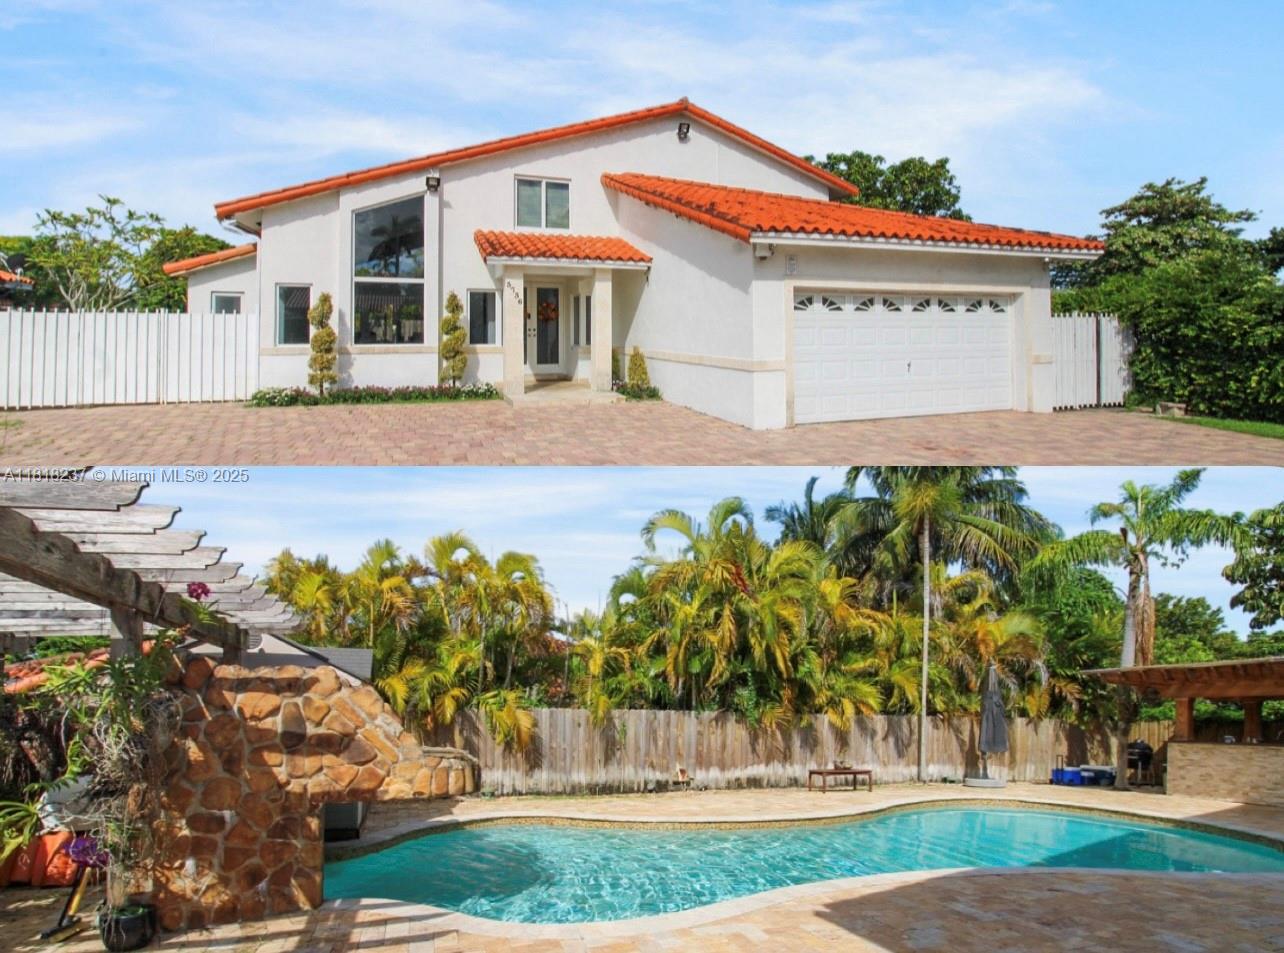
12445 SW 46th St, Miami, FL 33175
$-10,803
Cash flow
-21.7%
Cash-on-Cash Return
1.3%
Cap rate
0.3%
Rent to Value Ratio
Active
$1,189,000
6
bds
|
0
ba
|
2,992
sqft
|
built
1977
2617 NW 23rd Ave, Miami, FL 33142
$-5,010
Cash flow
-22.0%
Cash-on-Cash Return
1.2%
Cap rate
0.2%
Rent to Value Ratio
Active
$850,000
5
bds
|
4
ba
|
2,382
sqft
|
built
2012
18250 SW 152nd Ave, Miami, FL 33187
$-4,436
Cash flow
-27.2%
Cash-on-Cash Return
0.0%
Cap rate
0.2%
Rent to Value Ratio
Active
$1,990,000
3
bds
|
4
ba
|
1,634
sqft
|
built
2018
3131 NE 7th Ave, Miami, FL 33137
$-8,423
Cash flow
-22.1%
Cash-on-Cash Return
1.2%
Cap rate
0.5%
Rent to Value Ratio
Active
$697,000
4
bds
|
3
ba
|
2,112
sqft
|
built
2002
13425 SW 122nd Ave, Miami, FL 33186
$-1,896
Cash flow
-14.2%
Cash-on-Cash Return
3.0%
Cap rate
0.6%
Rent to Value Ratio
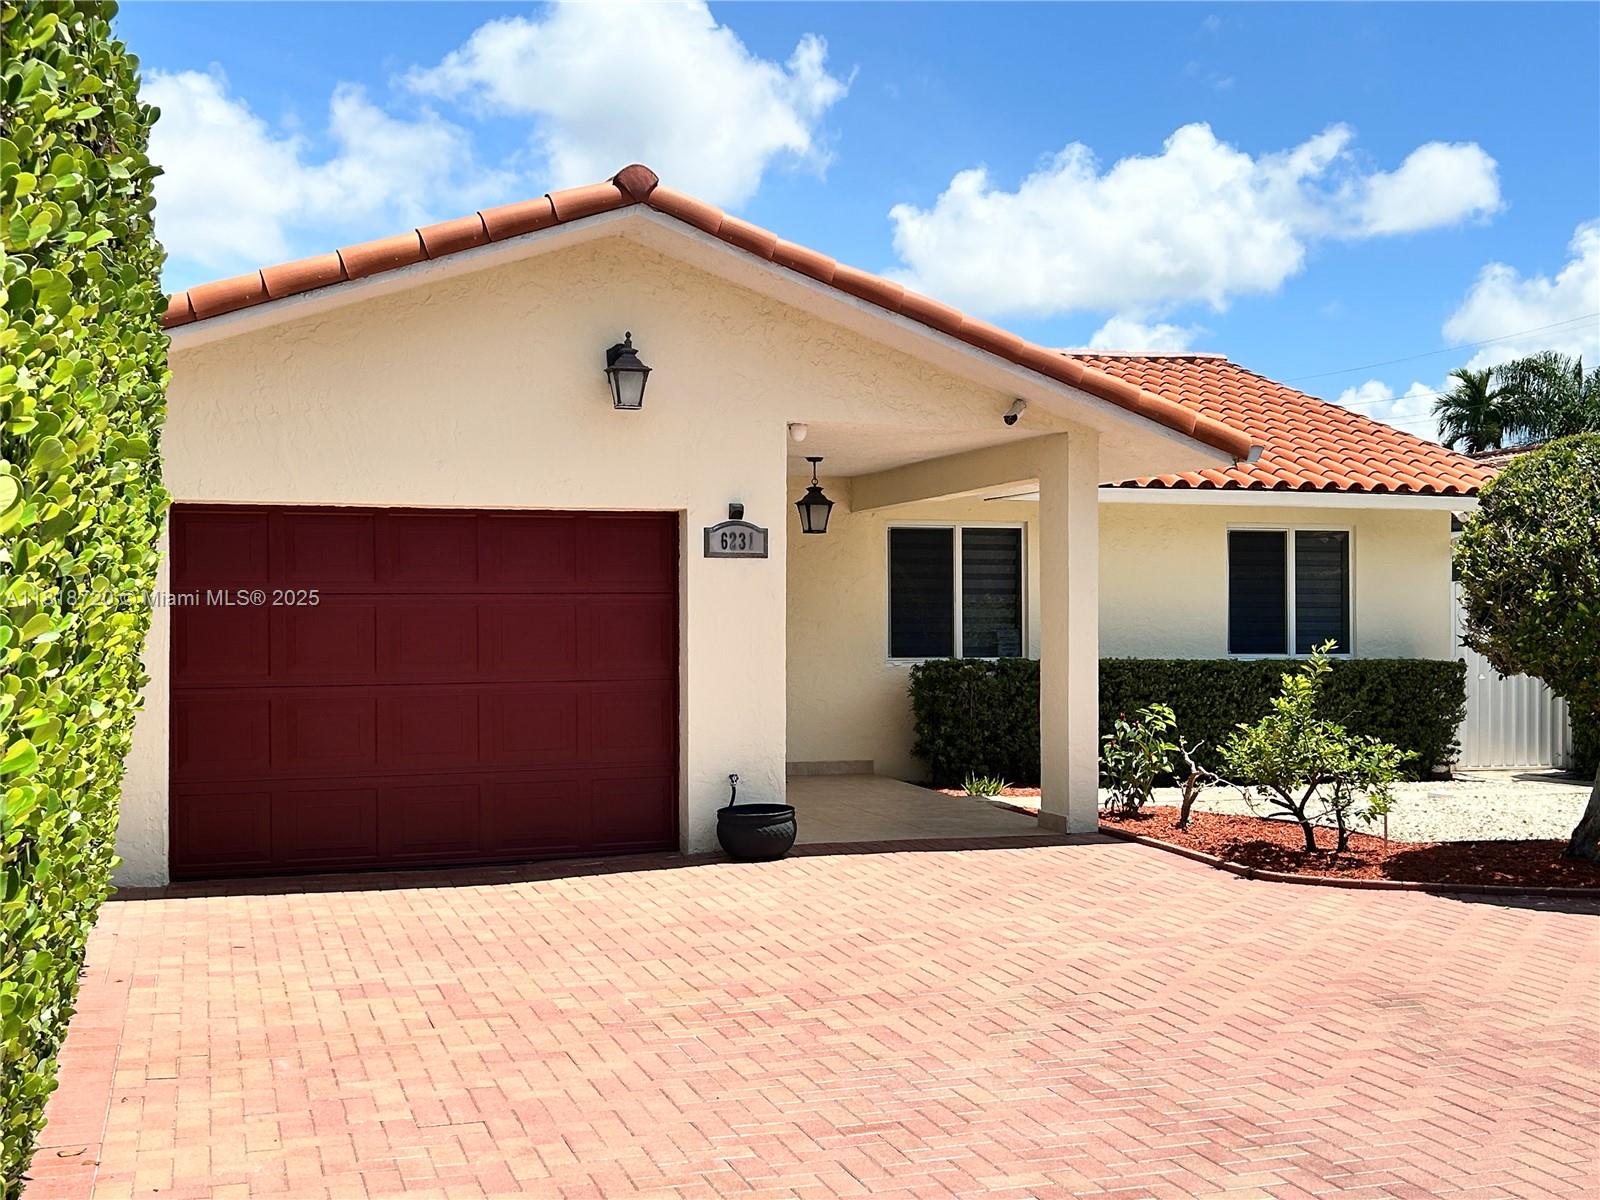
Active
$999,000
4
bds
|
4
ba
|
2,060
sqft
|
built
1979
6231 SW 27th St, Miami, FL 33155
$-2,277
Cash flow
-11.9%
Cash-on-Cash Return
3.6%
Cap rate
0.5%
Rent to Value Ratio
Active
$1,999,999
6
bds
|
6
ba
|
2,851
sqft
|
built
1988
3736 SW 107th Ct, Miami, FL 33165
$-7,503
Cash flow
-19.6%
Cash-on-Cash Return
1.8%
Cap rate
0.3%
Rent to Value Ratio
Active
$922,500
5
bds
|
0
ba
|
2,390
sqft
|
built
1976
3421 SW 4th St, Miami, FL 33135
$-4,102
Cash flow
-23.2%
Cash-on-Cash Return
1.0%
Cap rate
0.3%
Rent to Value Ratio
Active
$1,150,000
1
bds
|
0
ba
|
1,991
sqft
|
built
1920
3355 SW 22nd Ter, Miami, FL 33145
$-5,686
Cash flow
-25.8%
Cash-on-Cash Return
0.4%
Cap rate
0.2%
Rent to Value Ratio
Active
$870,000
3
bds
|
0
ba
|
1,686
sqft
|
built
1928
876 SW 2nd St, Miami, FL 33130
$-3,520
Cash flow
-21.1%
Cash-on-Cash Return
1.4%
Cap rate
0.3%
Rent to Value Ratio
Active
$353,000
2
bds
|
2
ba
|
896
sqft
|
built
1988
13900 SW 65th Ter, Miami, FL 33183
$-776
Cash flow
-11.5%
Cash-on-Cash Return
3.7%
Cap rate
0.7%
Rent to Value Ratio

Active
$379,500
2
bds
|
2
ba
|
885
sqft
|
built
1984
4840 SW 149th Ct, Miami, FL 33185
$-714
Cash flow
-9.8%
Cash-on-Cash Return
4.0%
Cap rate
0.7%
Rent to Value Ratio
Active
$215,000
2
bds
|
2
ba
|
900
sqft
|
built
1973
9455 W Flagler St, Miami, FL 33174
$3
Cash flow
0.1%
Cash-on-Cash Return
6.3%
Cap rate
1.1%
Rent to Value Ratio
Active
$600,000
4
bds
|
2
ba
|
1,593
sqft
|
built
1960
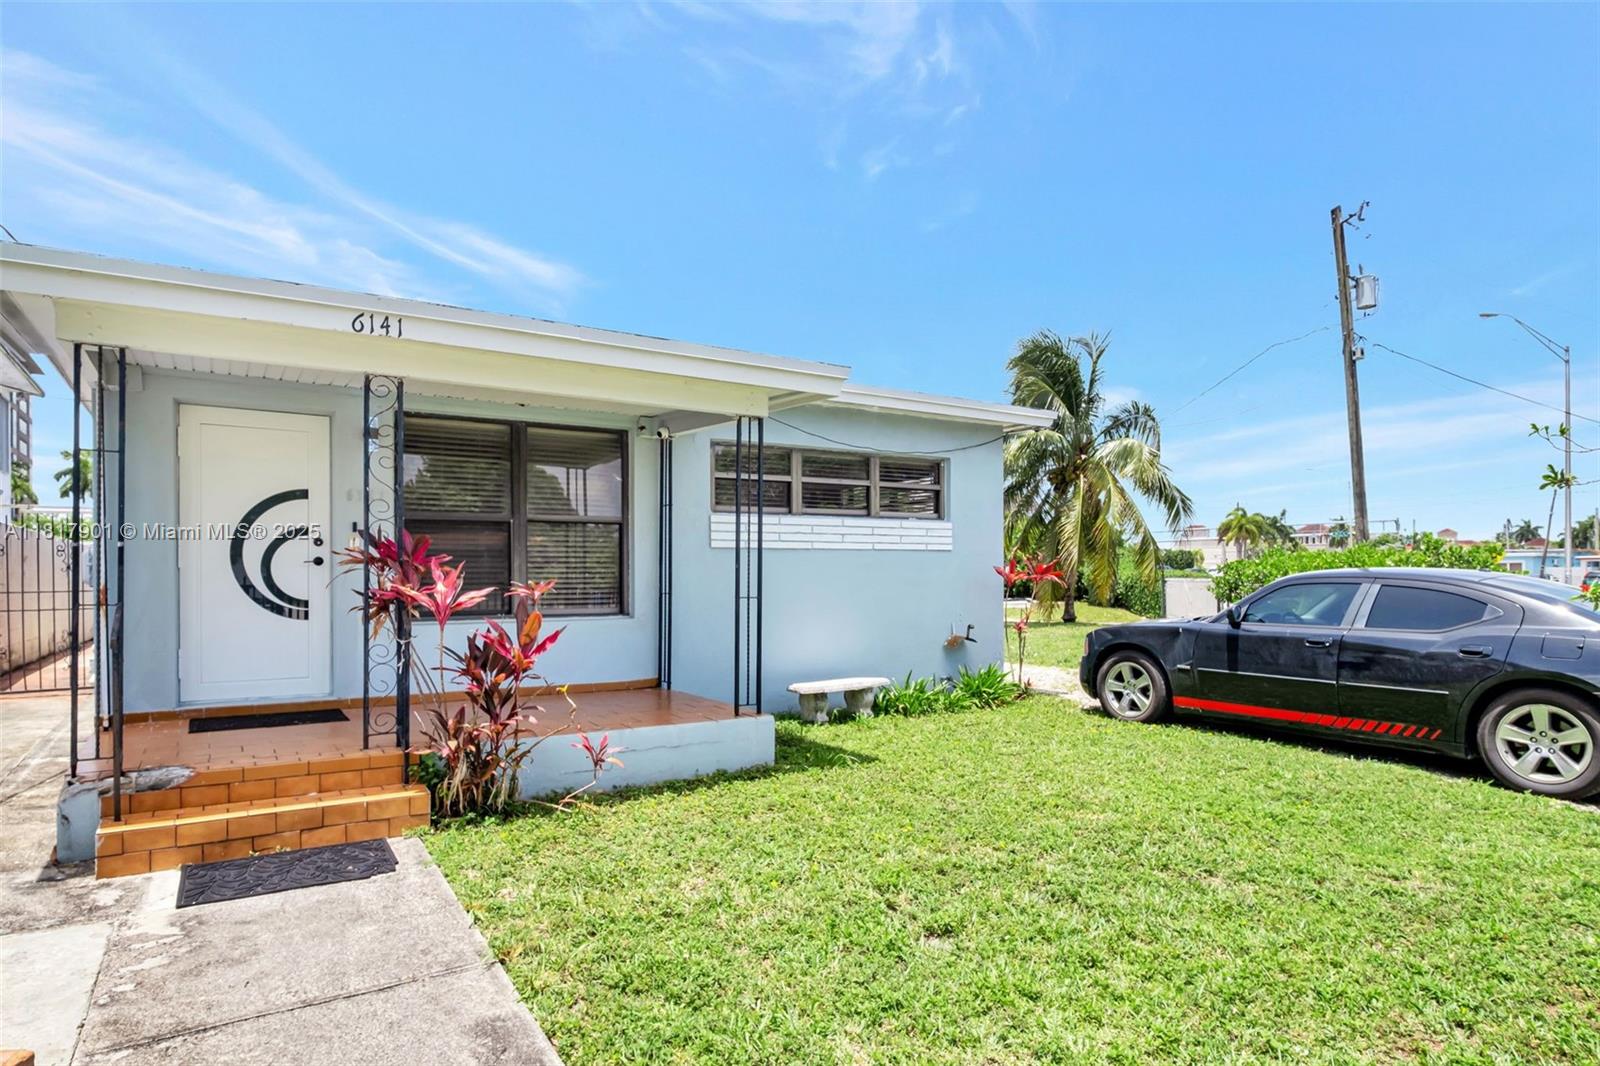
6141 NW 6th St, Miami, FL 33126
$-1,305
Cash flow
-11.3%
Cash-on-Cash Return
3.7%
Cap rate
0.6%
Rent to Value Ratio
Active
$1,200,000
3
bds
|
0
ba
|
1,962
sqft
|
built
1949
3072 SW 16th St, Miami, FL 33145
$-4,684
Cash flow
-20.4%
Cash-on-Cash Return
1.6%
Cap rate
0.3%
Rent to Value Ratio
Active
$680,000
5
bds
|
3
ba
|
1,917
sqft
|
built
1937
2708 NW 22nd Ct, Miami, FL 33142
$-1,970
Cash flow
-15.1%
Cash-on-Cash Return
2.8%
Cap rate
0.5%
Rent to Value Ratio

Active
$519,000
3
bds
|
1
ba
|
936
sqft
|
built
1950
14940 Monroe St, Miami, FL 33176
$-1,392
Cash flow
-14.0%
Cash-on-Cash Return
3.1%
Cap rate
0.5%
Rent to Value Ratio
Active
$950,000
bds
|
1
ba
|
624
sqft
|
built
2003
1435 Brickell Ave, Miami, FL 33131
$-3,473
Cash flow
-19.1%
Cash-on-Cash Return
1.9%
Cap rate
0.5%
Rent to Value Ratio
Active
$285,000
2
bds
|
2
ba
|
1,176
sqft
|
built
1974
245 NW 109th Ave, Miami, FL 33172
$-141
Cash flow
-2.6%
Cash-on-Cash Return
5.7%
Cap rate
0.9%
Rent to Value Ratio
Active
$649,999
4
bds
|
2
ba
|
1,530
sqft
|
built
1940
1426 NW 28th St, Miami, FL 33142
$-2,126
Cash flow
-17.1%
Cash-on-Cash Return
2.4%
Cap rate
0.4%
Rent to Value Ratio
Active
$335,000
0
bds
|
1
ba
|
567
sqft
|
built
2007
50 Biscayne Blvd, Miami, FL 33132
$-838
Cash flow
-13.1%
Cash-on-Cash Return
3.3%
Cap rate
0.9%
Rent to Value Ratio

Active
$695,000
2
bds
|
2
ba
|
1,362
sqft
|
built
1975
1865 Brickell Ave, Miami, FL 33129
$-2,749
Cash flow
-20.6%
Cash-on-Cash Return
1.5%
Cap rate
0.6%
Rent to Value Ratio
Active
$599,000
3
bds
|
2
ba
|
1,349
sqft
|
built
1999
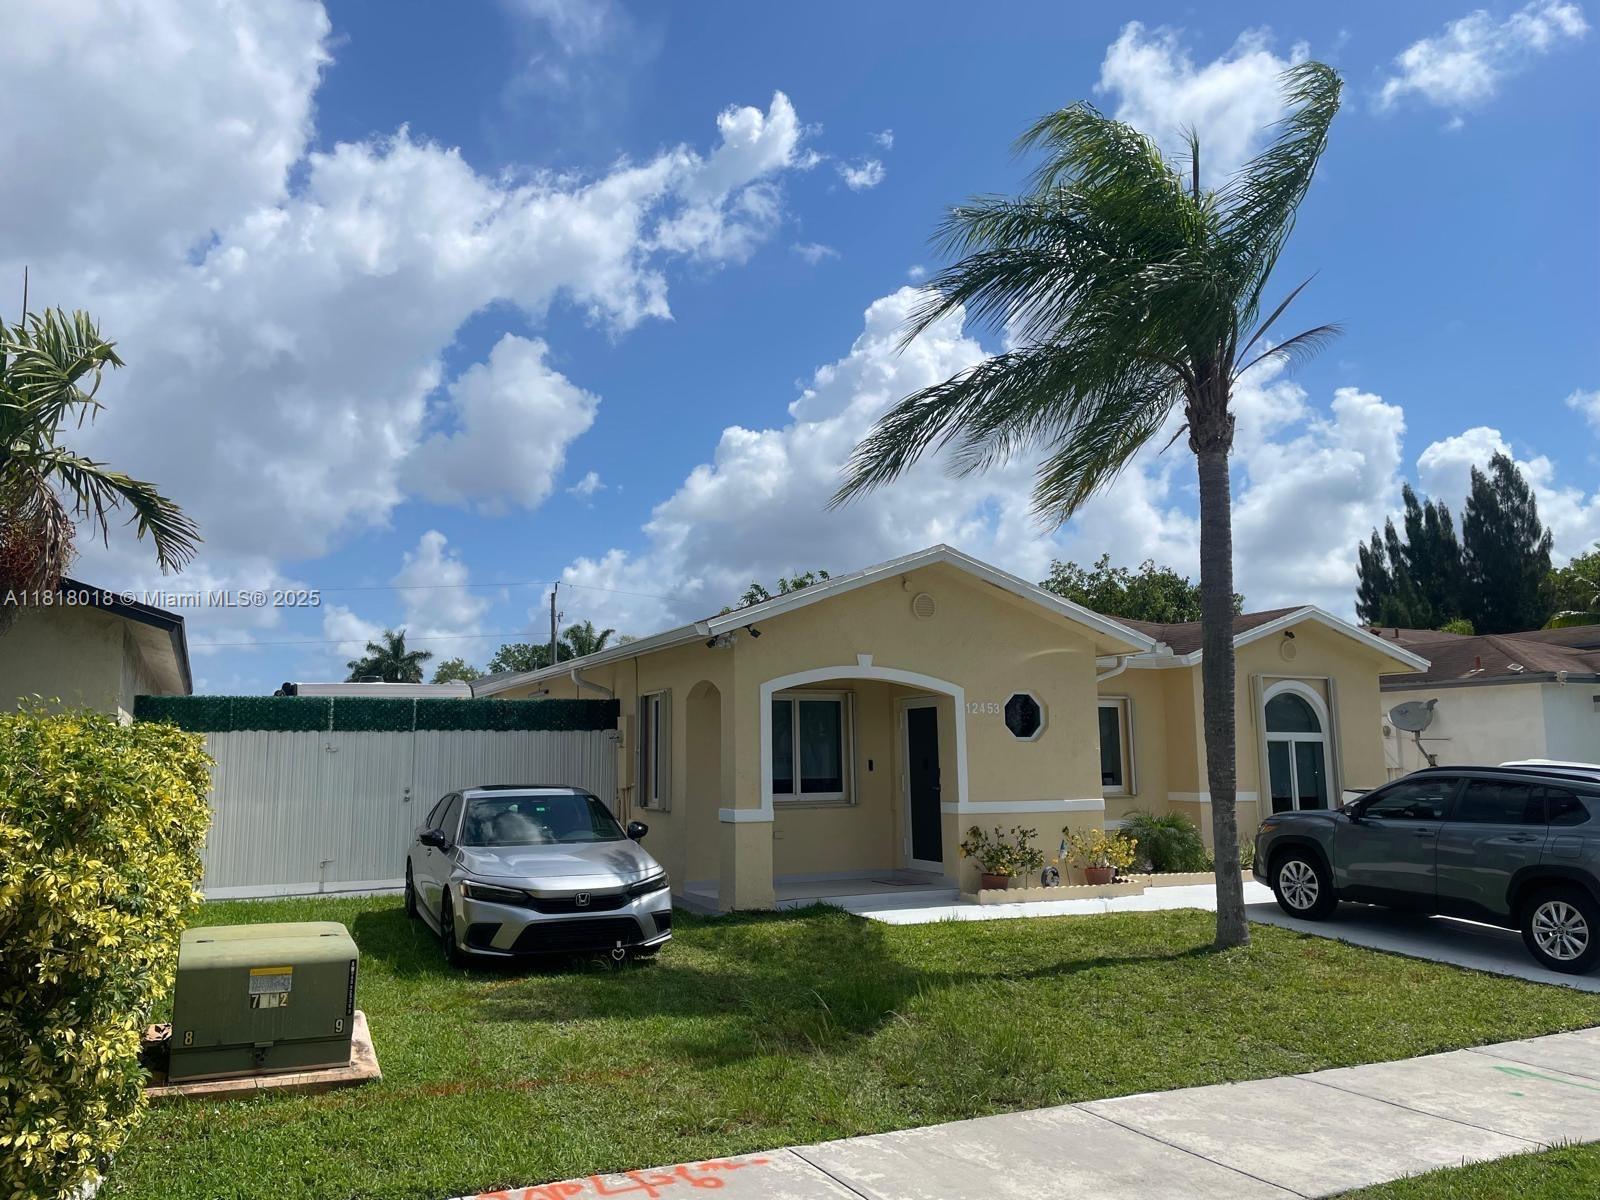
12453 SW 197th Ter, Miami, FL 33177
$-1,299
Cash flow
-11.3%
Cash-on-Cash Return
3.7%
Cap rate
0.5%
Rent to Value Ratio
Active
$2,800,000
6
bds
|
6
ba
|
4,845
sqft
|
built
1993
8200 SW 92nd St, Miami, FL 33156
$-14,143
Cash flow
-26.4%
Cash-on-Cash Return
0.2%
Cap rate
0.1%
Rent to Value Ratio

Active
$725,000
3
bds
|
2
ba
|
1,938
sqft
|
built
1971
9401 SW 78th St, Miami, FL 33173
$-1,364
Cash flow
-9.8%
Cash-on-Cash Return
4.0%
Cap rate
0.5%
Rent to Value Ratio

Active
$679,900
4
bds
|
2
ba
|
1,343
sqft
|
built
1981
7115 SW 147th Ct, Miami, FL 33193
$-1,763
Cash flow
-13.5%
Cash-on-Cash Return
3.2%
Cap rate
0.5%
Rent to Value Ratio
Active
$749,000
2
bds
|
3
ba
|
1,123
sqft
|
built
2007
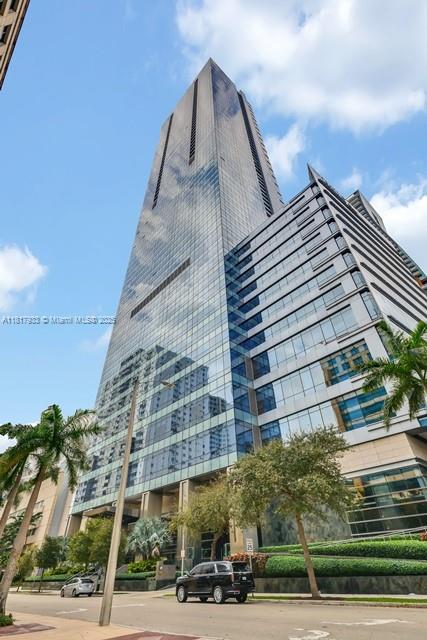
1040 Biscayne Blvd, Miami, FL 33132
$-2,733
Cash flow
-19.0%
Cash-on-Cash Return
1.9%
Cap rate
0.7%
Rent to Value Ratio
Active
$299,900
2
bds
|
2
ba
|
924
sqft
|
built
1981
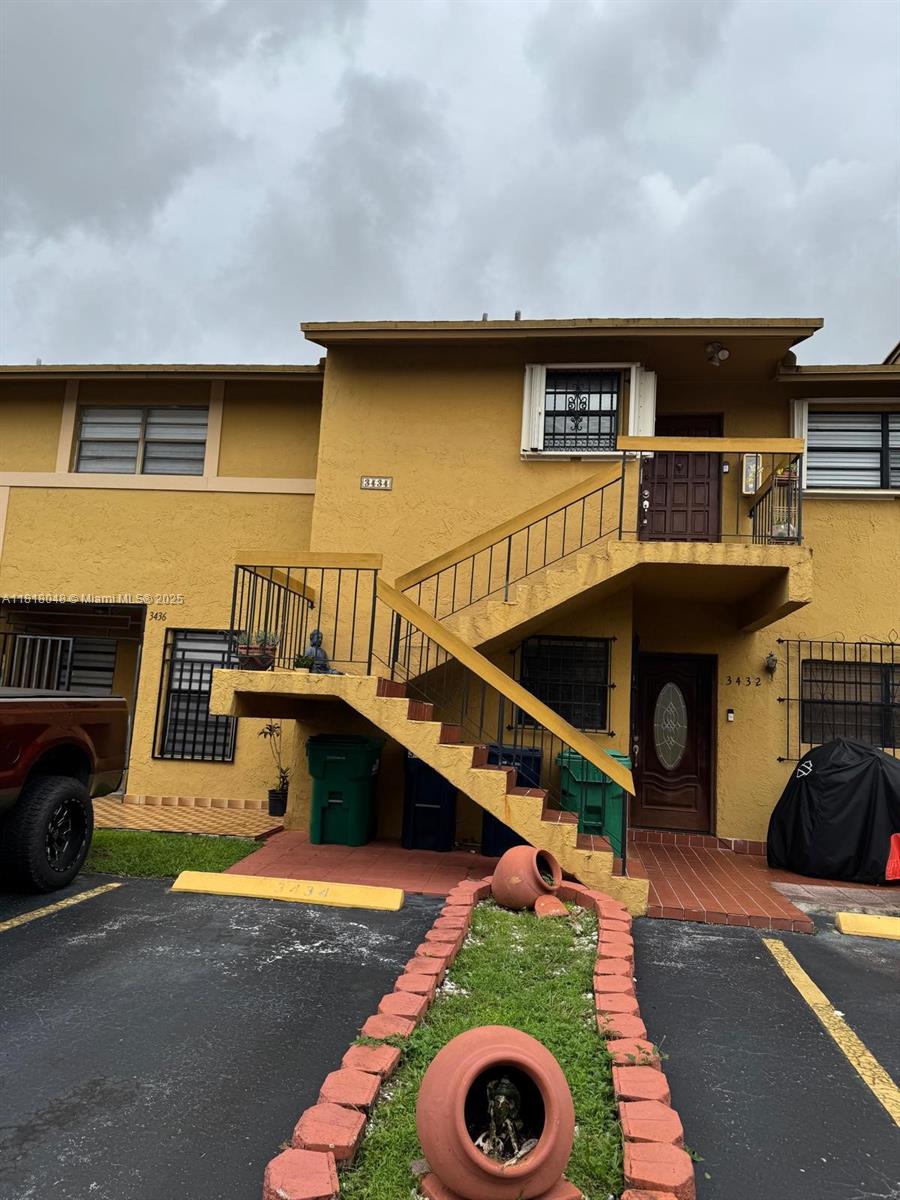
3434 SW 112th Ave, Miami, FL 33165
$-199
Cash flow
-3.5%
Cash-on-Cash Return
5.5%
Cap rate
0.8%
Rent to Value Ratio
Active
$449,000
1
bds
|
1
ba
|
628
sqft
|
built
2008
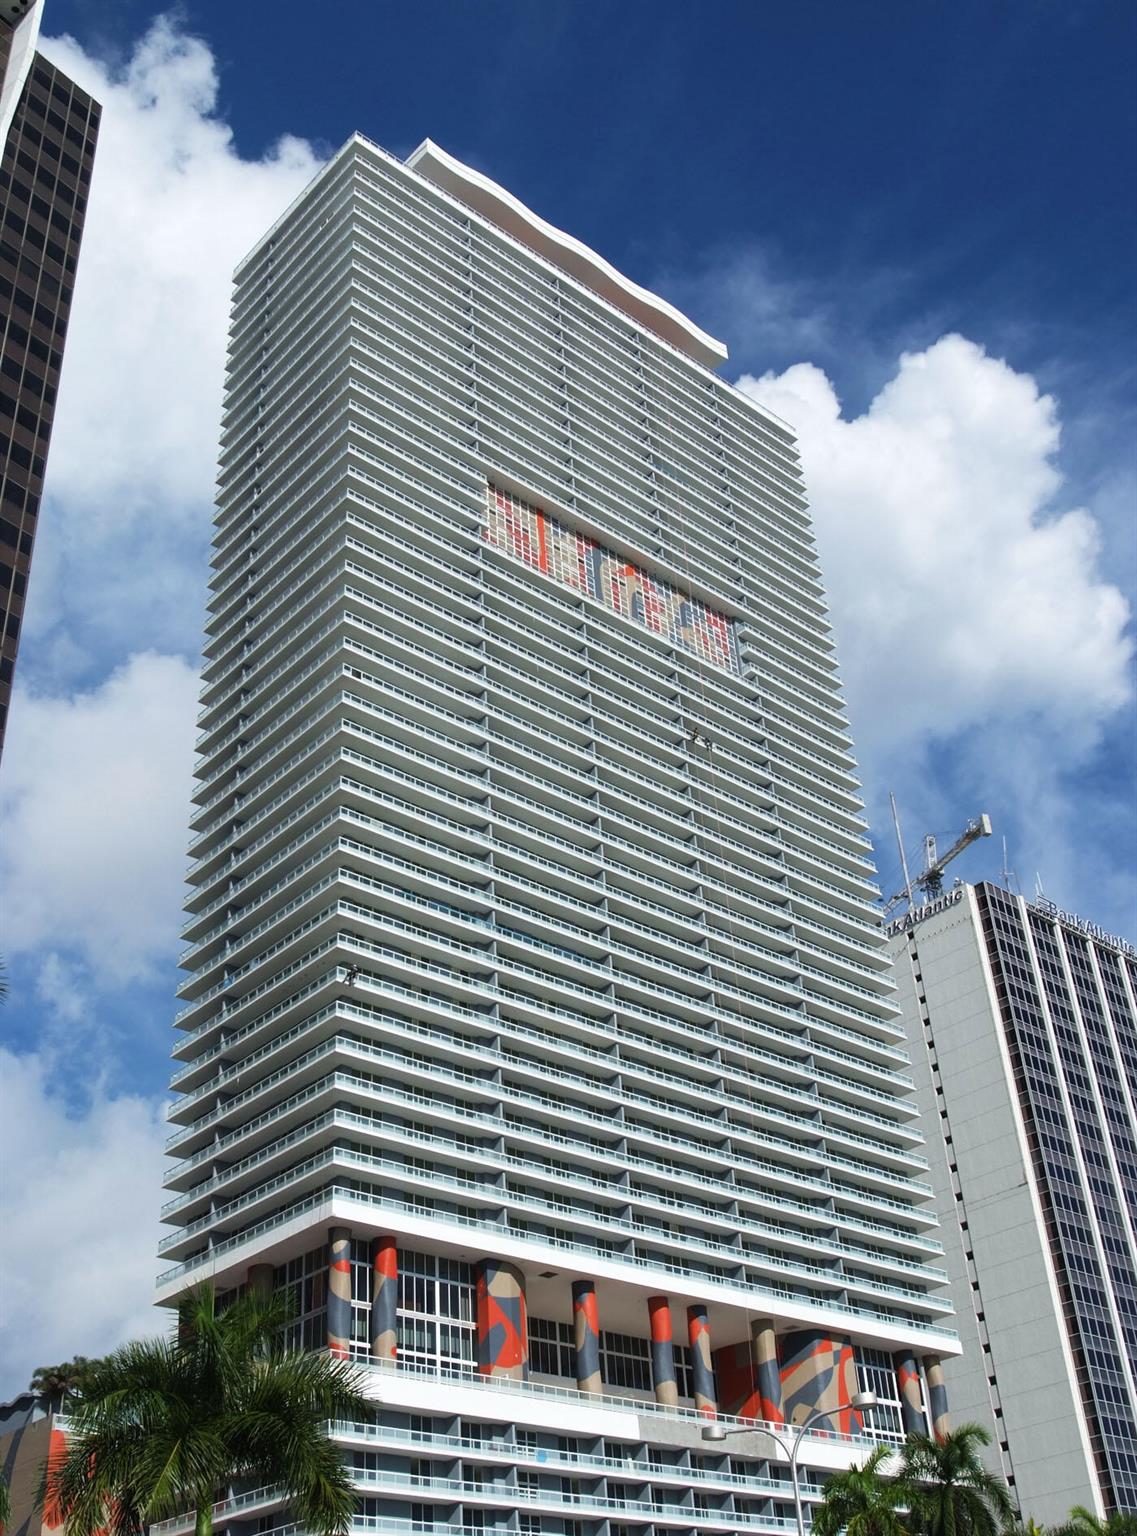
950 Brickell Bay Dr, Miami, FL 33131
$-1,488
Cash flow
-17.3%
Cash-on-Cash Return
2.3%
Cap rate
0.7%
Rent to Value Ratio
Active
$685,000
3
bds
|
3
ba
|
2,048
sqft
|
built
1990
10290 SW 139th Ct, Miami, FL 33186
$-2,006
Cash flow
-15.3%
Cash-on-Cash Return
2.8%
Cap rate
0.5%
Rent to Value Ratio

Active
$385,000
1
bds
|
1
ba
|
760
sqft
|
built
2004
2000 N Bayshore Dr, Miami, FL 33137
$-1,421
Cash flow
-19.3%
Cash-on-Cash Return
1.9%
Cap rate
0.7%
Rent to Value Ratio
Active
$1,250,000
3
bds
|
3
ba
|
1,334
sqft
|
built
2018
801 S Miami Ave, Miami, FL 33130
$-4,239
Cash flow
-17.7%
Cash-on-Cash Return
2.2%
Cap rate
0.7%
Rent to Value Ratio
Active
$325,000
2
bds
|
2
ba
|
1,075
sqft
|
built
1990
10421 SW 157th Pl, Miami, FL 33196
$-720
Cash flow
-11.6%
Cash-on-Cash Return
3.6%
Cap rate
0.8%
Rent to Value Ratio
Active
$156,999
1
bds
|
1
ba
|
496
sqft
|
built
1971
1525 NW 19th Ter, Miami, FL 33125
$-25
Cash flow
-0.8%
Cash-on-Cash Return
6.1%
Cap rate
1.1%
Rent to Value Ratio
Active
$870,000
4
bds
|
0
ba
|
2,399
sqft
|
built
1952
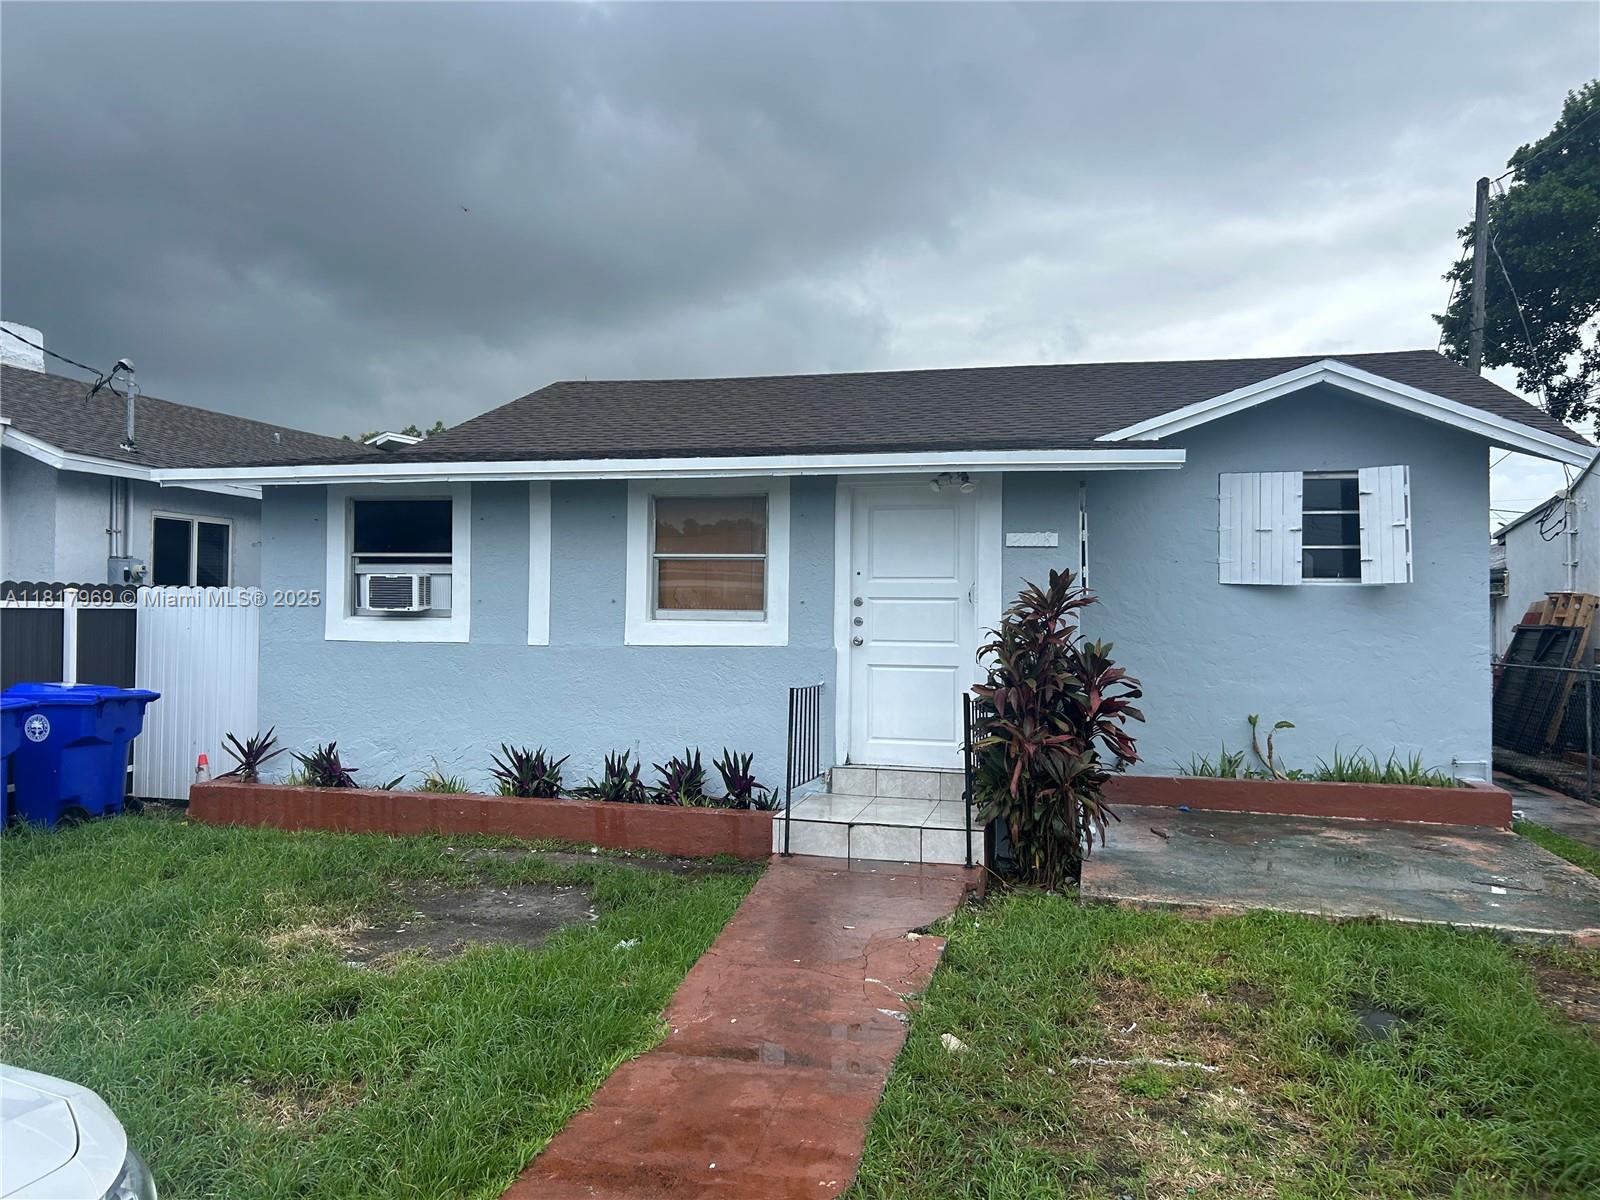
2215 NW 33rd St, Miami, FL 33142
$-3,721
Cash flow
-22.3%
Cash-on-Cash Return
1.2%
Cap rate
0.3%
Rent to Value Ratio
Active under contract
$262,500
2
bds
|
2
ba
|
1,075
sqft
|
built
1969
7715 SW 86th St, Miami, FL 33143
$-661
Cash flow
-13.1%
Cash-on-Cash Return
3.3%
Cap rate
1.0%
Rent to Value Ratio