Moore, OK Investment Properties for Sale
Browse homes for sale and investment properties in Moore, OK. Refine your search by price, property type, or more.
Best cash flowing properties in Moore, OK
Active
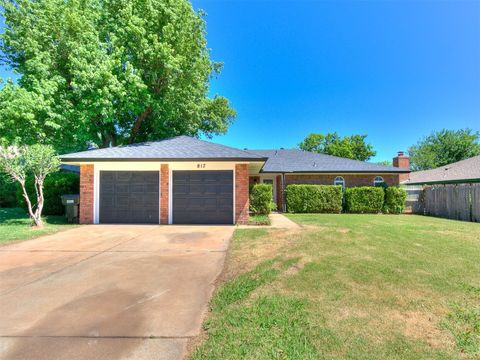
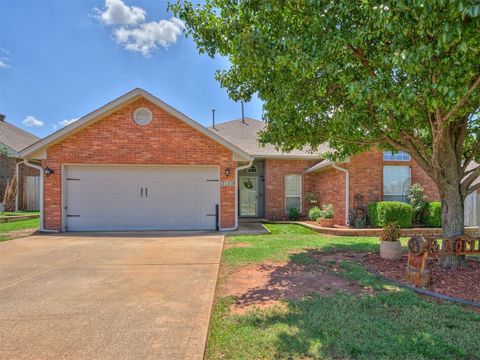
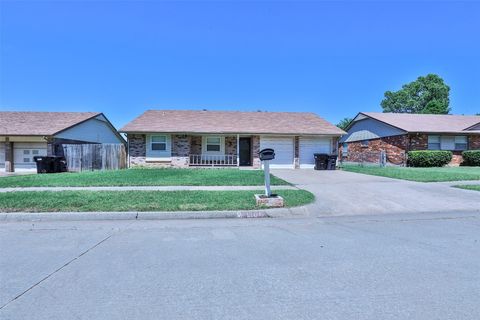
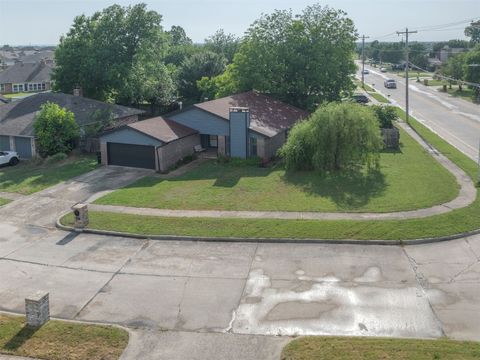
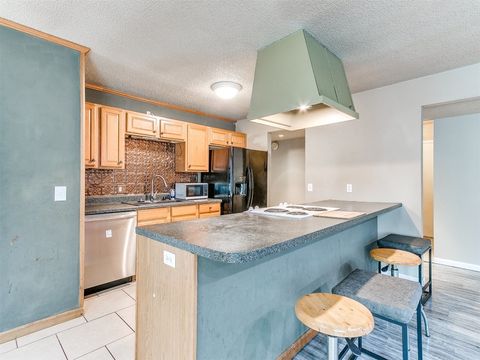
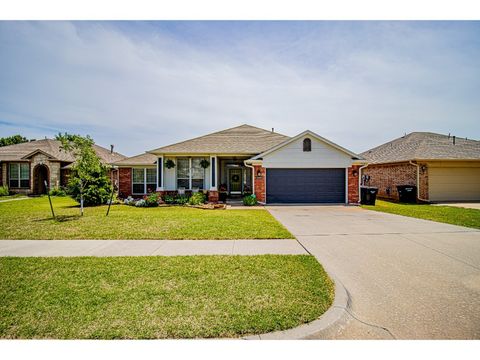
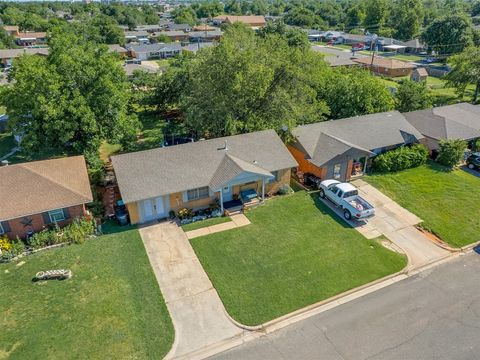
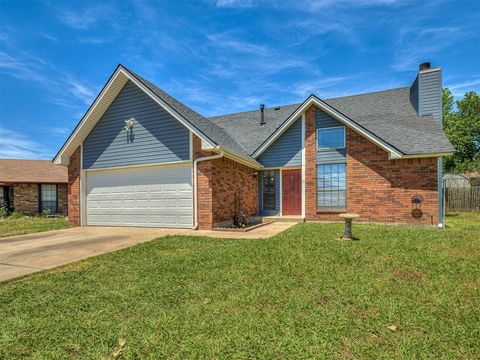
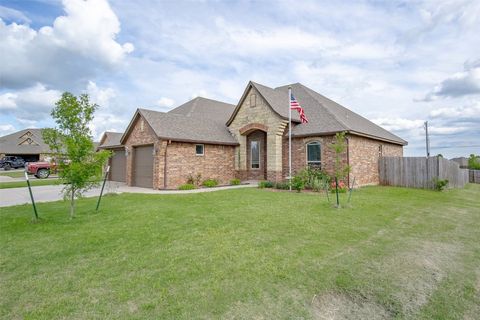
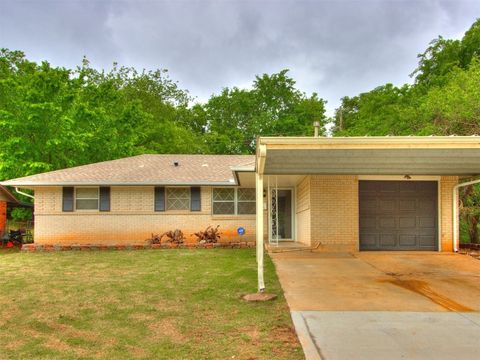
$229,000
3
bds
|
2
ba
|
0
sqft
|
built
1972
817 E Hills Dr, Moore, OK 73160
$141
Cash flow
3.2%
Cash-on-Cash Return
6.4%
Cap rate
0.9%
Rent to Value Ratio
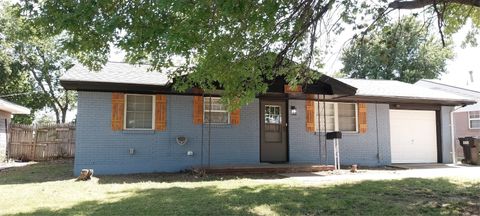
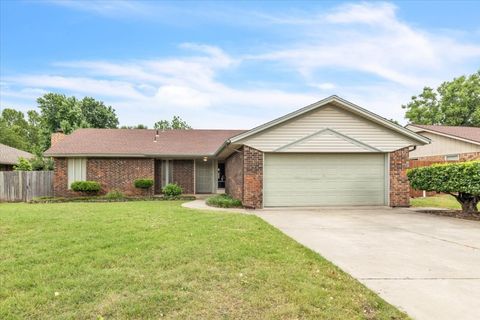
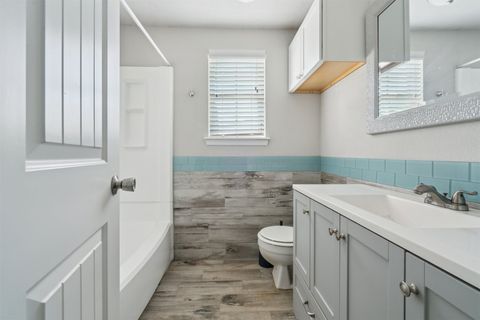
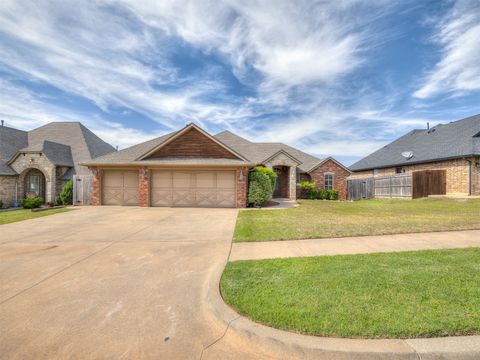
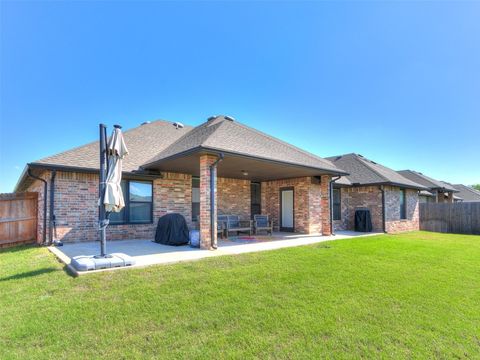
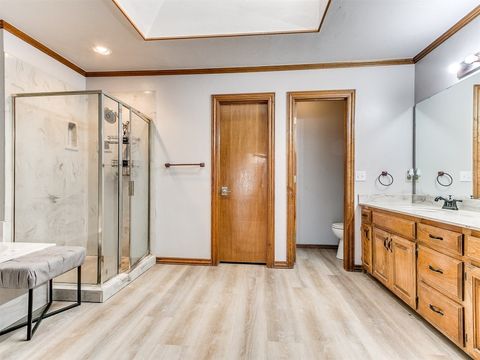
Active
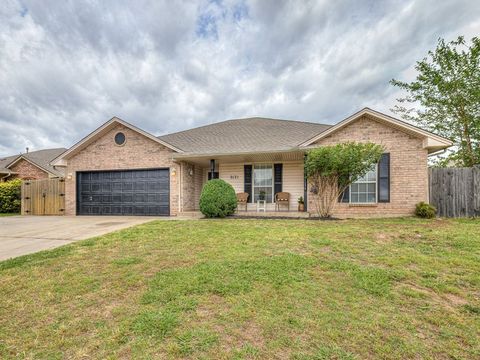
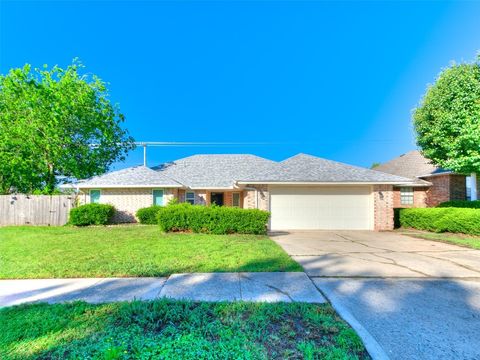
$159,000
3
bds
|
1
ba
|
0
sqft
|
built
1963
836 SE 9th St, Moore, OK 73160
$127
Cash flow
4.2%
Cash-on-Cash Return
6.6%
Cap rate
0.9%
Rent to Value Ratio
145 out of 186 properties for sale in Moore, OK
Limited Results Shown
Create a free account, or log in to reveal all property listings and enjoy the complete experience.
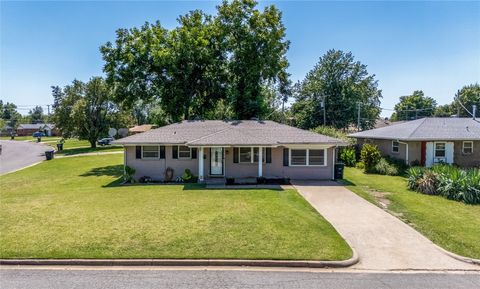
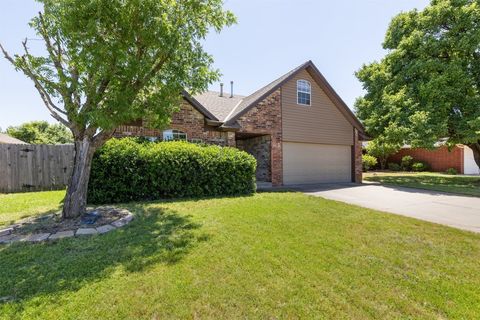
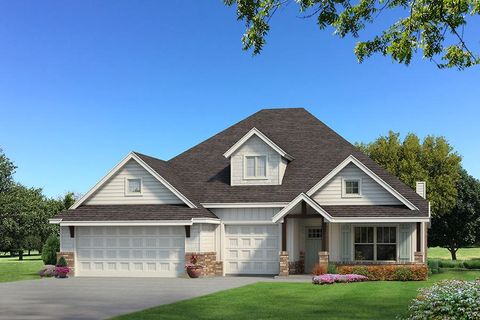
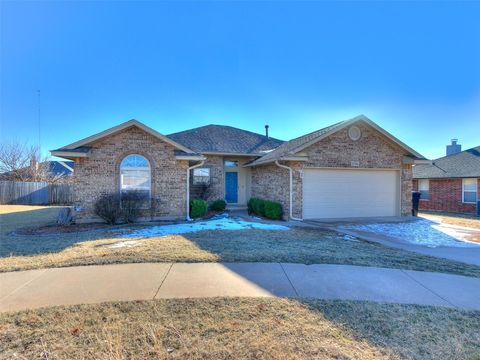
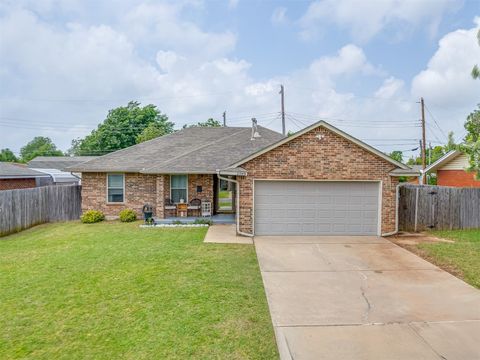
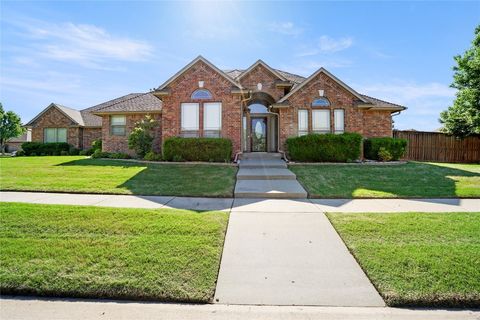
Active
$169,000
4
bds
|
1
ba
|
0
sqft
|
built
1964
840 NW 14th St, Moore, OK 73160
$4
Cash flow
0.1%
Cash-on-Cash Return
5.7%
Cap rate
0.8%
Rent to Value Ratio
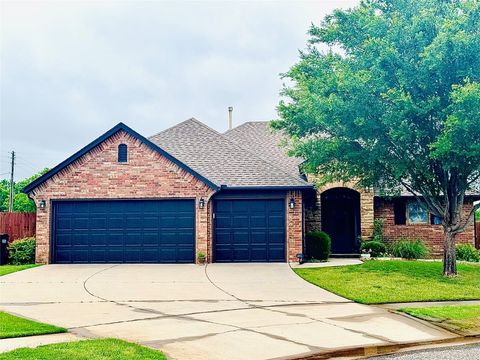
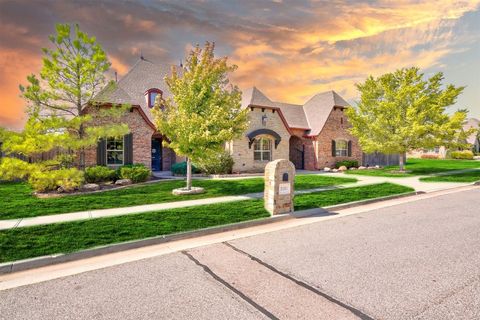
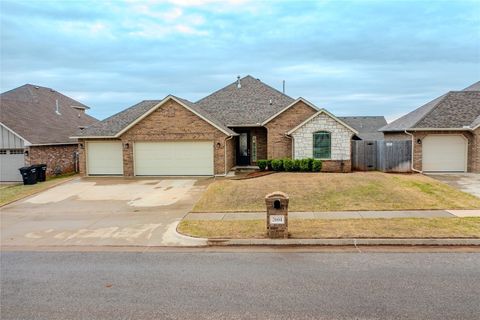
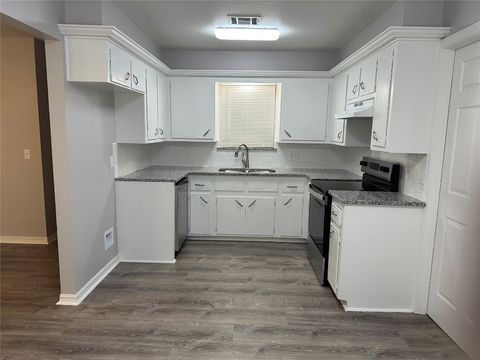
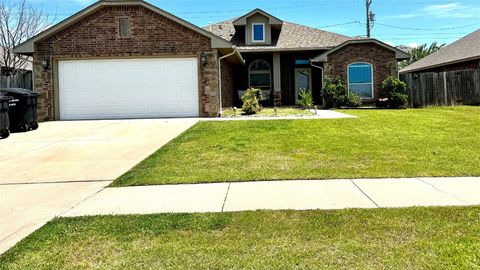
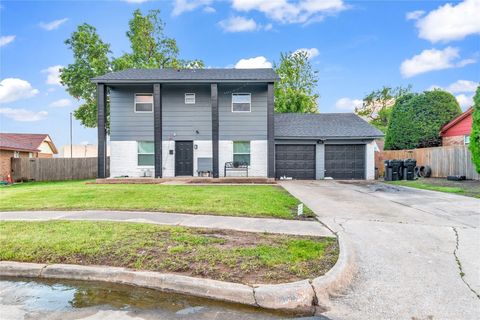
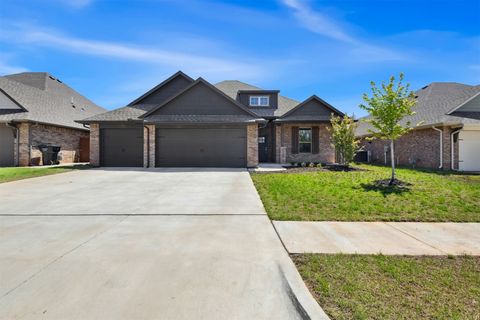
Active
$315,000
3
bds
|
2
ba
|
0
sqft
|
built
2012
3001 Flint Ct, Moore, OK 73165
$-710
Cash flow
-11.8%
Cash-on-Cash Return
3.0%
Cap rate
0.6%
Rent to Value Ratio
Pending
$259,900
3
bds
|
2
ba
|
0
sqft
|
built
2002
2120 NE 4th St, Moore, OK 73160
$-225
Cash flow
-4.5%
Cash-on-Cash Return
4.6%
Cap rate
0.7%
Rent to Value Ratio
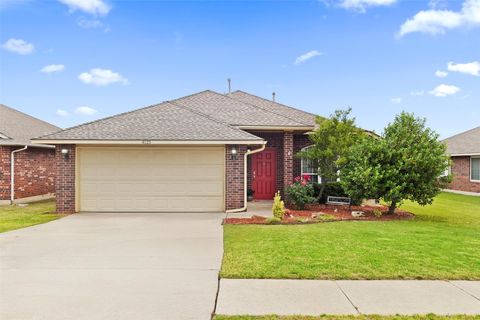
Active
$249,900
3
bds
|
2
ba
|
0
sqft
|
built
2000
2121 NE 13th St, Moore, OK 73160
$-292
Cash flow
-6.1%
Cash-on-Cash Return
4.3%
Cap rate
0.6%
Rent to Value Ratio
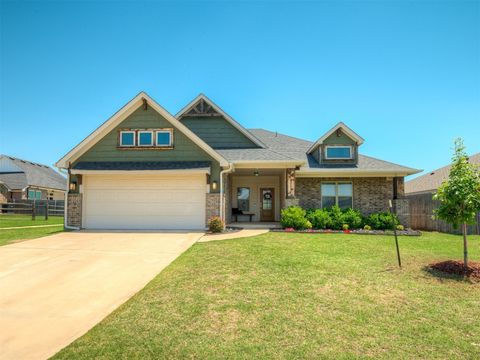
Active
$280,000
4
bds
|
3
ba
|
0
sqft
|
built
1993
316 SE 6th St, Moore, OK 73160
$-299
Cash flow
-5.6%
Cash-on-Cash Return
4.4%
Cap rate
0.7%
Rent to Value Ratio
Active
$659,000
4
bds
|
4
ba
|
0
sqft
|
built
2011
3101 Monica Ln, Moore, OK 73160
$-1,142
Cash flow
-9.0%
Cash-on-Cash Return
3.6%
Cap rate
0.6%
Rent to Value Ratio
Active
$199,900
3
bds
|
2
ba
|
0
sqft
|
built
1980
1101 S English Dr, Moore, OK 73160
$20
Cash flow
0.5%
Cash-on-Cash Return
5.8%
Cap rate
0.8%
Rent to Value Ratio
Active
$316,700
3
bds
|
2
ba
|
0
sqft
|
built
2019
2604 NE 16th St, Moore, OK 73160
$-482
Cash flow
-7.9%
Cash-on-Cash Return
3.9%
Cap rate
0.6%
Rent to Value Ratio
Pending
$250,000
4
bds
|
2
ba
|
0
sqft
|
built
2004
4125 Queens Dr, Moore, OK 73160
$-169
Cash flow
-3.5%
Cash-on-Cash Return
4.9%
Cap rate
0.7%
Rent to Value Ratio
Active
$229,000
3
bds
|
2
ba
|
0
sqft
|
built
1972
817 E Hills Dr, Moore, OK 73160
$141
Cash flow
3.2%
Cash-on-Cash Return
6.4%
Cap rate
0.9%
Rent to Value Ratio
Active
$460,000
4
bds
|
3
ba
|
0
sqft
|
built
2019
16112 Buffalo Dr, Moore, OK 73170
$-681
Cash flow
-7.7%
Cash-on-Cash Return
3.9%
Cap rate
0.6%
Rent to Value Ratio
Active
$230,000
3
bds
|
2
ba
|
0
sqft
|
built
1978
3501 Necia St, Moore, OK 73160
$-181
Cash flow
-4.1%
Cash-on-Cash Return
4.7%
Cap rate
0.7%
Rent to Value Ratio
Active
$206,000
3
bds
|
2
ba
|
0
sqft
|
built
1977
216 N English Dr, Moore, OK 73160
$-18
Cash flow
-0.5%
Cash-on-Cash Return
5.6%
Cap rate
0.8%
Rent to Value Ratio
Active
$228,500
3
bds
|
2
ba
|
0
sqft
|
built
1973
708 Cross Timbers Dr, Moore, OK 73160
$-89
Cash flow
-2.0%
Cash-on-Cash Return
5.2%
Cap rate
0.7%
Rent to Value Ratio
Active
$200,000
3
bds
|
2
ba
|
0
sqft
|
built
1984
1662 NE 6th St, Moore, OK 73160
$-47
Cash flow
-1.2%
Cash-on-Cash Return
5.4%
Cap rate
0.8%
Rent to Value Ratio
Active
$330,000
5
bds
|
3
ba
|
0
sqft
|
built
2006
708 Ashwood Ln, Moore, OK 73160
$-342
Cash flow
-5.4%
Cash-on-Cash Return
4.4%
Cap rate
0.7%
Rent to Value Ratio
Active
$335,000
3
bds
|
2
ba
|
0
sqft
|
built
2009
2801 SE 5th St, Moore, OK 73160
$-366
Cash flow
-5.7%
Cash-on-Cash Return
4.4%
Cap rate
0.7%
Rent to Value Ratio
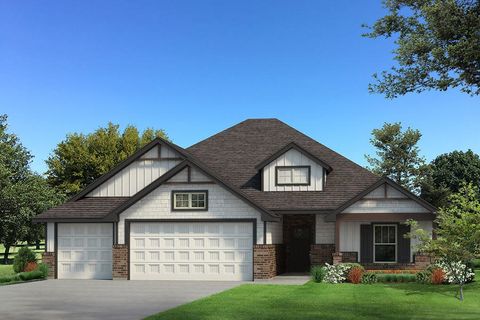
Active
$463,340
4
bds
|
3
ba
|
0
sqft
|
built
2025
816 E Hills Dr, Moore, OK 73160
$-1,118
Cash flow
-12.6%
Cash-on-Cash Return
2.8%
Cap rate
0.3%
Rent to Value Ratio
Active
$189,500
4
bds
|
2
ba
|
0
sqft
|
built
1966
1516 City Ave, Moore, OK 73160
$-259
Cash flow
-7.1%
Cash-on-Cash Return
4.0%
Cap rate
0.6%
Rent to Value Ratio
Pending
$160,000
3
bds
|
1
ba
|
0
sqft
|
built
1961
717 SW 4th Pl, Moore, OK 73160
$43
Cash flow
1.4%
Cash-on-Cash Return
6.0%
Cap rate
0.9%
Rent to Value Ratio
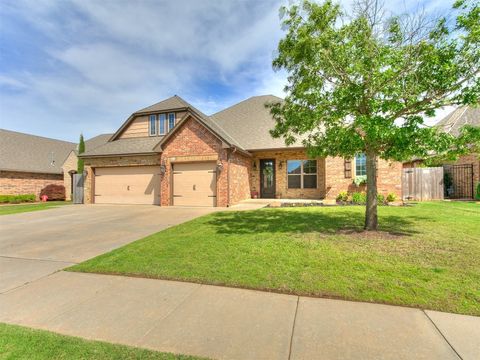
Active
$387,840
4
bds
|
2
ba
|
0
sqft
|
built
2025
812 E Hills Dr, Moore, OK 73160
$-829
Cash flow
-11.2%
Cash-on-Cash Return
3.1%
Cap rate
0.4%
Rent to Value Ratio
Active
$465,000
5
bds
|
4
ba
|
0
sqft
|
built
2014
1808 Lago Dr, Moore, OK 73160
$-716
Cash flow
-8.0%
Cash-on-Cash Return
3.8%
Cap rate
0.6%
Rent to Value Ratio
Active
$285,000
3
bds
|
2
ba
|
0
sqft
|
built
2006
2105 SE 8th St, Moore, OK 73160
$-301
Cash flow
-5.5%
Cash-on-Cash Return
4.4%
Cap rate
0.7%
Rent to Value Ratio
Active
$234,900
4
bds
|
2
ba
|
0
sqft
|
built
1985
2101 NE 11th St, Moore, OK 73160
$-116
Cash flow
-2.6%
Cash-on-Cash Return
5.1%
Cap rate
0.7%
Rent to Value Ratio
Pending
$241,999
3
bds
|
2
ba
|
0
sqft
|
built
1978
3605 Country Clb, Moore, OK 73160
$-151
Cash flow
-3.3%
Cash-on-Cash Return
4.9%
Cap rate
0.7%
Rent to Value Ratio
Active
$235,000
3
bds
|
2
ba
|
0
sqft
|
built
2005
2716 SE 92nd Cir, Moore, OK 73160
$-272
Cash flow
-6.0%
Cash-on-Cash Return
4.3%
Cap rate
0.7%
Rent to Value Ratio
Active
$268,900
3
bds
|
2
ba
|
0
sqft
|
built
2014
1328 Ridgeway Dr, Moore, OK 73160
$-285
Cash flow
-5.5%
Cash-on-Cash Return
4.4%
Cap rate
0.7%
Rent to Value Ratio
Active
$159,000
3
bds
|
1
ba
|
0
sqft
|
built
1963
836 SE 9th St, Moore, OK 73160
$127
Cash flow
4.2%
Cash-on-Cash Return
6.6%
Cap rate
0.9%
Rent to Value Ratio
Active
$315,000
3
bds
|
2
ba
|
0
sqft
|
built
2010
708 Carol Ann Pl, Moore, OK 73160
$-477
Cash flow
-7.9%
Cash-on-Cash Return
3.9%
Cap rate
0.6%
Rent to Value Ratio
Pending
$394,900
5
bds
|
3
ba
|
0
sqft
|
built
2021
2700 SE 22nd St, Moore, OK 73160
$-617
Cash flow
-8.2%
Cash-on-Cash Return
3.8%
Cap rate
0.6%
Rent to Value Ratio
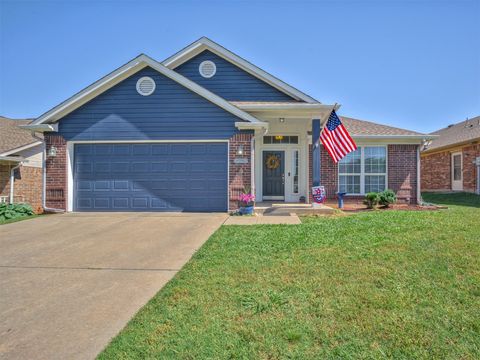
Pending
$215,000
3
bds
|
2
ba
|
0
sqft
|
built
2003
2009 Astoria Dr, Moore, OK 73160
$-127
Cash flow
-3.1%
Cash-on-Cash Return
5.0%
Cap rate
0.7%
Rent to Value Ratio
Active
$232,500
4
bds
|
3
ba
|
0
sqft
|
built
1927
904 NE 4th St, Moore, OK 73160
$-69
Cash flow
-1.5%
Cash-on-Cash Return
5.3%
Cap rate
0.8%
Rent to Value Ratio
Active
$165,000
3
bds
|
2
ba
|
0
sqft
|
built
1961
115 S Janeway Ave, Moore, OK 73160
$13
Cash flow
0.4%
Cash-on-Cash Return
5.8%
Cap rate
0.8%
Rent to Value Ratio
Active
$275,000
3
bds
|
2
ba
|
0
sqft
|
built
1985
1820 E Main St, Moore, OK 73160
$-189
Cash flow
-3.6%
Cash-on-Cash Return
4.9%
Cap rate
0.7%
Rent to Value Ratio
Active
$402,599
4
bds
|
3
ba
|
0
sqft
|
built
2005
2929 SE 27th St, Moore, OK 73160
$-687
Cash flow
-8.9%
Cash-on-Cash Return
3.6%
Cap rate
0.6%
Rent to Value Ratio

Pending
$499,900
3
bds
|
3
ba
|
0
sqft
|
built
2006
3016 Sycamore Ct, Moore, OK 73160
$-830
Cash flow
-8.7%
Cash-on-Cash Return
3.7%
Cap rate
0.6%
Rent to Value Ratio
Active
$365,000
4
bds
|
2
ba
|
0
sqft
|
built
2022
1632 NE 35th St, Moore, OK 73160
$-512
Cash flow
-7.3%
Cash-on-Cash Return
4.0%
Cap rate
0.7%
Rent to Value Ratio
Active
$310,000
4
bds
|
2
ba
|
0
sqft
|
built
2015
913 Dayton Ln, Moore, OK 73160
$-473
Cash flow
-8.0%
Cash-on-Cash Return
3.8%
Cap rate
0.6%
Rent to Value Ratio
Active
$224,900
3
bds
|
2
ba
|
0
sqft
|
built
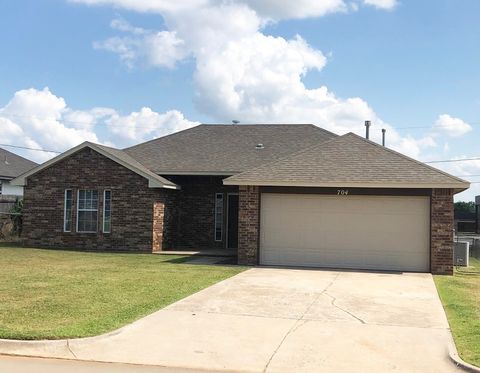
2002
704 NW 21st St, Moore, OK 73160
$-264
Cash flow
-6.1%
Cash-on-Cash Return
4.3%
Cap rate
0.6%
Rent to Value Ratio
Active
$444,000
4
bds
|
3
ba
|
0
sqft
|
built
2021
3320 Lola Ct, Moore, OK 73160
$-722
Cash flow
-8.5%
Cash-on-Cash Return
3.7%
Cap rate
0.6%
Rent to Value Ratio