Mountain View, CA Investment Properties for Sale
Browse homes for sale and investment properties in Mountain View, CA. Refine your search by price, property type, or more.
Best cash flowing properties in Mountain View, CA
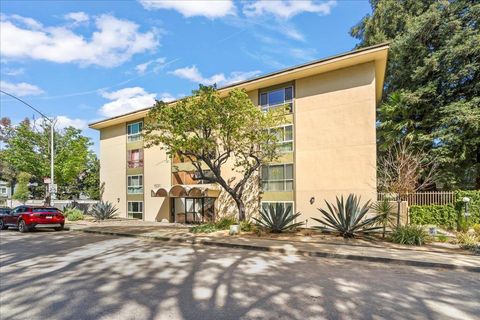
Active
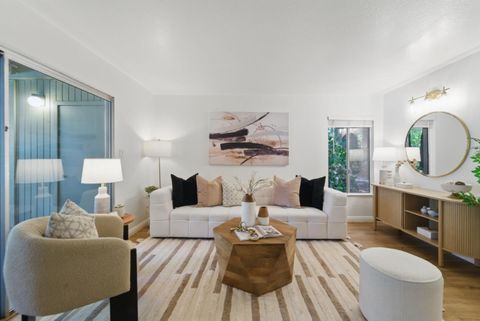
$550,000
1
bds
|
1
ba
|
645
sqft
|
built
1971
505 Cypress Point Dr, Mountain View, CA 94043
$-1,056
Cash flow
-10.0%
Cash-on-Cash Return
3.8%
Cap rate
0.5%
Rent to Value Ratio
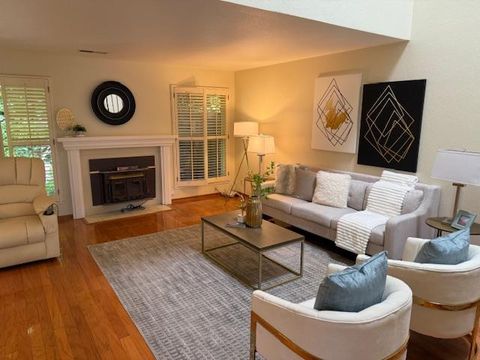
Active
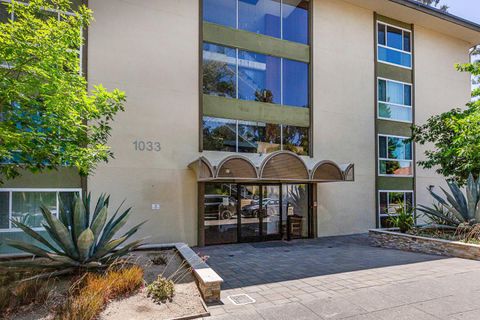
$548,000
1
bds
|
1
ba
|
855
sqft
|
built
1969
1033 Crestview Dr, Mountain View, CA 94040
$-1,130
Cash flow
-10.8%
Cash-on-Cash Return
3.6%
Cap rate
0.6%
Rent to Value Ratio
28 out of 32 properties for sale in Mountain View, CA
Limited Results Shown
Create a free account, or log in to reveal all property listings and enjoy the complete experience.
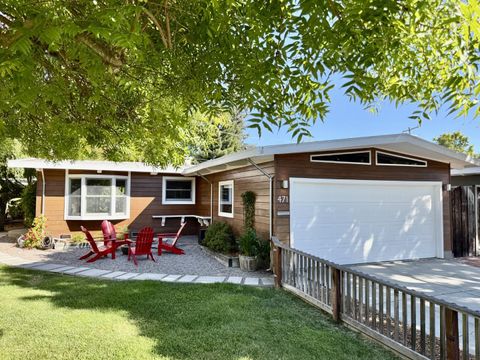
Active
$2,195,000
3
bds
|
2
ba
|
1,140
sqft
|
built
1958
471 Victory Ave, Mountain View, CA 94043
$-7,511
Cash flow
-17.9%
Cash-on-Cash Return
2.0%
Cap rate
0.2%
Rent to Value Ratio
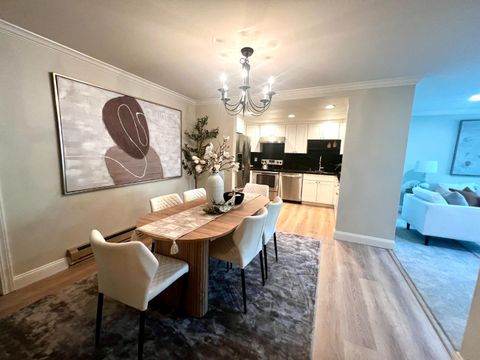
Active
$739,000
2
bds
|
2
ba
|
1,140
sqft
|
built
1969
1031 Crestview Dr, Mountain View, CA 94040
$-1,819
Cash flow
-12.8%
Cash-on-Cash Return
3.1%
Cap rate
0.5%
Rent to Value Ratio
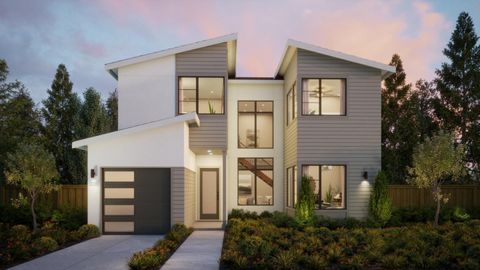
Active
$5,450,000
4
bds
|
4
ba
|
2,959
sqft
|
built
2025
1033 Marilyn Dr, Mountain View, CA 94040
$-20,589
Cash flow
-19.7%
Cash-on-Cash Return
1.5%
Cap rate
0.2%
Rent to Value Ratio
Active
$599,950
1
bds
|
1
ba
|
855
sqft
|
built
1969
1031 Crestview Dr, Mountain View, CA 94040
$-1,600
Cash flow
-13.9%
Cash-on-Cash Return
2.9%
Cap rate
0.5%
Rent to Value Ratio
Active
$2,100,000
3
bds
|
3
ba
|
1,339
sqft
|
built
1995
103 Whits Rd, Mountain View, CA 94040
$-6,784
Cash flow
-16.9%
Cash-on-Cash Return
2.2%
Cap rate
0.3%
Rent to Value Ratio
Active
$698,000
2
bds
|
1
ba
|
935
sqft
|
built
1965
255 S Rengstorff Ave, Mountain View, CA 94040
$-1,865
Cash flow
-13.9%
Cash-on-Cash Return
2.9%
Cap rate
0.5%
Rent to Value Ratio
Active
$538,000
1
bds
|
1
ba
|
837
sqft
|
built
1970
50 E Middlefield Rd, Mountain View, CA 94043
$-1,174
Cash flow
-11.4%
Cash-on-Cash Return
3.4%
Cap rate
0.6%
Rent to Value Ratio
Active
$1,420,000
3
bds
|
3
ba
|
1,288
sqft
|
built
1999
151 Jasmine Ct, Mountain View, CA 94043
$-3,799
Cash flow
-14.0%
Cash-on-Cash Return
2.9%
Cap rate
0.3%
Rent to Value Ratio
Active
$2,700,000
4
bds
|
0
ba
|
1,424
sqft
|
built
1959
717 Ehrhorn Ave, Mountain View, CA 94041
$-11,445
Cash flow
-22.1%
Cash-on-Cash Return
1.0%
Cap rate
0.1%
Rent to Value Ratio
Active
$1,195,000
2
bds
|
3
ba
|
1,247
sqft
|
built
1987
201 Ada Ave, Mountain View, CA 94043
$-3,888
Cash flow
-17.0%
Cash-on-Cash Return
2.2%
Cap rate
0.3%
Rent to Value Ratio
Active
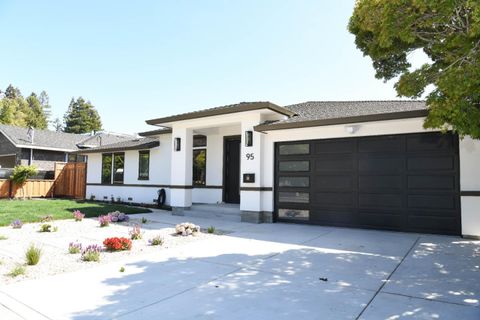
$3,495,000
5
bds
|
4
ba
|
2,758
sqft
|
built
1951
95 Centre St, Mountain View, CA 94041
$-14,499
Cash flow
-21.6%
Cash-on-Cash Return
1.1%
Cap rate
0.1%
Rent to Value Ratio

Active
$2,698,000
6
bds
|
0
ba
|
2,616
sqft
|
built
1949
700 Mariposa Ave, Mountain View, CA 94041
$-10,883
Cash flow
-21.0%
Cash-on-Cash Return
1.2%
Cap rate
0.1%
Rent to Value Ratio
Active
$1,575,000
3
bds
|
3
ba
|
1,401
sqft
|
built
1982
1993 Plymouth St, Mountain View, CA 94043
$-5,388
Cash flow
-17.8%
Cash-on-Cash Return
2.0%
Cap rate
0.3%
Rent to Value Ratio
Active
$695,000
2
bds
|
1
ba
|
917
sqft
|
built
1972
99 Sherland Ave, Mountain View, CA 94043
$-1,626
Cash flow
-12.2%
Cash-on-Cash Return
3.3%
Cap rate
0.5%
Rent to Value Ratio
Active
$1,098,000
2
bds
|
2
ba
|
1,268
sqft
|
built
1981
181 Centre St, Mountain View, CA 94041
$-2,447
Cash flow
-11.6%
Cash-on-Cash Return
3.4%
Cap rate
0.4%
Rent to Value Ratio
Active
$1,778,800
4
bds
|
4
ba
|
1,873
sqft
|
built
2010
1908 Newbury Dr, Mountain View, CA 94043
$-5,479
Cash flow
-16.1%
Cash-on-Cash Return
2.4%
Cap rate
0.3%
Rent to Value Ratio
Active
$1,749,888
3
bds
|
3
ba
|
1,696
sqft
|
built
1996
298 S Rengstorff Ave, Mountain View, CA 94040
$-4,570
Cash flow
-13.6%
Cash-on-Cash Return
2.9%
Cap rate
0.4%
Rent to Value Ratio
Active
$1,688,888
3
bds
|
3
ba
|
1,625
sqft
|
built
1998
355 Snyder Ln, Mountain View, CA 94043
$-5,021
Cash flow
-15.5%
Cash-on-Cash Return
2.5%
Cap rate
0.3%
Rent to Value Ratio
Active
$1,188,000
2
bds
|
2
ba
|
1,274
sqft
|
built
1973
225 Horizon Ave, Mountain View, CA 94043
$-3,872
Cash flow
-17.0%
Cash-on-Cash Return
2.2%
Cap rate
0.3%
Rent to Value Ratio
Active
$850,000
2
bds
|
1
ba
|
971
sqft
|
built
1975
400 Ortega Ave, Mountain View, CA 94040
$-2,495
Cash flow
-15.3%
Cash-on-Cash Return
2.5%
Cap rate
0.4%
Rent to Value Ratio
Active
$1,625,000
3
bds
|
3
ba
|
1,598
sqft
|
built
1978
280 Orchard Ave, Mountain View, CA 94043
$-5,286
Cash flow
-17.0%
Cash-on-Cash Return
2.2%
Cap rate
0.3%
Rent to Value Ratio
Active
$648,000
2
bds
|
2
ba
|
860
sqft
|
built
1989
1721 California St, Mountain View, CA 94041
$-1,621
Cash flow
-13.1%
Cash-on-Cash Return
3.1%
Cap rate
0.5%
Rent to Value Ratio
Active
$1,500,000
2
bds
|
3
ba
|
1,407
sqft
|
built
1988
441 Saint Julien Way, Mountain View, CA 94043
$-4,624
Cash flow
-16.1%
Cash-on-Cash Return
2.4%
Cap rate
0.3%
Rent to Value Ratio
Active
$1,488,000
3
bds
|
3
ba
|
1,368
sqft
|
built
1987
421 Sierra Vista Ave, Mountain View, CA 94043
$-4,874
Cash flow
-17.1%
Cash-on-Cash Return
2.1%
Cap rate
0.3%
Rent to Value Ratio
Active
$1,550,000
3
bds
|
2
ba
|
1,541
sqft
|
built
1947
453 N Rengstorff Ave, Mountain View, CA 94043
$-5,437
Cash flow
-18.3%
Cash-on-Cash Return
1.9%
Cap rate
0.3%
Rent to Value Ratio
Active
$548,000
1
bds
|
1
ba
|
711
sqft
|
built
1964
280 Easy St, Mountain View, CA 94043
$-1,502
Cash flow
-14.3%
Cash-on-Cash Return
2.8%
Cap rate
0.5%
Rent to Value Ratio