De Soto County Investment Properties for Sale
Browse homes for sale and investment properties in De Soto County. Refine your search by price, property type, or more.
Best cash flowing properties in De Soto County

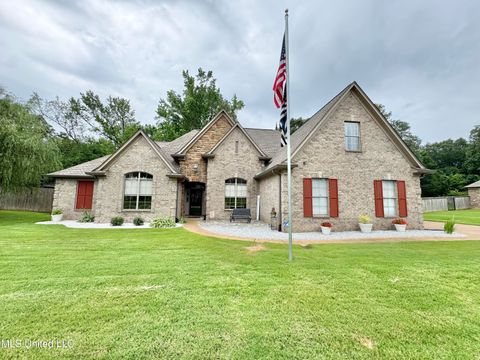
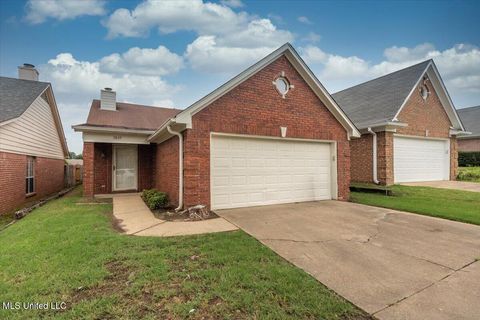
Active
$324,900
3
bds
|
3
ba
|
0
sqft
|
built
1996
5348 Tournament Dr, Olive Branch, MS 38654
$151
Cash flow
2.4%
Cash-on-Cash Return
6.2%
Cap rate
0.8%
Rent to Value Ratio

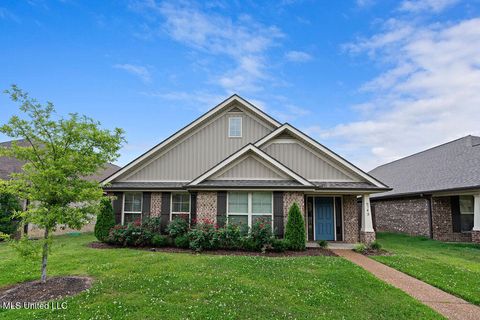
Active
$317,900
3
bds
|
3
ba
|
0
sqft
|
built
2020
3020 Makenlee St, Southaven, MS 38672
$85
Cash flow
1.4%
Cash-on-Cash Return
6.0%
Cap rate
0.8%
Rent to Value Ratio
339 out of 467 properties for sale in De Soto County
Limited Results Shown
Create a free account, or log in to reveal all property listings and enjoy the complete experience.
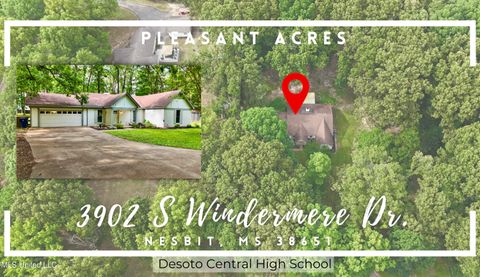
Active
$329,900
3
bds
|
2
ba
|
0
sqft
|
built
1981
3902 Windermere Rd S, Nesbit, MS 38651
$-40
Cash flow
-0.6%
Cash-on-Cash Return
5.5%
Cap rate
0.8%
Rent to Value Ratio

Active
$459,900
4
bds
|
3
ba
|
0
sqft
|
built
1998
6280 Spring Hill Dr, Olive Branch, MS 38654
$-542
Cash flow
-6.1%
Cash-on-Cash Return
4.3%
Cap rate
0.6%
Rent to Value Ratio

Active
$385,000
4
bds
|
2
ba
|
0
sqft
|
built
2008
3899 Chandler Dr, Southaven, MS 38672
$-98
Cash flow
-1.3%
Cash-on-Cash Return
5.4%
Cap rate
0.7%
Rent to Value Ratio

Active
$575,000
5
bds
|
3
ba
|
0
sqft
|
built
2004
2948 Grove Meadow Dr, Nesbit, MS 38651
$-660
Cash flow
-6.0%
Cash-on-Cash Return
4.3%
Cap rate
0.6%
Rent to Value Ratio
Active
$468,900
4
bds
|
4
ba
|
0
sqft
|
built
2008
3327 Pettingill Way, Hernando, MS 38632
$-262
Cash flow
-2.9%
Cash-on-Cash Return
5.0%
Cap rate
0.7%
Rent to Value Ratio

Active
$309,990
3
bds
|
2
ba
|
0
sqft
|
built
2003
2595 Hunters Pointe Dr, Southaven, MS 38672
$-18
Cash flow
-0.3%
Cash-on-Cash Return
5.6%
Cap rate
0.7%
Rent to Value Ratio

Active
$320,000
4
bds
|
2
ba
|
0
sqft
|
built
2022
2532 Rutherford Dr, Southaven, MS 38672
$52
Cash flow
0.8%
Cash-on-Cash Return
5.9%
Cap rate
0.8%
Rent to Value Ratio

Active
$299,000
3
bds
|
2
ba
|
0
sqft
|
built
1979
7572 Lone Oak Cv, Southaven, MS 38671
$-151
Cash flow
-2.6%
Cash-on-Cash Return
5.1%
Cap rate
0.7%
Rent to Value Ratio

Active
$329,900
4
bds
|
2
ba
|
0
sqft
|
built
1999
9884 Victor Dr, Olive Branch, MS 38654
$-190
Cash flow
-3.0%
Cash-on-Cash Return
5.0%
Cap rate
0.7%
Rent to Value Ratio

Active
$481,500
4
bds
|
3
ba
|
0
sqft
|
built
2022
3158 Summer Ave, Hernando, MS 38632
$-79
Cash flow
-0.9%
Cash-on-Cash Return
5.5%
Cap rate
0.7%
Rent to Value Ratio

Active
$335,000
4
bds
|
3
ba
|
0
sqft
|
built
2022
7718 Parkridge Dr, Southaven, MS 38671
$-64
Cash flow
-1.0%
Cash-on-Cash Return
5.4%
Cap rate
0.7%
Rent to Value Ratio
Active
$324,900
3
bds
|
3
ba
|
0
sqft
|
built
1996
5348 Tournament Dr, Olive Branch, MS 38654
$151
Cash flow
2.4%
Cash-on-Cash Return
6.2%
Cap rate
0.8%
Rent to Value Ratio
Active
$175,000
3
bds
|
1
ba
|
0
sqft
|
built
1939
9816 Goodman Rd, Olive Branch, MS 38654
$71
Cash flow
2.1%
Cash-on-Cash Return
6.2%
Cap rate
0.8%
Rent to Value Ratio
Active
$230,000
3
bds
|
2
ba
|
0
sqft
|
built
1999
1300 Richland Dr, Southaven, MS 38671
$-69
Cash flow
-1.6%
Cash-on-Cash Return
5.3%
Cap rate
0.7%
Rent to Value Ratio

Active
$469,000
4
bds
|
3
ba
|
0
sqft
|
built
2000
3770 Swinnea Rd, Southaven, MS 38672
$-551
Cash flow
-6.1%
Cash-on-Cash Return
4.3%
Cap rate
0.6%
Rent to Value Ratio
Active
$499,900
5
bds
|
4
ba
|
0
sqft
|
built
2008
14185 Chapel Ridge Trl, Olive Branch, MS 38654
$-541
Cash flow
-5.6%
Cash-on-Cash Return
4.4%
Cap rate
0.6%
Rent to Value Ratio
Active
$345,000
4
bds
|
2
ba
|
0
sqft
|
built
2020
6743 Jessie Hoyt Dr, Olive Branch, MS 38654
$-278
Cash flow
-4.2%
Cash-on-Cash Return
4.7%
Cap rate
0.7%
Rent to Value Ratio

Active
$247,000
3
bds
|
2
ba
|
0
sqft
|
built
1999
4141 Shadow Glen Dr, Horn Lake, MS 38637
$-27
Cash flow
-0.6%
Cash-on-Cash Return
5.5%
Cap rate
0.7%
Rent to Value Ratio

Active
$389,900
4
bds
|
4
ba
|
0
sqft
|
built
1988
4625 Wealthy Cv, Horn Lake, MS 38637
$-394
Cash flow
-5.3%
Cash-on-Cash Return
4.5%
Cap rate
0.6%
Rent to Value Ratio

Active
$281,900
3
bds
|
3
ba
|
0
sqft
|
built
2001
7669 Meadow Ridge Ln, Olive Branch, MS 38654
$57
Cash flow
1.1%
Cash-on-Cash Return
5.9%
Cap rate
0.8%
Rent to Value Ratio
Active
$250,000
4
bds
|
2
ba
|
0
sqft
|
built
1980
488 White Ash Dr, Southaven, MS 38671
$56
Cash flow
1.2%
Cash-on-Cash Return
5.9%
Cap rate
0.8%
Rent to Value Ratio

Active
$400,000
3
bds
|
2
ba
|
0
sqft
|
built
1961
4971 Church Rd, Nesbit, MS 38651
$-688
Cash flow
-9.0%
Cash-on-Cash Return
3.6%
Cap rate
0.5%
Rent to Value Ratio

Active
$310,000
4
bds
|
2
ba
|
0
sqft
|
built
2023
8616 Hayes Dr, Southaven, MS 38672
$77
Cash flow
1.3%
Cash-on-Cash Return
6.0%
Cap rate
0.8%
Rent to Value Ratio

Active
$445,900
4
bds
|
3
ba
|
0
sqft
|
built
2021
8619 Williamson Dr, Olive Branch, MS 38654
$-353
Cash flow
-4.1%
Cash-on-Cash Return
4.7%
Cap rate
0.7%
Rent to Value Ratio
Active
$385,000
3
bds
|
3
ba
|
0
sqft
|
built
1970
2293 Elm St, Hernando, MS 38632
$-24
Cash flow
-0.3%
Cash-on-Cash Return
5.6%
Cap rate
0.7%
Rent to Value Ratio

Active
$375,000
5
bds
|
4
ba
|
0
sqft
|
built
2008
7427 Lauren Ln, Olive Branch, MS 38654
$-133
Cash flow
-1.9%
Cash-on-Cash Return
5.3%
Cap rate
0.7%
Rent to Value Ratio

Active
$400,000
3
bds
|
3
ba
|
0
sqft
|
built
1995
7860 Windersgate Cir, Olive Branch, MS 38654
$-283
Cash flow
-3.7%
Cash-on-Cash Return
4.8%
Cap rate
0.6%
Rent to Value Ratio
Active
$317,900
3
bds
|
3
ba
|
0
sqft
|
built
2020
3020 Makenlee St, Southaven, MS 38672
$85
Cash flow
1.4%
Cash-on-Cash Return
6.0%
Cap rate
0.8%
Rent to Value Ratio

Active
$750,000
5
bds
|
5
ba
|
0
sqft
|
built
2016
1088 Red Banks Rd S, Byhalia, MS 38611
$-1,582
Cash flow
-11.0%
Cash-on-Cash Return
3.1%
Cap rate
0.4%
Rent to Value Ratio

Active
$220,000
3
bds
|
2
ba
|
0
sqft
|
built
2001
5793 Steffani Dr, Southaven, MS 38671
$60
Cash flow
1.4%
Cash-on-Cash Return
6.0%
Cap rate
0.7%
Rent to Value Ratio

Active
$442,000
5
bds
|
3
ba
|
0
sqft
|
built
2020
3545 Bailey Ln, Southaven, MS 38672
$-214
Cash flow
-2.5%
Cash-on-Cash Return
5.1%
Cap rate
0.7%
Rent to Value Ratio

Active
$350,000
4
bds
|
3
ba
|
0
sqft
|
built
1985
7465 Davidson Rd, Olive Branch, MS 38654
$-201
Cash flow
-3.0%
Cash-on-Cash Return
5.0%
Cap rate
0.7%
Rent to Value Ratio

Active
$450,000
4
bds
|
4
ba
|
0
sqft
|
built
2002
4872 Bobo Pl, Olive Branch, MS 38654
$-419
Cash flow
-4.9%
Cash-on-Cash Return
4.6%
Cap rate
0.6%
Rent to Value Ratio
Active
$239,900
3
bds
|
2
ba
|
0
sqft
|
built
1995
7827 Chesterfield Dr S, Southaven, MS 38671
$-12
Cash flow
-0.3%
Cash-on-Cash Return
5.6%
Cap rate
0.8%
Rent to Value Ratio
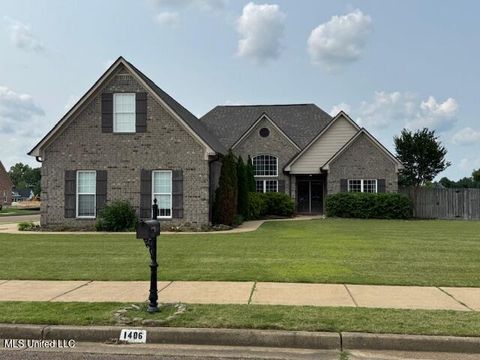
Active
$439,900
5
bds
|
3
ba
|
0
sqft
|
built
2010
1406 Koby Ln, Hernando, MS 38632
$-458
Cash flow
-5.4%
Cash-on-Cash Return
4.4%
Cap rate
0.6%
Rent to Value Ratio

Active
$458,900
4
bds
|
3
ba
|
0
sqft
|
built
2004
7672 Rigmoore Pt N, Olive Branch, MS 38654
$-442
Cash flow
-5.0%
Cash-on-Cash Return
4.5%
Cap rate
0.6%
Rent to Value Ratio

Active
$799,900
5
bds
|
5
ba
|
0
sqft
|
built
2008
4050 Robinson Xing, Olive Branch, MS 38654
$-1,156
Cash flow
-7.5%
Cash-on-Cash Return
3.9%
Cap rate
0.6%
Rent to Value Ratio

Active
$394,999
5
bds
|
3
ba
|
0
sqft
|
built
1990
4100 Redwood Dr, Olive Branch, MS 38654
$-51
Cash flow
-0.7%
Cash-on-Cash Return
5.5%
Cap rate
0.7%
Rent to Value Ratio

Active
$395,000
4
bds
|
4
ba
|
0
sqft
|
built
2006
7428 Wallingford Dr, Olive Branch, MS 38654
$-2
Cash flow
0.0%
Cash-on-Cash Return
5.7%
Cap rate
0.8%
Rent to Value Ratio

Active
$349,900
4
bds
|
2
ba
|
0
sqft
|
built
1998
9948 Victor Dr, Olive Branch, MS 38654
$-311
Cash flow
-4.6%
Cash-on-Cash Return
4.6%
Cap rate
0.6%
Rent to Value Ratio