De Soto County Investment Properties for Sale
Browse homes for sale and investment properties in De Soto County. Refine your search by price, property type, or more.
Best cash flowing properties in De Soto County

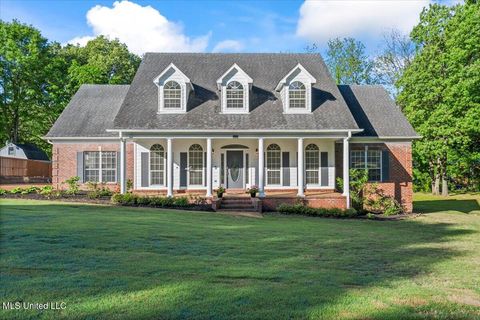
Pending
$137,000
3
bds
|
1
ba
|
0
sqft
|
built
2000
5671 Chapel Hill Dr, Horn Lake, MS 38637
$146
Cash flow
5.6%
Cash-on-Cash Return
7.0%
Cap rate
1.2%
Rent to Value Ratio

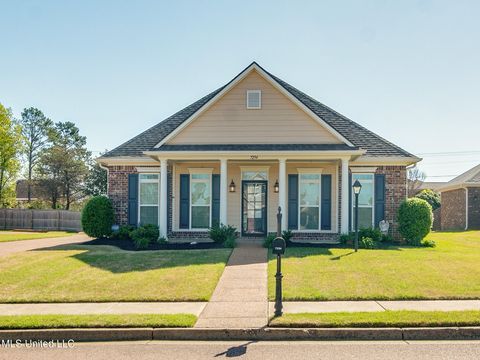
Active
$300,000
3
bds
|
2
ba
|
0
sqft
|
built
2012
7656 Brierfield Dr E, Southaven, MS 38672
$119
Cash flow
2.1%
Cash-on-Cash Return
6.2%
Cap rate
0.8%
Rent to Value Ratio
400 out of 439 properties for sale in De Soto County
Limited Results Shown
Create a free account, or log in to reveal all property listings and enjoy the complete experience.

Active
$519,900
5
bds
|
3
ba
|
0
sqft
|
built
2007
5674 Santa Fe Dr E, Olive Branch, MS 38654
$-437
Cash flow
-4.4%
Cash-on-Cash Return
4.7%
Cap rate
0.6%
Rent to Value Ratio

Active
$695,000
6
bds
|
4
ba
|
0
sqft
|
built
2021
6264 Valley Oaks Dr W, Olive Branch, MS 38654
$-909
Cash flow
-6.8%
Cash-on-Cash Return
4.1%
Cap rate
0.6%
Rent to Value Ratio

Active
$479,900
4
bds
|
3
ba
|
0
sqft
|
built
2015
4083 Kayley Ln, Olive Branch, MS 38654
$-288
Cash flow
-3.1%
Cash-on-Cash Return
5.0%
Cap rate
0.7%
Rent to Value Ratio

Active
$335,000
3
bds
|
2
ba
|
0
sqft
|
built
2012
1390 Lake Front Dr E, Hernando, MS 38632
$-25
Cash flow
-0.4%
Cash-on-Cash Return
5.6%
Cap rate
0.7%
Rent to Value Ratio

Active
$215,000
3
bds
|
2
ba
|
0
sqft
|
built
1991
7181 Lynnease Dr, Southaven, MS 38671
$-64
Cash flow
-1.6%
Cash-on-Cash Return
5.3%
Cap rate
0.7%
Rent to Value Ratio

Active
$329,000
4
bds
|
3
ba
|
0
sqft
|
built
2009
785 Fairway Pointe Cv W, Hernando, MS 38632
$80
Cash flow
1.3%
Cash-on-Cash Return
6.0%
Cap rate
0.8%
Rent to Value Ratio

Active
$399,900
4
bds
|
2
ba
|
0
sqft
|
built
2014
1085 Hawks Crossing Dr N, Olive Branch, MS 38654
$-368
Cash flow
-4.8%
Cash-on-Cash Return
4.6%
Cap rate
0.6%
Rent to Value Ratio

Active
$358,000
4
bds
|
3
ba
|
0
sqft
|
built
2006
3205 Rosebrook Cir N, Southaven, MS 38672
$-66
Cash flow
-1.0%
Cash-on-Cash Return
5.5%
Cap rate
0.7%
Rent to Value Ratio

Pending
$699,900
4
bds
|
5
ba
|
0
sqft
|
built
2007
4294 Whisper Trl, Olive Branch, MS 38654
$-574
Cash flow
-4.3%
Cash-on-Cash Return
4.7%
Cap rate
0.7%
Rent to Value Ratio
Pending
$419,900
5
bds
|
4
ba
|
0
sqft
|
built
2000
8377 Windersgate Dr, Olive Branch, MS 38654
$-283
Cash flow
-3.5%
Cash-on-Cash Return
4.9%
Cap rate
0.7%
Rent to Value Ratio

Active
$264,900
3
bds
|
2
ba
|
0
sqft
|
built
1988
5415 Sollie Cv, Horn Lake, MS 38637
$11
Cash flow
0.2%
Cash-on-Cash Return
5.7%
Cap rate
0.8%
Rent to Value Ratio

Active
$699,999
4
bds
|
4
ba
|
0
sqft
|
built
2010
14224 Aspen Dr, Olive Branch, MS 38654
$-905
Cash flow
-6.7%
Cash-on-Cash Return
4.1%
Cap rate
0.6%
Rent to Value Ratio
Active
$454,900
6
bds
|
3
ba
|
0
sqft
|
built
2010
2585 Rodeo Way, Nesbit, MS 38651
$-480
Cash flow
-5.5%
Cash-on-Cash Return
4.4%
Cap rate
0.6%
Rent to Value Ratio

Active
$316,900
4
bds
|
2
ba
|
0
sqft
|
built
2011
1478 Lake Front Dr E, Hernando, MS 38632
$4
Cash flow
0.1%
Cash-on-Cash Return
5.7%
Cap rate
0.7%
Rent to Value Ratio

Active
$389,000
3
bds
|
3
ba
|
0
sqft
|
built
2021
1537 Winningham Dr, Nesbit, MS 38651
$-542
Cash flow
-7.3%
Cash-on-Cash Return
4.0%
Cap rate
0.6%
Rent to Value Ratio

Active
$470,000
5
bds
|
4
ba
|
0
sqft
|
built
2001
4985 Bobo Pl, Olive Branch, MS 38654
$-306
Cash flow
-3.4%
Cash-on-Cash Return
4.9%
Cap rate
0.7%
Rent to Value Ratio

Active
$449,000
5
bds
|
3
ba
|
0
sqft
|
built
2020
1601 Treestand Rd, Southaven, MS 38672
$-215
Cash flow
-2.5%
Cash-on-Cash Return
5.1%
Cap rate
0.7%
Rent to Value Ratio

Active
$340,700
4
bds
|
3
ba
|
0
sqft
|
built
2023
5727 Tucker Landing Dr, Horn Lake, MS 38637
$55
Cash flow
0.8%
Cash-on-Cash Return
5.9%
Cap rate
0.7%
Rent to Value Ratio

Active
$349,500
4
bds
|
2
ba
|
0
sqft
|
built
2015
7283 Southbranch Pkwy, Olive Branch, MS 38654
$-226
Cash flow
-3.4%
Cash-on-Cash Return
4.9%
Cap rate
0.7%
Rent to Value Ratio
Pending
$137,000
3
bds
|
1
ba
|
0
sqft
|
built
2000
5671 Chapel Hill Dr, Horn Lake, MS 38637
$146
Cash flow
5.6%
Cash-on-Cash Return
7.0%
Cap rate
1.2%
Rent to Value Ratio

Active
$419,900
4
bds
|
3
ba
|
0
sqft
|
built
2007
7409 Wallingford Dr, Olive Branch, MS 38654
$-271
Cash flow
-3.4%
Cash-on-Cash Return
4.9%
Cap rate
0.7%
Rent to Value Ratio

Active
$380,000
3
bds
|
2
ba
|
0
sqft
|
built
2001
1945 Jaybird Rd, Hernando, MS 38632
$-237
Cash flow
-3.3%
Cash-on-Cash Return
4.9%
Cap rate
0.7%
Rent to Value Ratio

Active under contract
$282,000
4
bds
|
2
ba
|
0
sqft
|
built
2022
8931 Mary Frances Dr, Southaven, MS 38671
$-64
Cash flow
-1.2%
Cash-on-Cash Return
5.4%
Cap rate
0.7%
Rent to Value Ratio

Active
$475,000
5
bds
|
4
ba
|
0
sqft
|
built
2006
4328 Abele Cv, Olive Branch, MS 38654
$-286
Cash flow
-3.1%
Cash-on-Cash Return
5.0%
Cap rate
0.7%
Rent to Value Ratio

Active
$489,500
4
bds
|
3
ba
|
0
sqft
|
built
2017
4713 Bakersfield Dr, Nesbit, MS 38651
$-337
Cash flow
-3.6%
Cash-on-Cash Return
4.9%
Cap rate
0.6%
Rent to Value Ratio

Active
$869,900
6
bds
|
6
ba
|
0
sqft
|
built
1998
920 Red Banks Rd N, Byhalia, MS 38611
$-2,713
Cash flow
-16.3%
Cash-on-Cash Return
1.9%
Cap rate
0.3%
Rent to Value Ratio

Active
$576,900
5
bds
|
5
ba
|
0
sqft
|
built
2004
8339 Whites Crossing Dr, Olive Branch, MS 38654
$-737
Cash flow
-6.7%
Cash-on-Cash Return
4.1%
Cap rate
0.6%
Rent to Value Ratio

Active
$1,099,999
6
bds
|
5
ba
|
0
sqft
|
built
2023
6978 Vaiden Rd, Hernando, MS 38632
$-3,100
Cash flow
-14.7%
Cash-on-Cash Return
2.3%
Cap rate
0.3%
Rent to Value Ratio

Active
$347,500
3
bds
|
2
ba
|
0
sqft
|
built
2023
7227 Ellinwood Pass, Olive Branch, MS 38654
$-100
Cash flow
-1.5%
Cash-on-Cash Return
5.3%
Cap rate
0.7%
Rent to Value Ratio
Active
$355,000
3
bds
|
2
ba
|
0
sqft
|
built
2016
7294 Wind Dr, Olive Branch, MS 38654
$-242
Cash flow
-3.6%
Cash-on-Cash Return
4.9%
Cap rate
0.6%
Rent to Value Ratio

Active
$410,000
4
bds
|
3
ba
|
0
sqft
|
built
2013
7637 Wisteria Dr, Olive Branch, MS 38654
$-178
Cash flow
-2.3%
Cash-on-Cash Return
5.2%
Cap rate
0.7%
Rent to Value Ratio

Active
$365,000
4
bds
|
2
ba
|
0
sqft
|
built
2022
2094 Watson Vw W, Nesbit, MS 38651
$-19
Cash flow
-0.3%
Cash-on-Cash Return
5.6%
Cap rate
0.7%
Rent to Value Ratio

Active
$435,000
4
bds
|
3
ba
|
0
sqft
|
built
2017
1757 Robertson Place Dr, Hernando, MS 38632
$-279
Cash flow
-3.3%
Cash-on-Cash Return
4.9%
Cap rate
0.7%
Rent to Value Ratio

Active
$470,000
4
bds
|
4
ba
|
0
sqft
|
built
1994
5480 Polk Ln, Olive Branch, MS 38654
$-519
Cash flow
-5.8%
Cash-on-Cash Return
4.4%
Cap rate
0.6%
Rent to Value Ratio

Active
$399,900
4
bds
|
3
ba
|
0
sqft
|
built
2003
6384 Cheyenne Dr, Olive Branch, MS 38654
$-198
Cash flow
-2.6%
Cash-on-Cash Return
5.1%
Cap rate
0.7%
Rent to Value Ratio

Active
$440,000
5
bds
|
3
ba
|
0
sqft
|
built
2000
4440 Windslet Cv, Southaven, MS 38672
$5
Cash flow
0.1%
Cash-on-Cash Return
5.7%
Cap rate
0.8%
Rent to Value Ratio
Active
$300,000
3
bds
|
2
ba
|
0
sqft
|
built
2012
7656 Brierfield Dr E, Southaven, MS 38672
$119
Cash flow
2.1%
Cash-on-Cash Return
6.2%
Cap rate
0.8%
Rent to Value Ratio

Active
$580,000
5
bds
|
5
ba
|
0
sqft
|
built
2022
13648 Highlands Crest Dr, Olive Branch, MS 38654
$-292
Cash flow
-2.6%
Cash-on-Cash Return
5.1%
Cap rate
0.7%
Rent to Value Ratio

Active
$297,900
4
bds
|
2
ba
|
0
sqft
|
built
2022
8814 Ruth Ann Cv, Southaven, MS 38671
$-31
Cash flow
-0.5%
Cash-on-Cash Return
5.6%
Cap rate
0.7%
Rent to Value Ratio

Active
$355,000
3
bds
|
2
ba
|
0
sqft
|
built
1997
5086 Elmore Rd, Southaven, MS 38671
$-464
Cash flow
-6.8%
Cash-on-Cash Return
4.1%
Cap rate
0.6%
Rent to Value Ratio