De Soto County Investment Properties for Sale
Browse homes for sale and investment properties in De Soto County. Refine your search by price, property type, or more.
Best cash flowing properties in De Soto County
Active
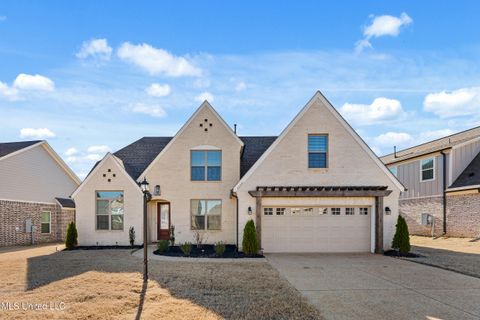
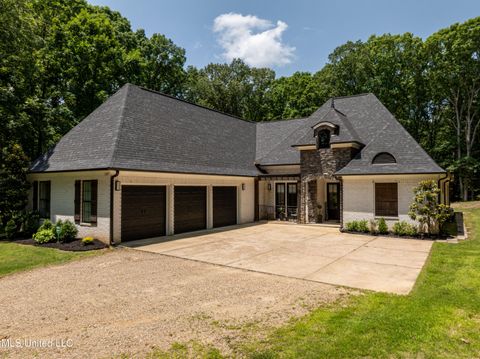
$470,000
5
bds
|
3
ba
|
0
sqft
|
built
2005
3542 Marcia Louise Dr, Southaven, MS 38672
$246
Cash flow
2.7%
Cash-on-Cash Return
6.3%
Cap rate
0.8%
Rent to Value Ratio
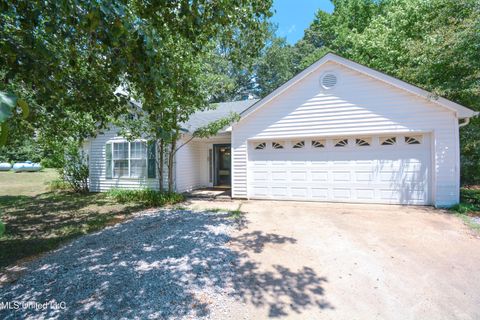
Active
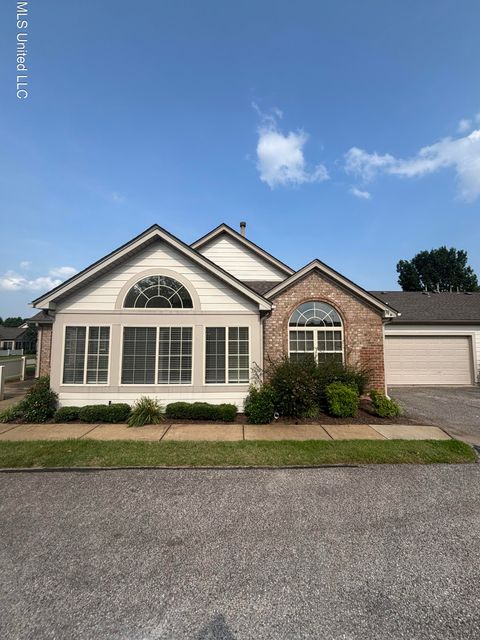
$250,000
3
bds
|
3
ba
|
0
sqft
|
built
1994
11423 High Rd, Hernando, MS 38632
$126
Cash flow
2.6%
Cash-on-Cash Return
6.3%
Cap rate
0.8%
Rent to Value Ratio
341 out of 470 properties for sale in De Soto County
Limited Results Shown
Create a free account, or log in to reveal all property listings and enjoy the complete experience.
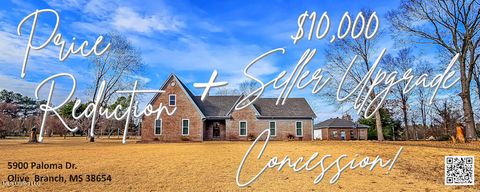
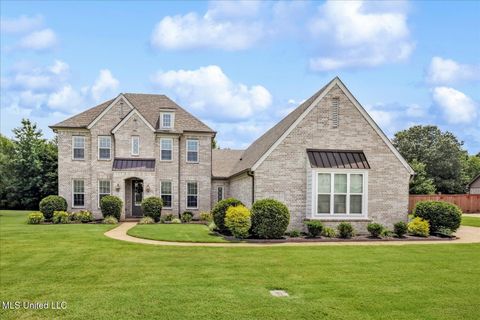
Active
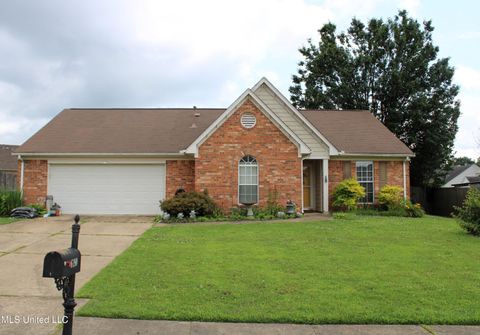
$598,000
5
bds
|
3
ba
|
0
sqft
|
built
1992
5900 Paloma Dr, Olive Branch, MS 38654
$-812
Cash flow
-7.1%
Cash-on-Cash Return
4.0%
Cap rate
0.5%
Rent to Value Ratio
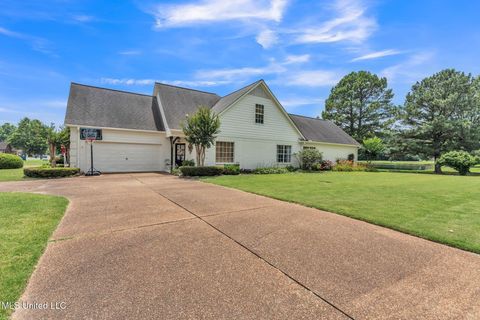
Active
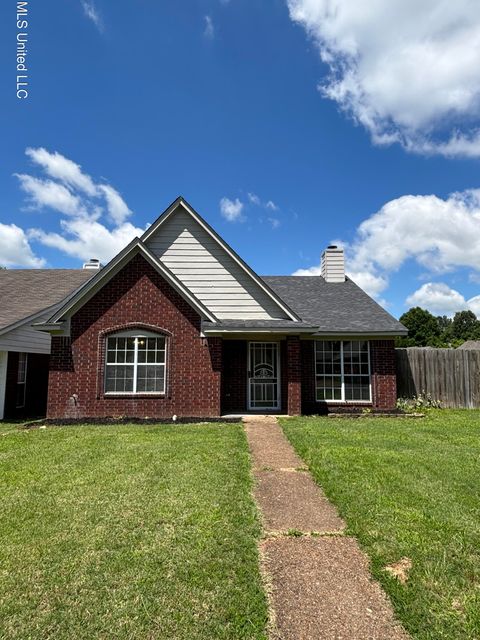
$499,000
5
bds
|
3
ba
|
0
sqft
|
built
2022
4777 Bolivar Trl N, Olive Branch, MS 38654
$-35
Cash flow
-0.4%
Cash-on-Cash Return
5.6%
Cap rate
0.7%
Rent to Value Ratio
Active
$285,000
3
bds
|
2
ba
|
0
sqft
|
built
2000
12855 Fox Ridge Ln, Olive Branch, MS 38654
$48
Cash flow
0.9%
Cash-on-Cash Return
5.9%
Cap rate
0.8%
Rent to Value Ratio

Active
$205,000
2
bds
|
2
ba
|
0
sqft
|
built
1976
10883 Loch Venarcher Cv, Hernando, MS 38632
$75
Cash flow
1.9%
Cash-on-Cash Return
6.1%
Cap rate
0.8%
Rent to Value Ratio
Active
$469,900
5
bds
|
3
ba
|
0
sqft
|
built
2023
13511 Birch Bnd, Olive Branch, MS 38654
$-319
Cash flow
-3.5%
Cash-on-Cash Return
4.9%
Cap rate
0.7%
Rent to Value Ratio

Active
$199,900
3
bds
|
2
ba
|
0
sqft
|
built
1963
1384 Whitworth Cv, Southaven, MS 38671
$88
Cash flow
2.3%
Cash-on-Cash Return
6.2%
Cap rate
0.8%
Rent to Value Ratio

Active
$434,900
4
bds
|
3
ba
|
0
sqft
|
built
2019
6819 Hawks Vw, Olive Branch, MS 38654
$-66
Cash flow
-0.8%
Cash-on-Cash Return
5.5%
Cap rate
0.7%
Rent to Value Ratio

Active
$160,000
3
bds
|
2
ba
|
0
sqft
|
built
2011
9105 Tulane Rd, Southaven, MS 38671
$111
Cash flow
3.6%
Cash-on-Cash Return
6.5%
Cap rate
0.9%
Rent to Value Ratio

Active
$385,000
4
bds
|
3
ba
|
0
sqft
|
built
2001
4253 Lakecrest Cv, Olive Branch, MS 38654
$-201
Cash flow
-2.7%
Cash-on-Cash Return
5.1%
Cap rate
0.7%
Rent to Value Ratio
Active
$325,000
3
bds
|
2
ba
|
0
sqft
|
built
1995
2330 Pigeon Roost Rd, Byhalia, MS 38611
$-236
Cash flow
-3.8%
Cash-on-Cash Return
4.8%
Cap rate
0.6%
Rent to Value Ratio

Active
$435,000
4
bds
|
4
ba
|
0
sqft
|
built
1998
6375 Darren Dr, Olive Branch, MS 38654
$-284
Cash flow
-3.4%
Cash-on-Cash Return
4.9%
Cap rate
0.6%
Rent to Value Ratio

Active
$345,000
4
bds
|
2
ba
|
0
sqft
|
built
2004
9777 Dorothy Dr, Olive Branch, MS 38654
$-161
Cash flow
-2.4%
Cash-on-Cash Return
5.1%
Cap rate
0.7%
Rent to Value Ratio

Active
$589,900
5
bds
|
4
ba
|
0
sqft
|
built
2014
5746 Burlington Ln, Olive Branch, MS 38654
$-600
Cash flow
-5.3%
Cash-on-Cash Return
4.5%
Cap rate
0.6%
Rent to Value Ratio

Active
$224,000
2
bds
|
2
ba
|
0
sqft
|
built
1997
5455 Kayla Dr, Southaven, MS 38671
$25
Cash flow
0.6%
Cash-on-Cash Return
5.8%
Cap rate
0.7%
Rent to Value Ratio

Active
$265,000
4
bds
|
2
ba
|
0
sqft
|
built
1984
7120 Oak Forest Dr, Olive Branch, MS 38654
$-81
Cash flow
-1.6%
Cash-on-Cash Return
5.3%
Cap rate
0.8%
Rent to Value Ratio
Active
$515,000
4
bds
|
3
ba
|
0
sqft
|
built
2017
7216 Belle Manor Dr, Olive Branch, MS 38654
$-464
Cash flow
-4.7%
Cash-on-Cash Return
4.6%
Cap rate
0.6%
Rent to Value Ratio

Active
$225,000
4
bds
|
2
ba
|
0
sqft
|
built
1960
9237 Mason St, Olive Branch, MS 38654
$26
Cash flow
0.6%
Cash-on-Cash Return
5.8%
Cap rate
0.8%
Rent to Value Ratio

Active
$399,000
4
bds
|
3
ba
|
0
sqft
|
built
1992
5285 Wildwood Dr, Southaven, MS 38671
$-244
Cash flow
-3.2%
Cash-on-Cash Return
4.9%
Cap rate
0.6%
Rent to Value Ratio

Active
$279,900
3
bds
|
2
ba
|
0
sqft
|
built
1997
9293 Bryant Trent Blvd, Olive Branch, MS 38654
$42
Cash flow
0.8%
Cash-on-Cash Return
5.9%
Cap rate
0.8%
Rent to Value Ratio

Active
$340,000
3
bds
|
2
ba
|
0
sqft
|
built
2022
6255 Arlington Ln, Olive Branch, MS 38654
$-53
Cash flow
-0.8%
Cash-on-Cash Return
5.5%
Cap rate
0.7%
Rent to Value Ratio
Active
$400,000
4
bds
|
4
ba
|
0
sqft
|
built
1997
3831 Lake Village Cv, Olive Branch, MS 38654
$-304
Cash flow
-4.0%
Cash-on-Cash Return
4.8%
Cap rate
0.7%
Rent to Value Ratio
Active
$515,000
5
bds
|
3
ba
|
0
sqft
|
built
2018
3485 Iron Bridge Rd, Olive Branch, MS 38654
$-500
Cash flow
-5.1%
Cash-on-Cash Return
4.5%
Cap rate
0.6%
Rent to Value Ratio
Active
$380,000
4
bds
|
3
ba
|
0
sqft
|
built
1997
6193 Spring Hill Dr, Olive Branch, MS 38654
$-212
Cash flow
-2.9%
Cash-on-Cash Return
5.0%
Cap rate
0.7%
Rent to Value Ratio
Active
$250,000
3
bds
|
3
ba
|
0
sqft
|
built
1994
11423 High Rd, Hernando, MS 38632
$126
Cash flow
2.6%
Cash-on-Cash Return
6.3%
Cap rate
0.8%
Rent to Value Ratio

Active
$410,000
4
bds
|
3
ba
|
0
sqft
|
built
2019
5110 Kensington Creek Dr, Southaven, MS 38672
$-84
Cash flow
-1.1%
Cash-on-Cash Return
5.4%
Cap rate
0.8%
Rent to Value Ratio
Active
$245,000
3
bds
|
2
ba
|
0
sqft
|
built
1979
7671 Brookwood Pl, Southaven, MS 38671
$-186
Cash flow
-4.0%
Cash-on-Cash Return
4.8%
Cap rate
0.7%
Rent to Value Ratio

Active
$249,900
4
bds
|
1
ba
|
0
sqft
|
built
1962
1529 Ticonderoga Dr, Southaven, MS 38671
$58
Cash flow
1.2%
Cash-on-Cash Return
6.0%
Cap rate
0.7%
Rent to Value Ratio

Active
$214,900
3
bds
|
2
ba
|
0
sqft
|
built
1968
8327 Colonial Hills Cv, Southaven, MS 38671
$-63
Cash flow
-1.5%
Cash-on-Cash Return
5.3%
Cap rate
0.7%
Rent to Value Ratio
Active
$330,000
4
bds
|
3
ba
|
0
sqft
|
built
2022
7785 Parkridge Dr, Southaven, MS 38671
$-167
Cash flow
-2.6%
Cash-on-Cash Return
5.1%
Cap rate
0.7%
Rent to Value Ratio
Active
$324,900
3
bds
|
2
ba
|
0
sqft
|
built
2003
1649 Drake Cv W, Hernando, MS 38632
$-193
Cash flow
-3.1%
Cash-on-Cash Return
5.0%
Cap rate
0.7%
Rent to Value Ratio
Active
$197,500
3
bds
|
3
ba
|
0
sqft
|
built
1991
10101 Stephenson Ln, Olive Branch, MS 38654
$47
Cash flow
1.2%
Cash-on-Cash Return
6.0%
Cap rate
0.8%
Rent to Value Ratio
Active
$280,000
4
bds
|
3
ba
|
0
sqft
|
built
2005
9064 Kyle Duran Ln, Olive Branch, MS 38654
$33
Cash flow
0.6%
Cash-on-Cash Return
5.8%
Cap rate
0.8%
Rent to Value Ratio
Active
$470,000
5
bds
|
3
ba
|
0
sqft
|
built
2005
3542 Marcia Louise Dr, Southaven, MS 38672
$246
Cash flow
2.7%
Cash-on-Cash Return
6.3%
Cap rate
0.8%
Rent to Value Ratio
Active
$296,900
3
bds
|
2
ba
|
0
sqft
|
built
2006
4283 Markston Dr, Southaven, MS 38672
$23
Cash flow
0.4%
Cash-on-Cash Return
5.8%
Cap rate
0.8%
Rent to Value Ratio
Active
$745,000
5
bds
|
3
ba
|
0
sqft
|
built
2021
5205 Polk Ln, Olive Branch, MS 38654
$-356
Cash flow
-2.5%
Cash-on-Cash Return
5.1%
Cap rate
0.7%
Rent to Value Ratio
Active
$319,900
2
bds
|
2
ba
|
0
sqft
|
built
2007
8911 Oak Branch Ln, Olive Branch, MS 38654
$-465
Cash flow
-7.6%
Cash-on-Cash Return
3.9%
Cap rate
0.7%
Rent to Value Ratio

Active
$199,000
3
bds
|
3
ba
|
0
sqft
|
built
2006
7241 Illinois Central Ave, Horn Lake, MS 38637
$-37
Cash flow
-1.0%
Cash-on-Cash Return
5.5%
Cap rate
0.8%
Rent to Value Ratio
Active
$269,900
3
bds
|
2
ba
|
0
sqft
|
built
2002
6190 Braybourne Main, Olive Branch, MS 38654
$-27
Cash flow
-0.5%
Cash-on-Cash Return
5.6%
Cap rate
0.7%
Rent to Value Ratio
Active
$239,900
3
bds
|
2
ba
|
0
sqft
|
built
1994
7887 Chesterfield Dr S, Southaven, MS 38671
$-140
Cash flow
-3.0%
Cash-on-Cash Return
5.0%
Cap rate
0.7%
Rent to Value Ratio
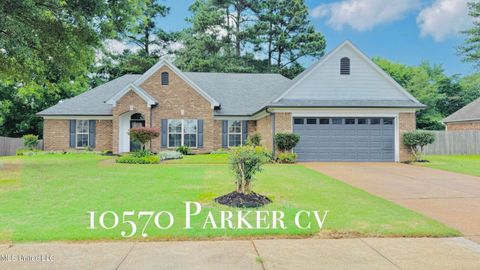
Active
$329,500
4
bds
|
2
ba
|
0
sqft
|
built
2006
10570 Parker Cv, Olive Branch, MS 38654
$-138
Cash flow
-2.2%
Cash-on-Cash Return
5.2%
Cap rate
0.7%
Rent to Value Ratio