Brunswick County Investment Properties for Sale
Browse homes for sale and investment properties in Brunswick County. Refine your search by price, property type, or more.
Best cash flowing properties in Brunswick County
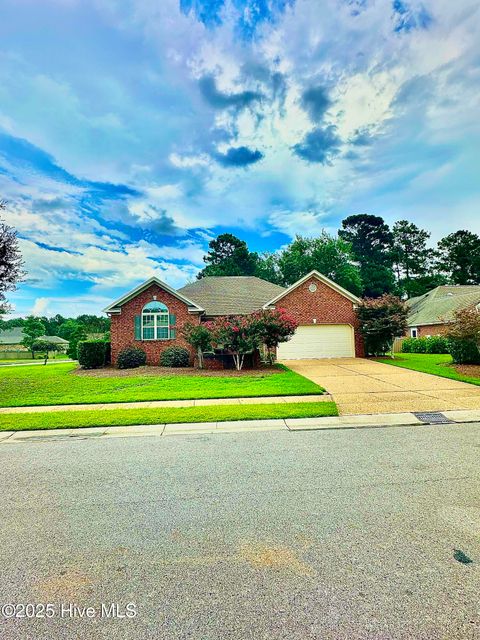
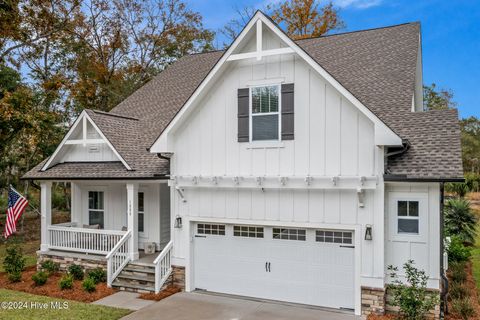
Active
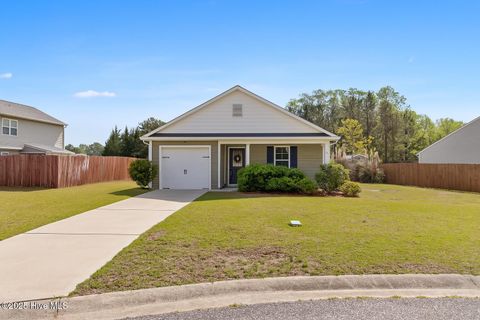
$250,000
3
bds
|
2
ba
|
1,300
sqft
|
built
2015
2218 Brookstone Dr SE, Bolivia, NC 28422
$69
Cash flow
1.4%
Cash-on-Cash Return
6.0%
Cap rate
0.8%
Rent to Value Ratio
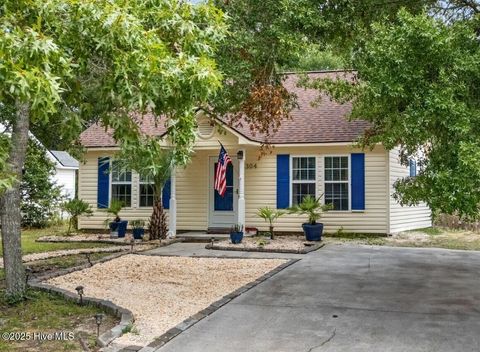
Active
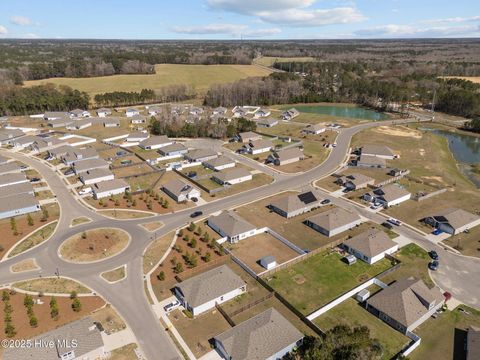
$275,000
3
bds
|
2
ba
|
1,495
sqft
|
built
2021
1793 W Crested Hawk Ct NE, Bolivia, NC 28422
$33
Cash flow
0.6%
Cash-on-Cash Return
5.8%
Cap rate
0.7%
Rent to Value Ratio
458 out of 1,351 properties for sale in Brunswick County
Limited Results Shown
Create a free account, or log in to reveal all property listings and enjoy the complete experience.
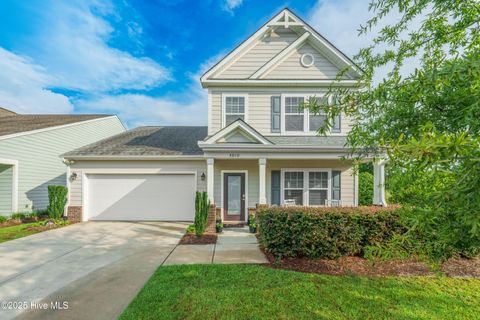
Active
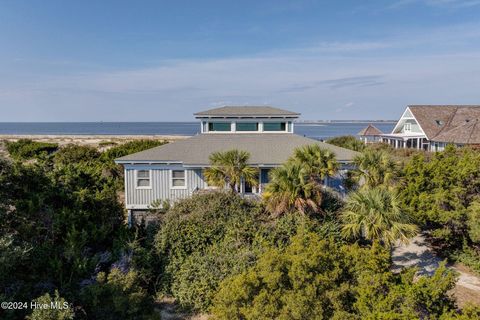
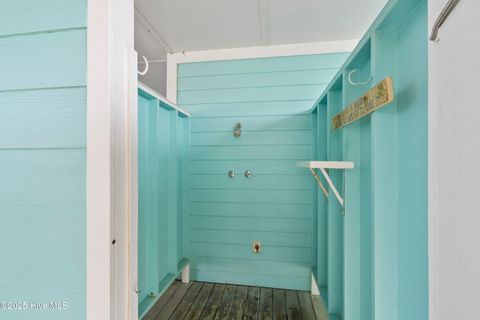
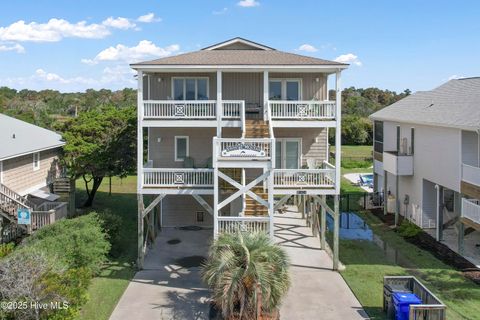
$2,395,000
4
bds
|
4
ba
|
2,370
sqft
|
built
1997
15 Sea Gull Trl, Bald Head Island, NC 28461
$-9,049
Cash flow
-19.7%
Cash-on-Cash Return
1.1%
Cap rate
0.2%
Rent to Value Ratio
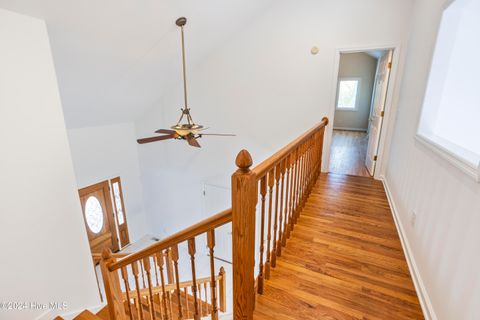
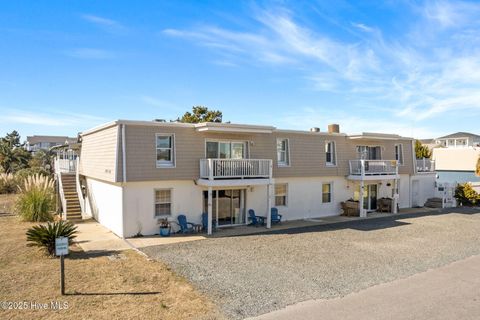
Active
$1,359,000
4
bds
|
3
ba
|
1,700
sqft
|
built
1984
491 Ocean Blvd W, Holden Beach, NC 28462
$-4,936
Cash flow
-18.9%
Cash-on-Cash Return
1.3%
Cap rate
0.2%
Rent to Value Ratio
Active
$1,100,000
4
bds
|
3
ba
|
2,250
sqft
|
built
2006
1404 E Dolphin Dr, Oak Island, NC 28465
$-3,025
Cash flow
-14.3%
Cash-on-Cash Return
2.4%
Cap rate
0.4%
Rent to Value Ratio

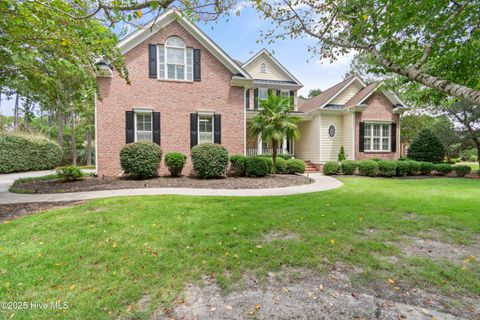
Active
$1,415,000
4
bds
|
4
ba
|
3,921
sqft
|
built
2017
2851 Pine Forest Dr, Southport, NC 28461
$-3,572
Cash flow
-13.2%
Cash-on-Cash Return
2.6%
Cap rate
0.4%
Rent to Value Ratio
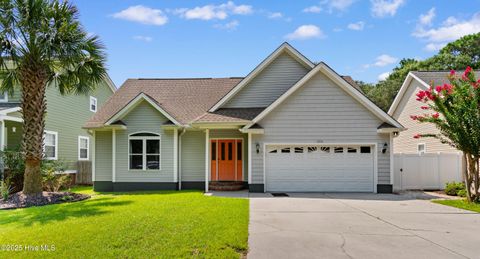
Active
$989,000
4
bds
|
3
ba
|
3,653
sqft
|
built
2005
3810 Worthington Pl, Southport, NC 28461
$-2,021
Cash flow
-10.7%
Cash-on-Cash Return
3.2%
Cap rate
0.4%
Rent to Value Ratio
Active
$419,000
3
bds
|
3
ba
|
1,542
sqft
|
built
2005
1616 Pierce St SW, Ocean Isle Beach, NC 28469
$-396
Cash flow
-4.9%
Cash-on-Cash Return
4.5%
Cap rate
0.5%
Rent to Value Ratio

Active
$925,000
3
bds
|
2
ba
|
1,576
sqft
|
built
1989
431 36th St, Sunset Beach, NC 28468
$-2,526
Cash flow
-14.2%
Cash-on-Cash Return
2.4%
Cap rate
0.3%
Rent to Value Ratio
Active
$1,825,000
4
bds
|
4
ba
|
1,454
sqft
|
built
1979
455 E Third St, Ocean Isle Beach, NC 28469
$-6,348
Cash flow
-18.1%
Cash-on-Cash Return
1.5%
Cap rate
0.2%
Rent to Value Ratio

Active
$575,000
3
bds
|
4
ba
|
2,840
sqft
|
built
2003
1031 W Cove Loop, Leland, NC 28451
$-888
Cash flow
-8.1%
Cash-on-Cash Return
3.8%
Cap rate
0.6%
Rent to Value Ratio
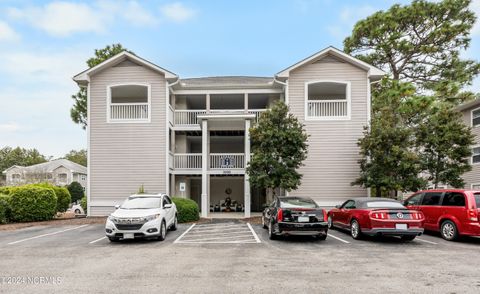
Active
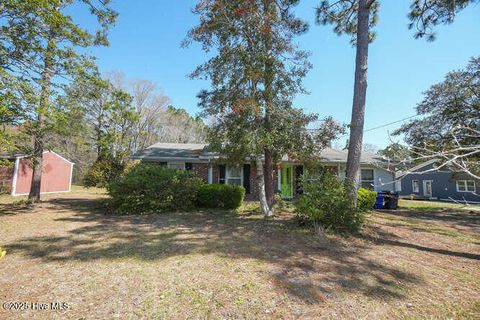
$270,000
3
bds
|
2
ba
|
1,128
sqft
|
built
1965
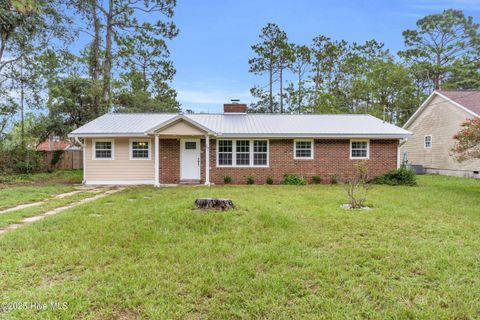
161 Willetts Dr, Southport, NC 28461
$33
Cash flow
0.6%
Cash-on-Cash Return
5.8%
Cap rate
0.7%
Rent to Value Ratio
Active
$770,000
4
bds
|
3
ba
|
3,130
sqft
|
built
2015
2514 Sugargrove Trl NE, Leland, NC 28451
$-1,389
Cash flow
-9.4%
Cash-on-Cash Return
3.5%
Cap rate
0.5%
Rent to Value Ratio
Active
$449,900
3
bds
|
3
ba
|
1,555
sqft
|
built
1985
110 NE 29th St, Oak Island, NC 28465
$-891
Cash flow
-10.3%
Cash-on-Cash Return
3.3%
Cap rate
0.5%
Rent to Value Ratio
Active
$368,000
4
bds
|
2
ba
|
1,638
sqft
|
built
2022
590 Boundary Loop Rd NW, Calabash, NC 28467
$-312
Cash flow
-4.4%
Cash-on-Cash Return
4.7%
Cap rate
0.6%
Rent to Value Ratio
Active
$330,000
3
bds
|
2
ba
|
1,435
sqft
|
built
1980
17 Burton Rd, Southport, NC 28461
$-272
Cash flow
-4.3%
Cash-on-Cash Return
4.7%
Cap rate
0.6%
Rent to Value Ratio
Active
$469,000
2
bds
|
2
ba
|
1,032
sqft
|
built
1940
1566 Gurganus Rd SW, Shallotte, NC 28470
$-922
Cash flow
-10.3%
Cash-on-Cash Return
3.3%
Cap rate
0.4%
Rent to Value Ratio
Active
$259,880
3
bds
|
3
ba
|
1,565
sqft
|
built
2021
7626 Knightbell Cir, Leland, NC 28451
$-121
Cash flow
-2.4%
Cash-on-Cash Return
5.1%
Cap rate
0.8%
Rent to Value Ratio
Active
$699,000
3
bds
|
3
ba
|
2,804
sqft
|
built
2009
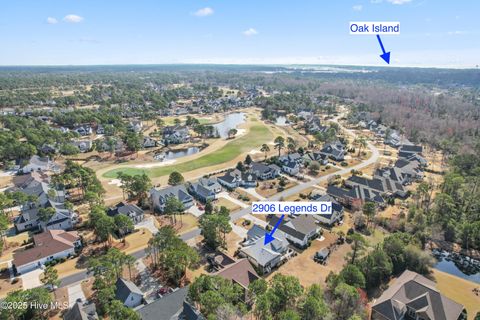
2906 Legends Dr, Southport, NC 28461
$-1,185
Cash flow
-8.8%
Cash-on-Cash Return
3.6%
Cap rate
0.5%
Rent to Value Ratio

Active
$1,199,000
6
bds
|
6
ba
|
2,643
sqft
|
built
2022
5205 E Pelican Dr, Oak Island, NC 28465
$-2,983
Cash flow
-13.0%
Cash-on-Cash Return
2.7%
Cap rate
0.3%
Rent to Value Ratio

Active
$789,000
4
bds
|
4
ba
|
2,934
sqft
|
built
2022
8934 Chesterfield Dr NW, Calabash, NC 28467
$-1,417
Cash flow
-9.4%
Cash-on-Cash Return
3.5%
Cap rate
0.4%
Rent to Value Ratio
Active
$265,000
2
bds
|
2
ba
|
1,920
sqft
|
built
2015
503 Cloe Dare Dr SW, Shallotte, NC 28470
$0
Cash flow
n/a
Cash-on-Cash Return
n/a
Cap rate
n/a
Rent to Value Ratio
Active
$299,900
3
bds
|
2
ba
|
2,121
sqft
|
built
1997
2750 Sunrise St SW, Supply, NC 28462
$-162
Cash flow
-2.8%
Cash-on-Cash Return
5.0%
Cap rate
0.7%
Rent to Value Ratio
Active
$879,900
6
bds
|
3
ba
|
3,949
sqft
|
built
2016
1567 Colonist Sq SW, Ocean Isle Beach, NC 28469
$-1,818
Cash flow
-10.8%
Cash-on-Cash Return
3.2%
Cap rate
0.4%
Rent to Value Ratio

Active
$580,000
3
bds
|
2
ba
|
1,556
sqft
|
built
2018
504 W Oak Island Dr, Oak Island, NC 28465
$-1,328
Cash flow
-11.9%
Cash-on-Cash Return
2.9%
Cap rate
0.4%
Rent to Value Ratio
Active
$999,900
5
bds
|
3
ba
|
2,013
sqft
|
built
1962
223 W Beach Dr, Oak Island, NC 28465
$-2,800
Cash flow
-14.6%
Cash-on-Cash Return
2.3%
Cap rate
0.3%
Rent to Value Ratio
Active
$430,000
3
bds
|
3
ba
|
2,035
sqft
|
built
2007
1101 Jamesford Ct, Leland, NC 28451
$-724
Cash flow
-8.8%
Cash-on-Cash Return
3.7%
Cap rate
0.6%
Rent to Value Ratio
Active
$414,900
2
bds
|
2
ba
|
951
sqft
|
built
1997
1304 E Oak Island Dr, Oak Island, NC 28465
$-810
Cash flow
-10.2%
Cash-on-Cash Return
3.3%
Cap rate
0.5%
Rent to Value Ratio
Active
$510,000
3
bds
|
4
ba
|
2,462
sqft
|
built
2016
4010 Druids Glen Dr, Leland, NC 28451
$-823
Cash flow
-8.4%
Cash-on-Cash Return
3.7%
Cap rate
0.6%
Rent to Value Ratio

Active
$369,000
3
bds
|
2
ba
|
1,724
sqft
|
built
2007
1133 Lillibridge Dr, Leland, NC 28451
$-461
Cash flow
-6.5%
Cash-on-Cash Return
4.2%
Cap rate
0.6%
Rent to Value Ratio

Active
$375,000
4
bds
|
4
ba
|
2,422
sqft
|
built
2019
1303 Sunny Slope Cir, Carolina Shores, NC 28467
$-441
Cash flow
-6.1%
Cash-on-Cash Return
4.3%
Cap rate
0.7%
Rent to Value Ratio

Active
$729,000
4
bds
|
4
ba
|
2,838
sqft
|
built
2017
2369 Red Birch Trl NE, Leland, NC 28451
$-1,179
Cash flow
-8.4%
Cash-on-Cash Return
3.7%
Cap rate
0.5%
Rent to Value Ratio
Active
$550,000
3
bds
|
2
ba
|
2,557
sqft
|
built
1993
289 Heather Dr, Sunset Beach, NC 28468
$-979
Cash flow
-9.3%
Cash-on-Cash Return
3.5%
Cap rate
0.5%
Rent to Value Ratio
Active
$560,000
3
bds
|
3
ba
|
2,325
sqft
|
built
2023
1888 Healing Water Ln SW, Supply, NC 28462
$-954
Cash flow
-8.9%
Cash-on-Cash Return
3.6%
Cap rate
0.5%
Rent to Value Ratio
Active
$325,000
4
bds
|
2
ba
|
1,142
sqft
|
built
1974
298 Ocean Blvd W, Supply, NC 28462
$-1,139
Cash flow
-18.3%
Cash-on-Cash Return
1.5%
Cap rate
0.6%
Rent to Value Ratio

Active
$325,000
2
bds
|
2
ba
|
1,703
sqft
|
built
1988
51 Carolina Shores Pkwy, Carolina Shores, NC 28467
$-184
Cash flow
-3.0%
Cash-on-Cash Return
5.0%
Cap rate
0.6%
Rent to Value Ratio
Active
$830,000
3
bds
|
2
ba
|
1,734
sqft
|
built
2017
305 E Yacht Dr, Oak Island, NC 28465
$-1,919
Cash flow
-12.1%
Cash-on-Cash Return
2.9%
Cap rate
0.4%
Rent to Value Ratio
Active
$249,000
2
bds
|
2
ba
|
1,048
sqft
|
built
1994
3030 Marsh Winds Cir, Southport, NC 28461
$-854
Cash flow
-17.9%
Cash-on-Cash Return
1.6%
Cap rate
0.5%
Rent to Value Ratio
Active
$789,000
3
bds
|
3
ba
|
1,620
sqft
|
built
1987
63 Ocean Isle West Blvd, Ocean Isle Beach, NC 28469
$-2,462
Cash flow
-16.3%
Cash-on-Cash Return
1.9%
Cap rate
0.4%
Rent to Value Ratio
Active
$659,900
3
bds
|
4
ba
|
2,346
sqft
|
built
2016
652 Summerhaven Ln SE, Bolivia, NC 28422
$-1,025
Cash flow
-8.1%
Cash-on-Cash Return
3.8%
Cap rate
0.5%
Rent to Value Ratio