North Carolina Investment Properties for Sale
Browse homes for sale and investment properties in North Carolina. Refine your search by price, property type, or more.
Best cash flowing properties in North Carolina
Active
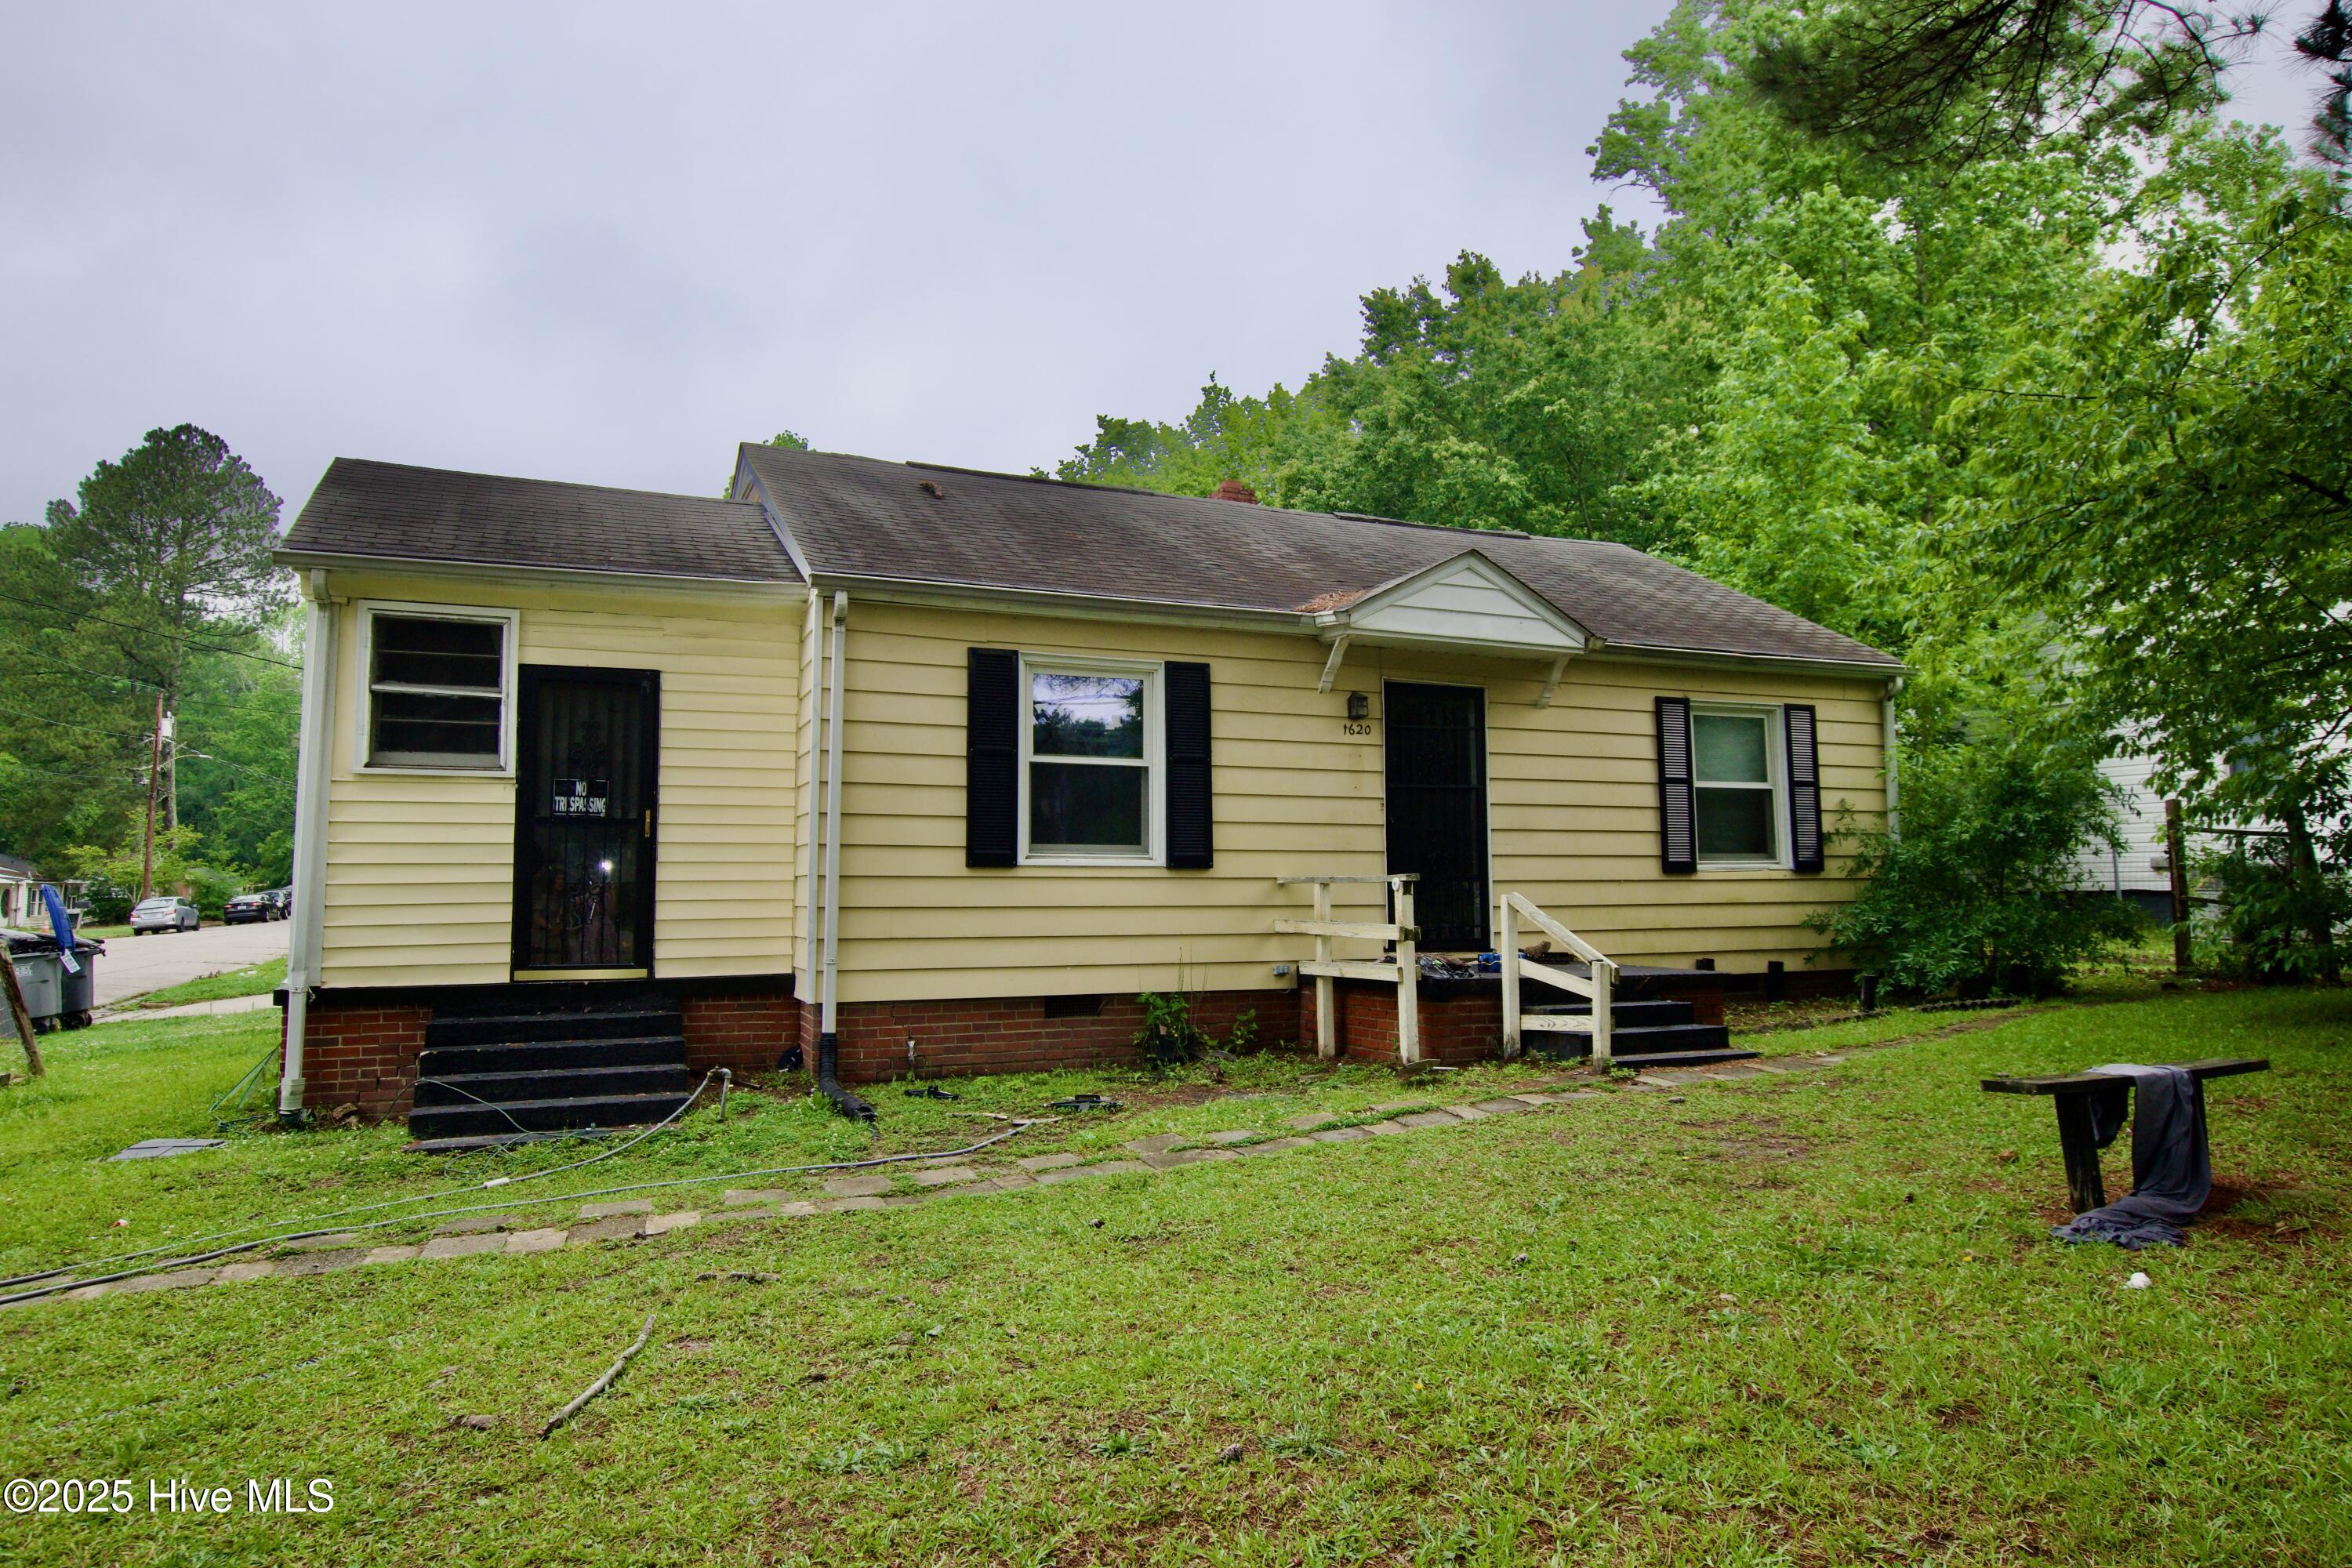
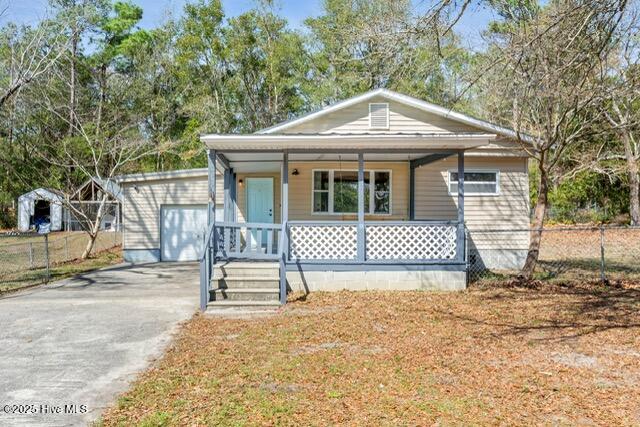
$109,900
3
bds
|
2
ba
|
1,234
sqft
|
built
1952
1620 Old Wilson Rd, Rocky Mount, NC 27801
$446
Cash flow
21.2%
Cash-on-Cash Return
10.5%
Cap rate
1.3%
Rent to Value Ratio
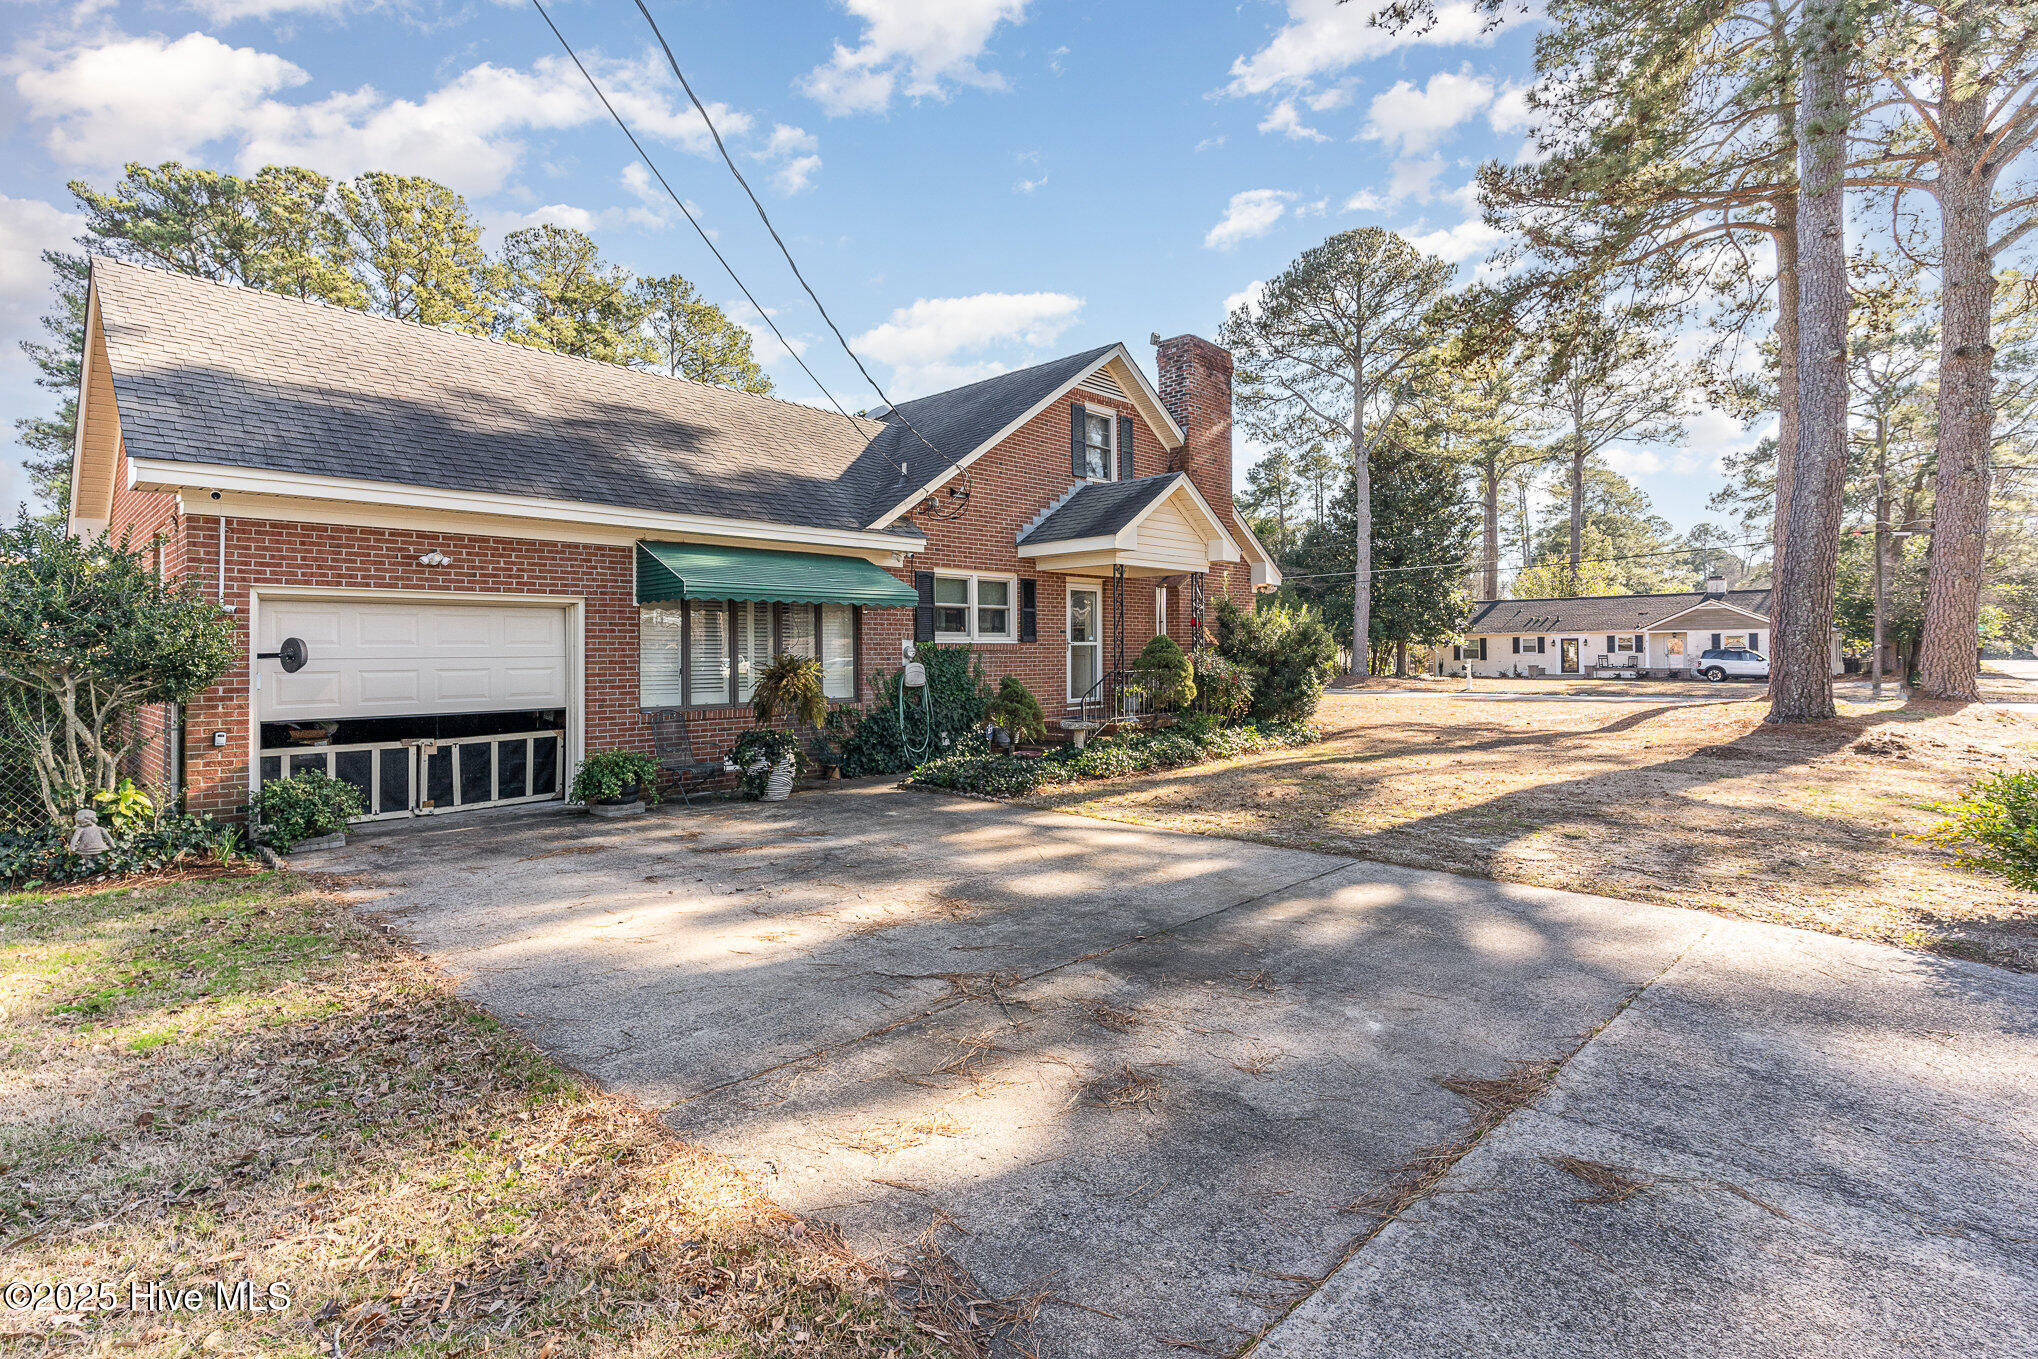
Active
$239,900
3
bds
|
2
ba
|
1,880
sqft
|
built
1962
101 Kirkland Dr, Greenville, NC 27858
$383
Cash flow
8.3%
Cash-on-Cash Return
7.6%
Cap rate
0.9%
Rent to Value Ratio
3,824 out of 13,624 properties for sale in North Carolina
Limited Results Shown
Create a free account, or log in to reveal all property listings and enjoy the complete experience.
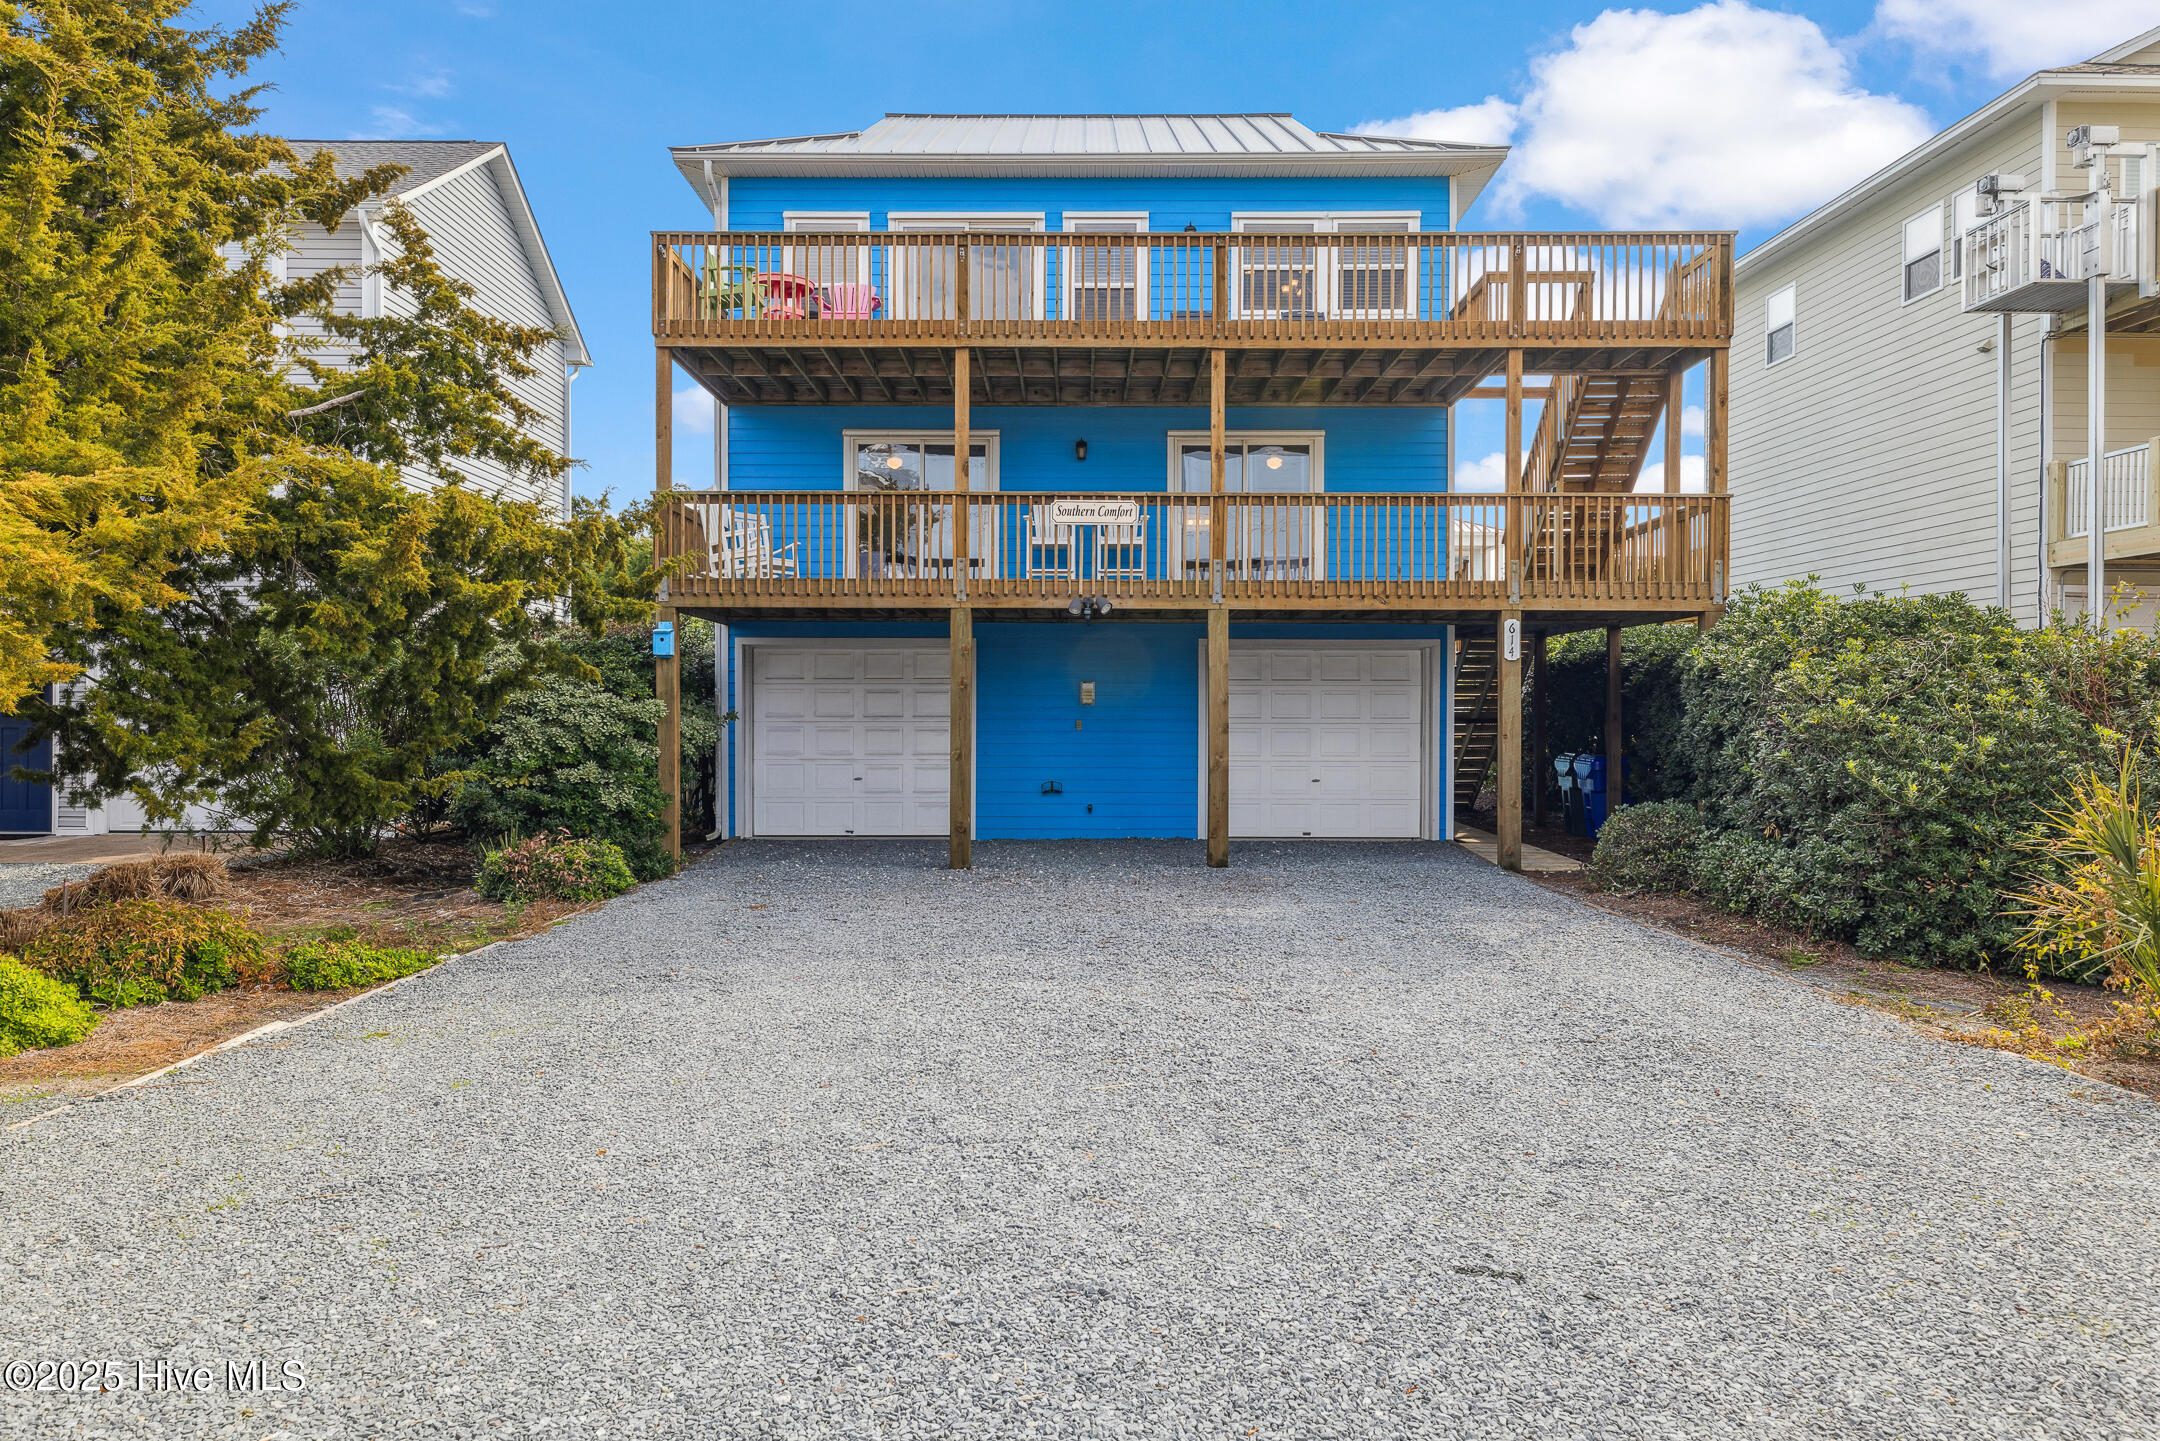
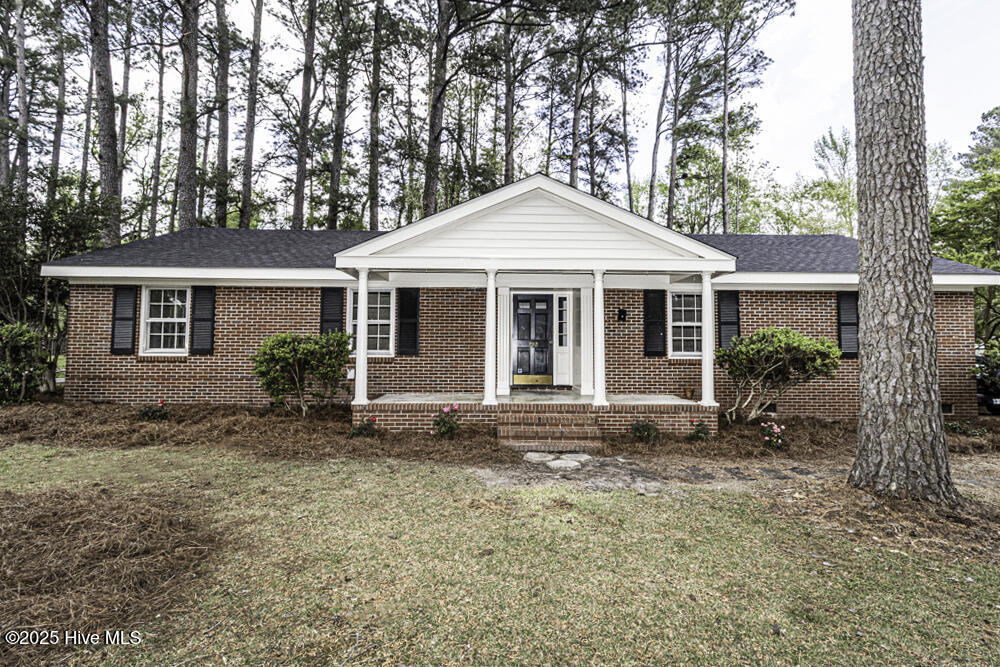
Active
$870,000
4
bds
|
3
ba
|
1,810
sqft
|
built
1998
614 S Topsail Dr, Surf City, NC 28445
$-1,978
Cash flow
-11.9%
Cash-on-Cash Return
3.0%
Cap rate
0.4%
Rent to Value Ratio
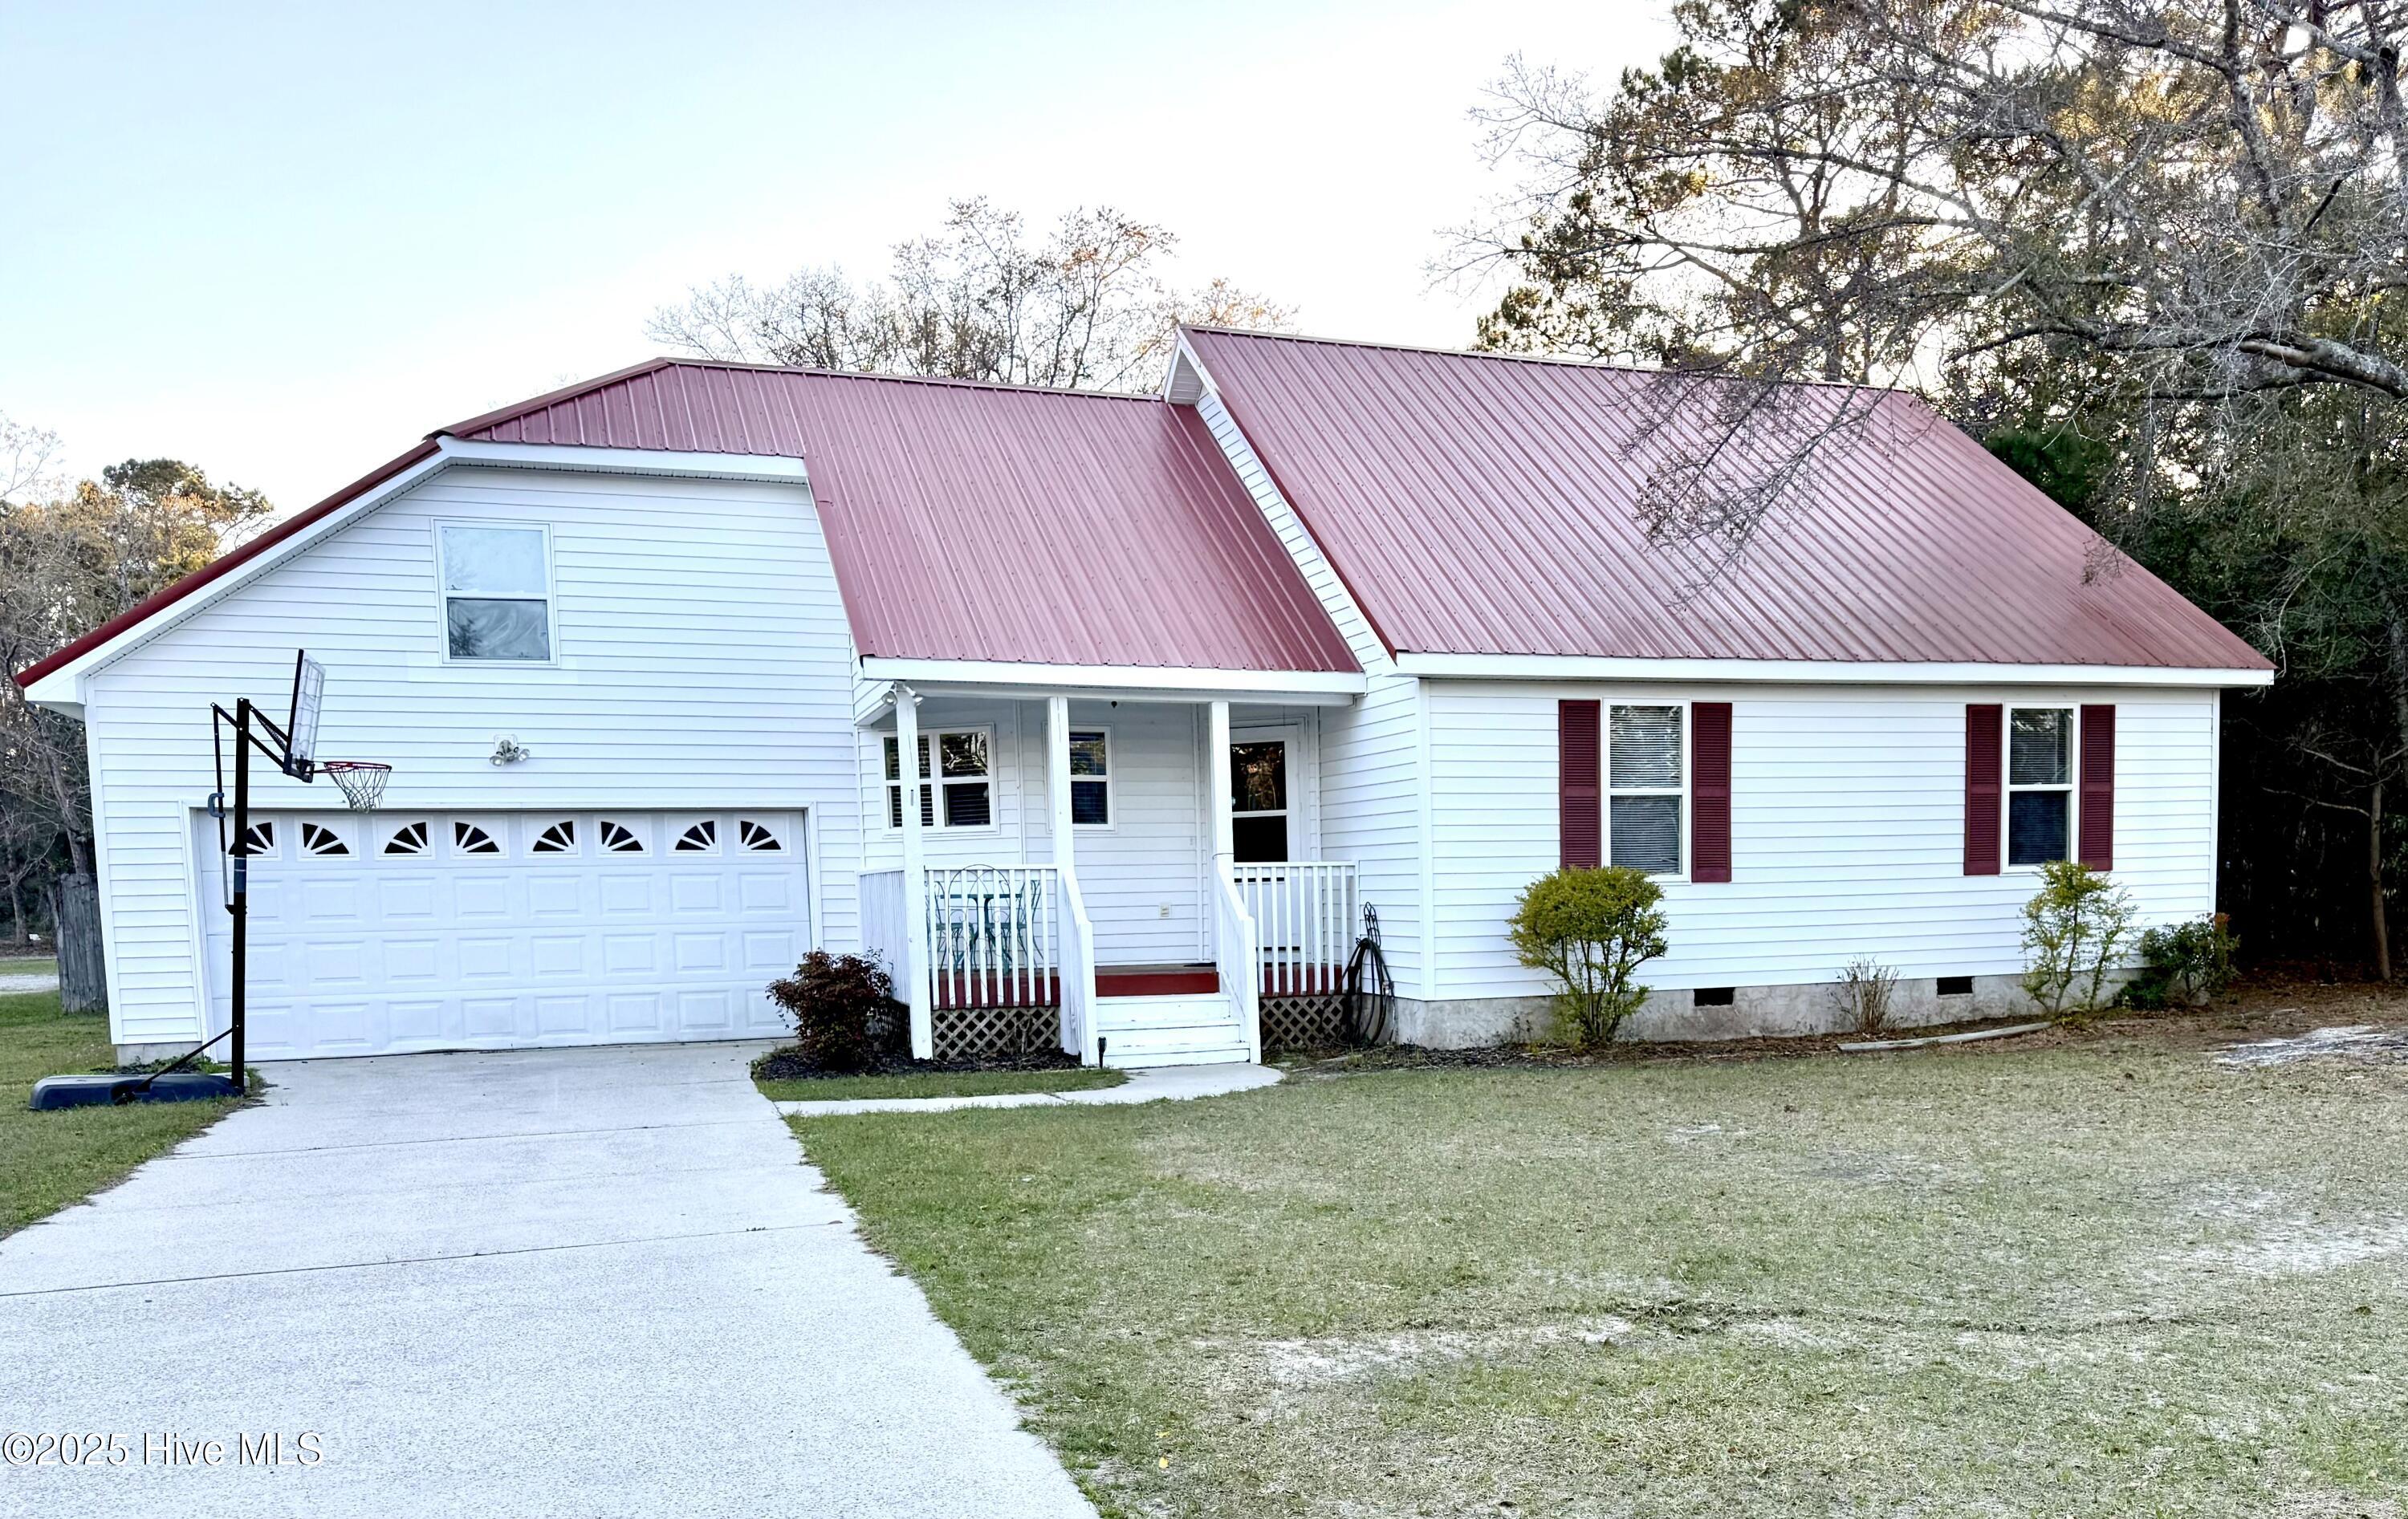
Active
$390,000
3
bds
|
2
ba
|
1,708
sqft
|
built
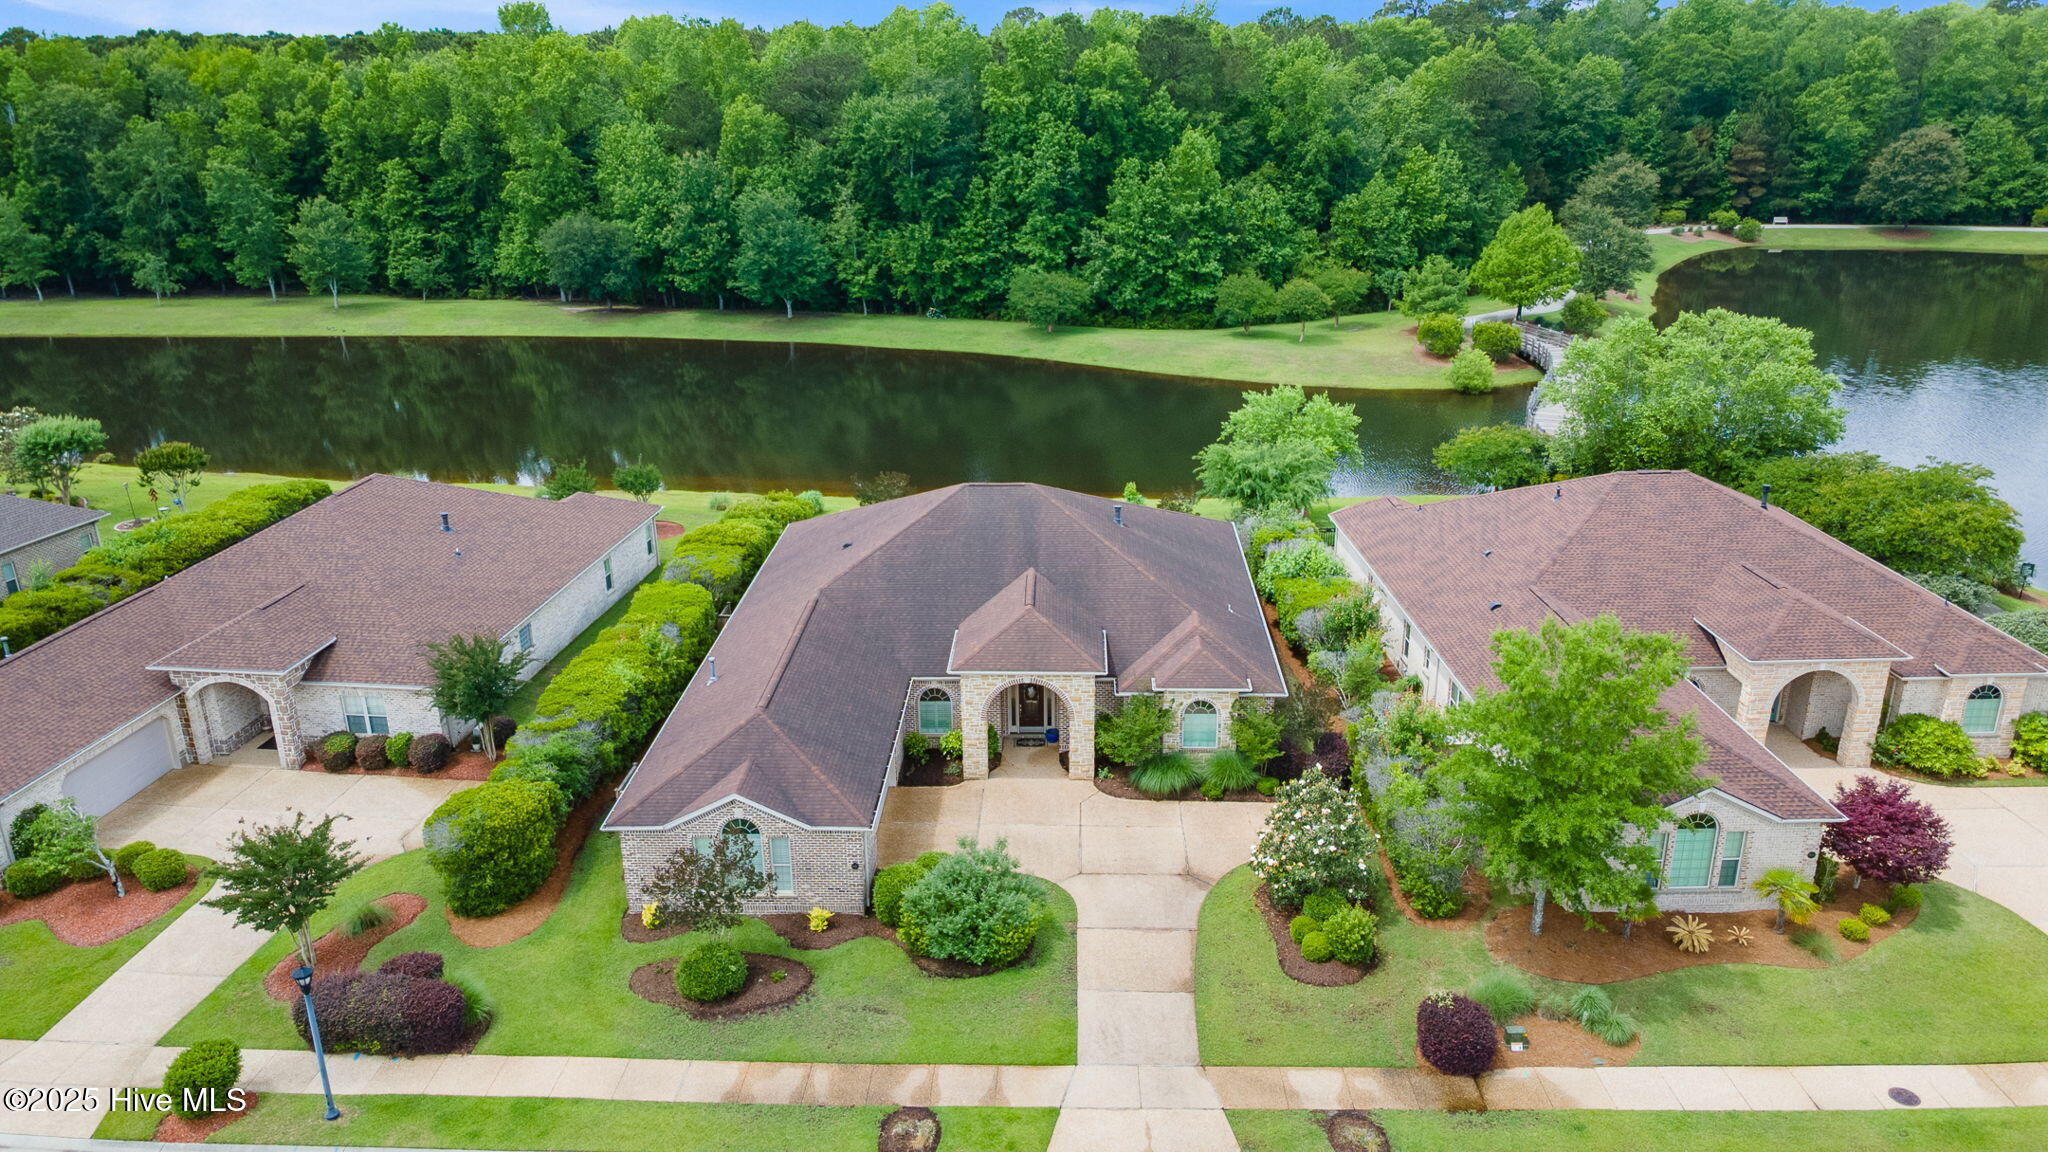
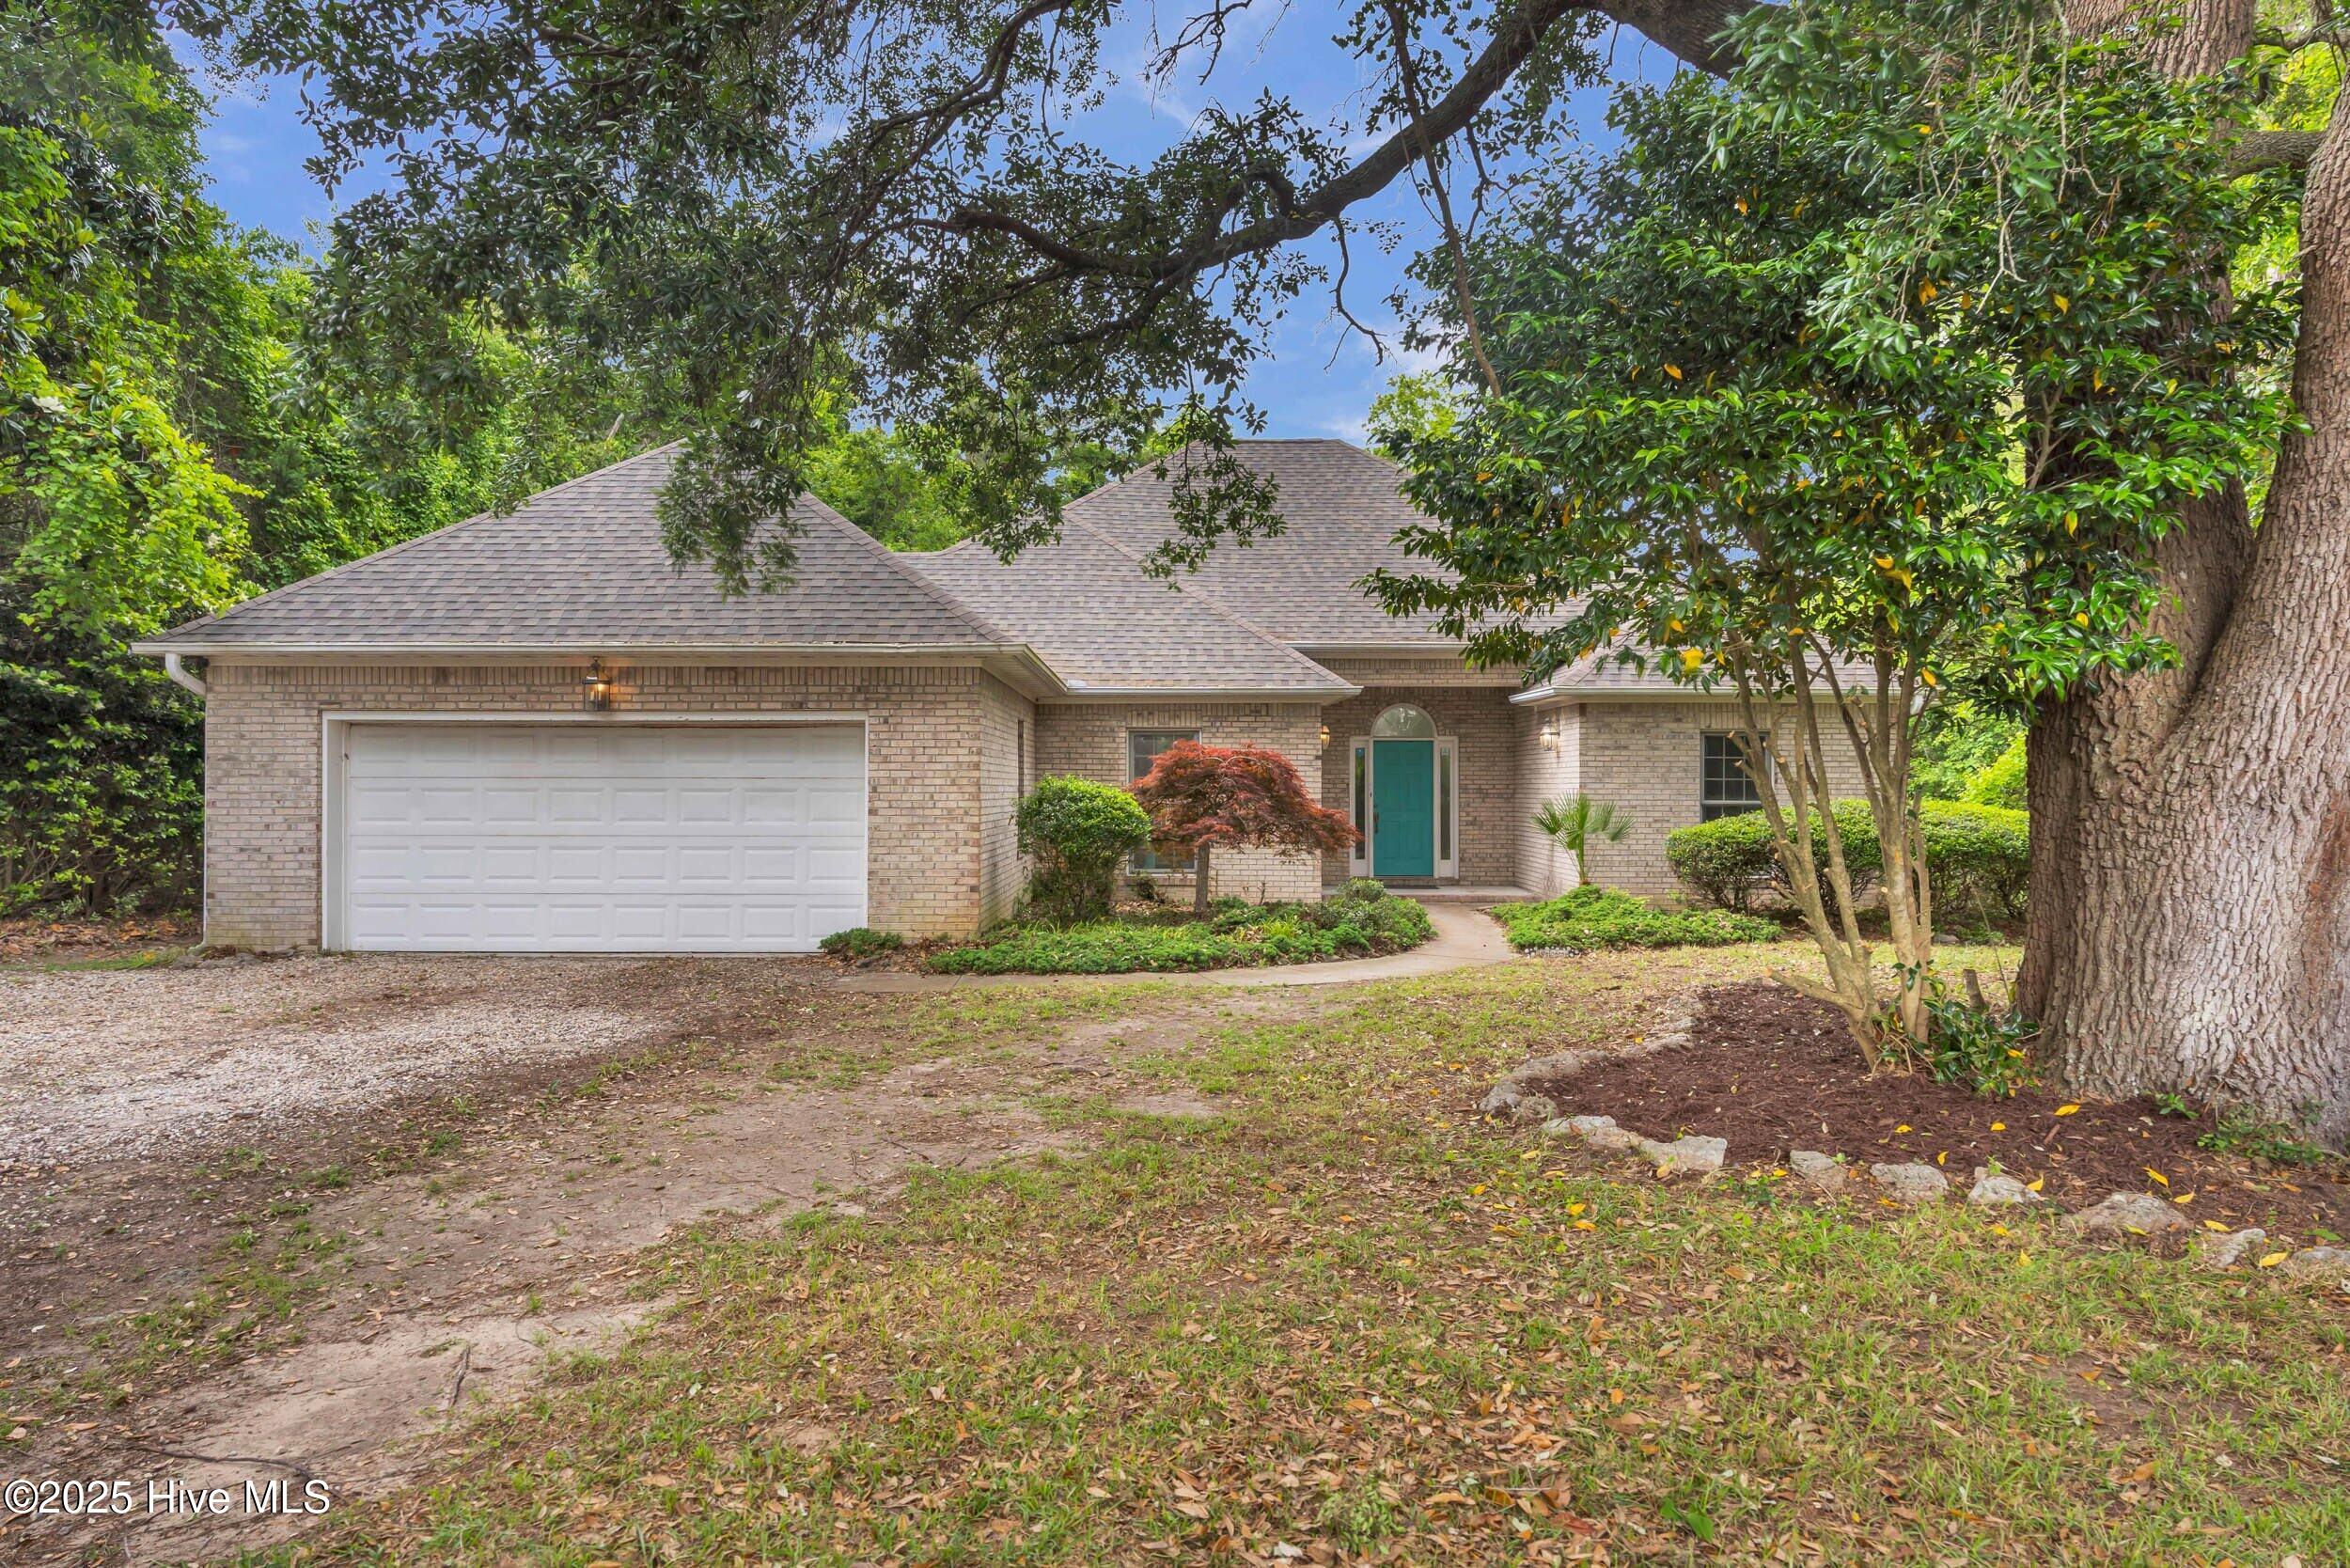
2008
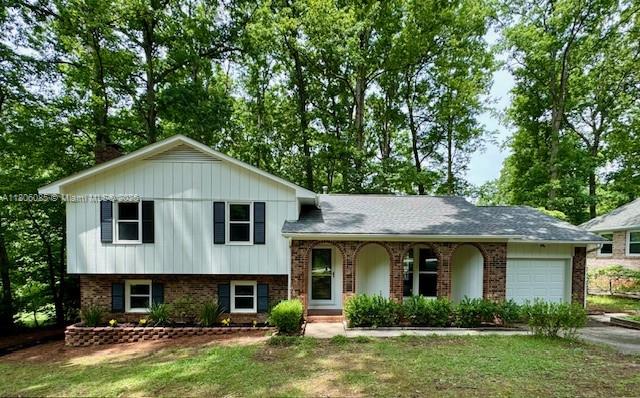
9008 Oak Ridge Plantation Dr, Calabash, NC 28467
$-601
Cash flow
-8.0%
Cash-on-Cash Return
3.8%
Cap rate
0.5%
Rent to Value Ratio
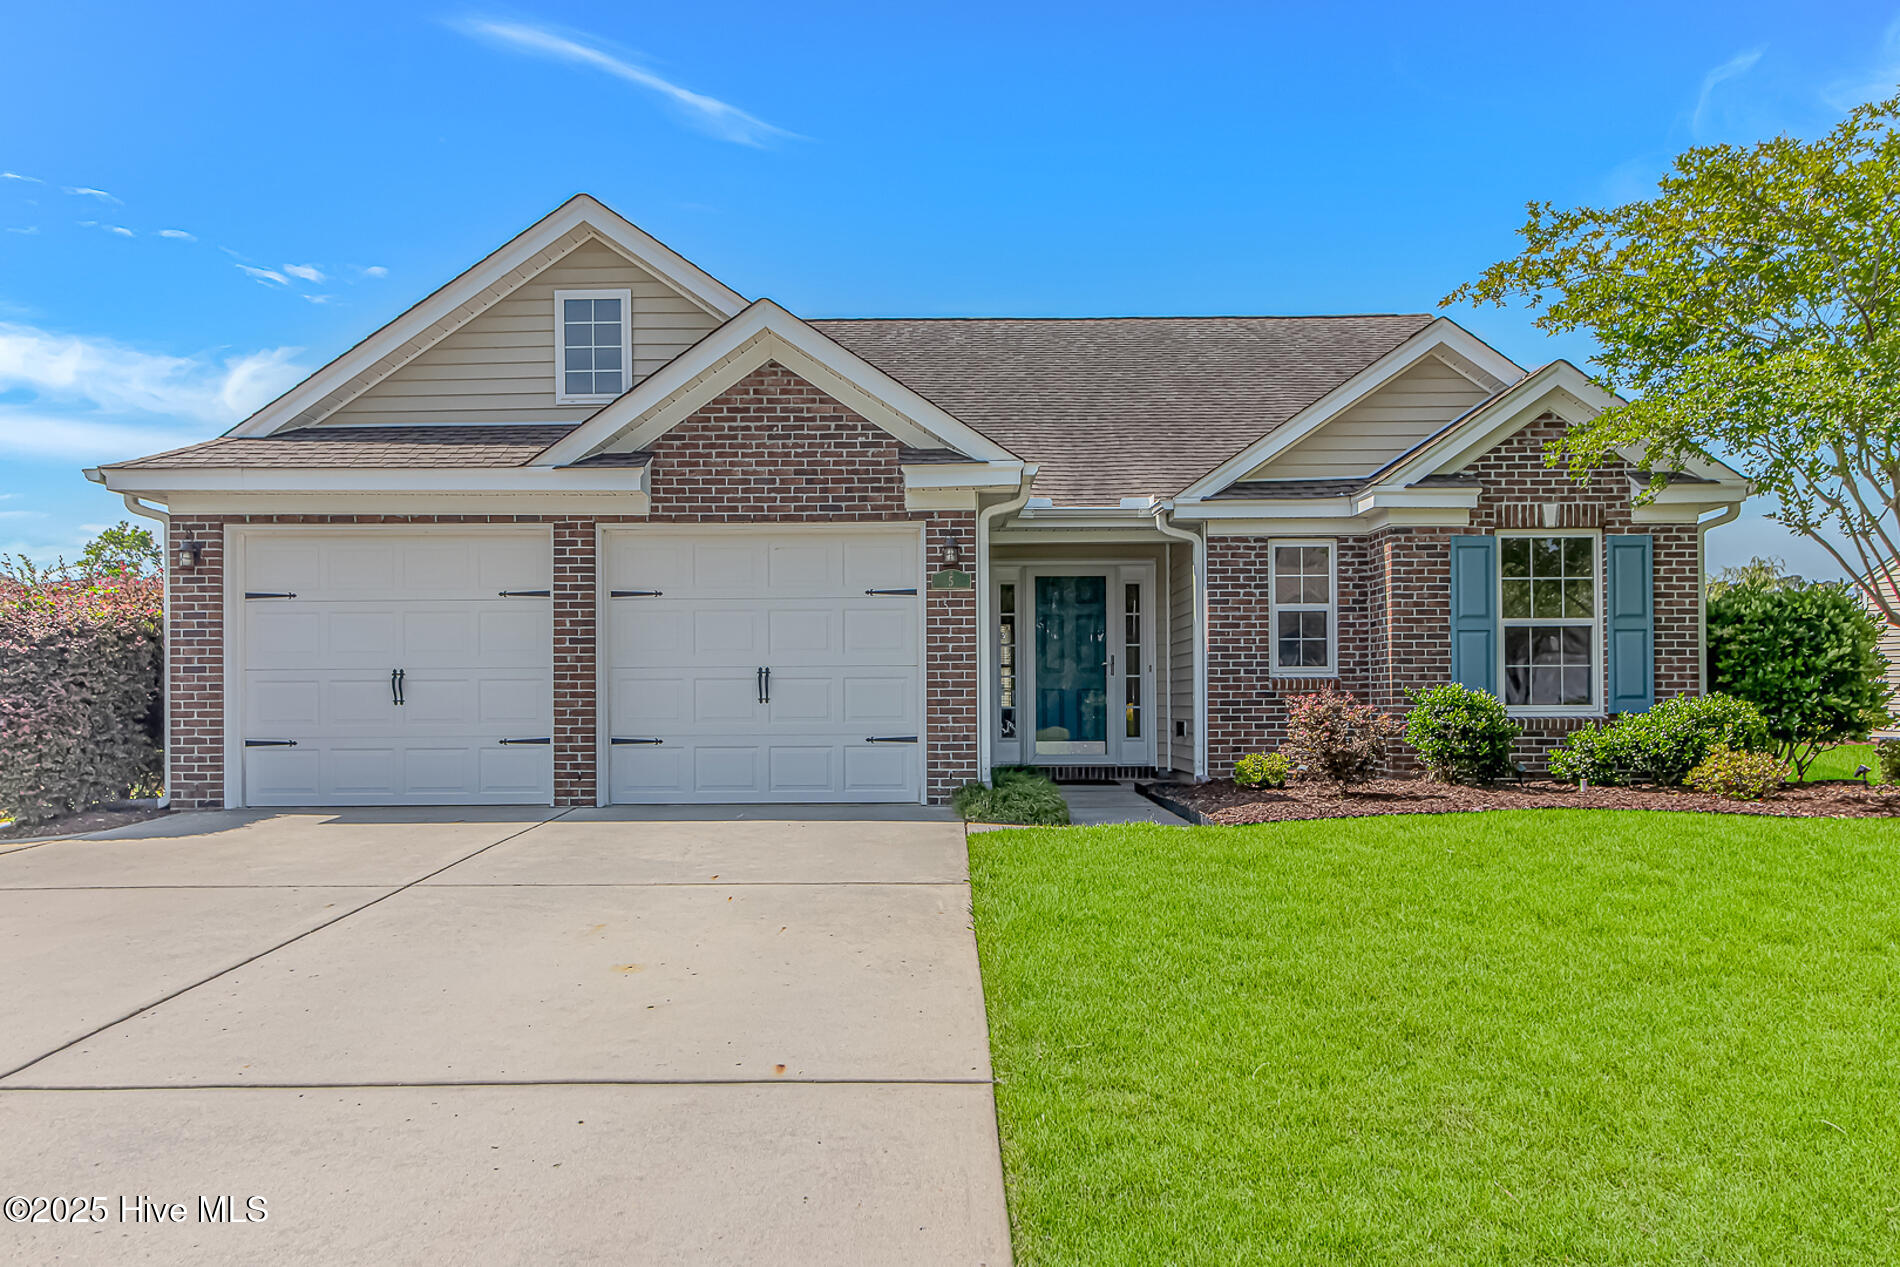
Active
$305,000
3
bds
|
3
ba
|
2,080
sqft
|
built
2005
152 Meadowlark Ln, Newport, NC 28570
$-201
Cash flow
-3.4%
Cash-on-Cash Return
4.9%
Cap rate
0.6%
Rent to Value Ratio
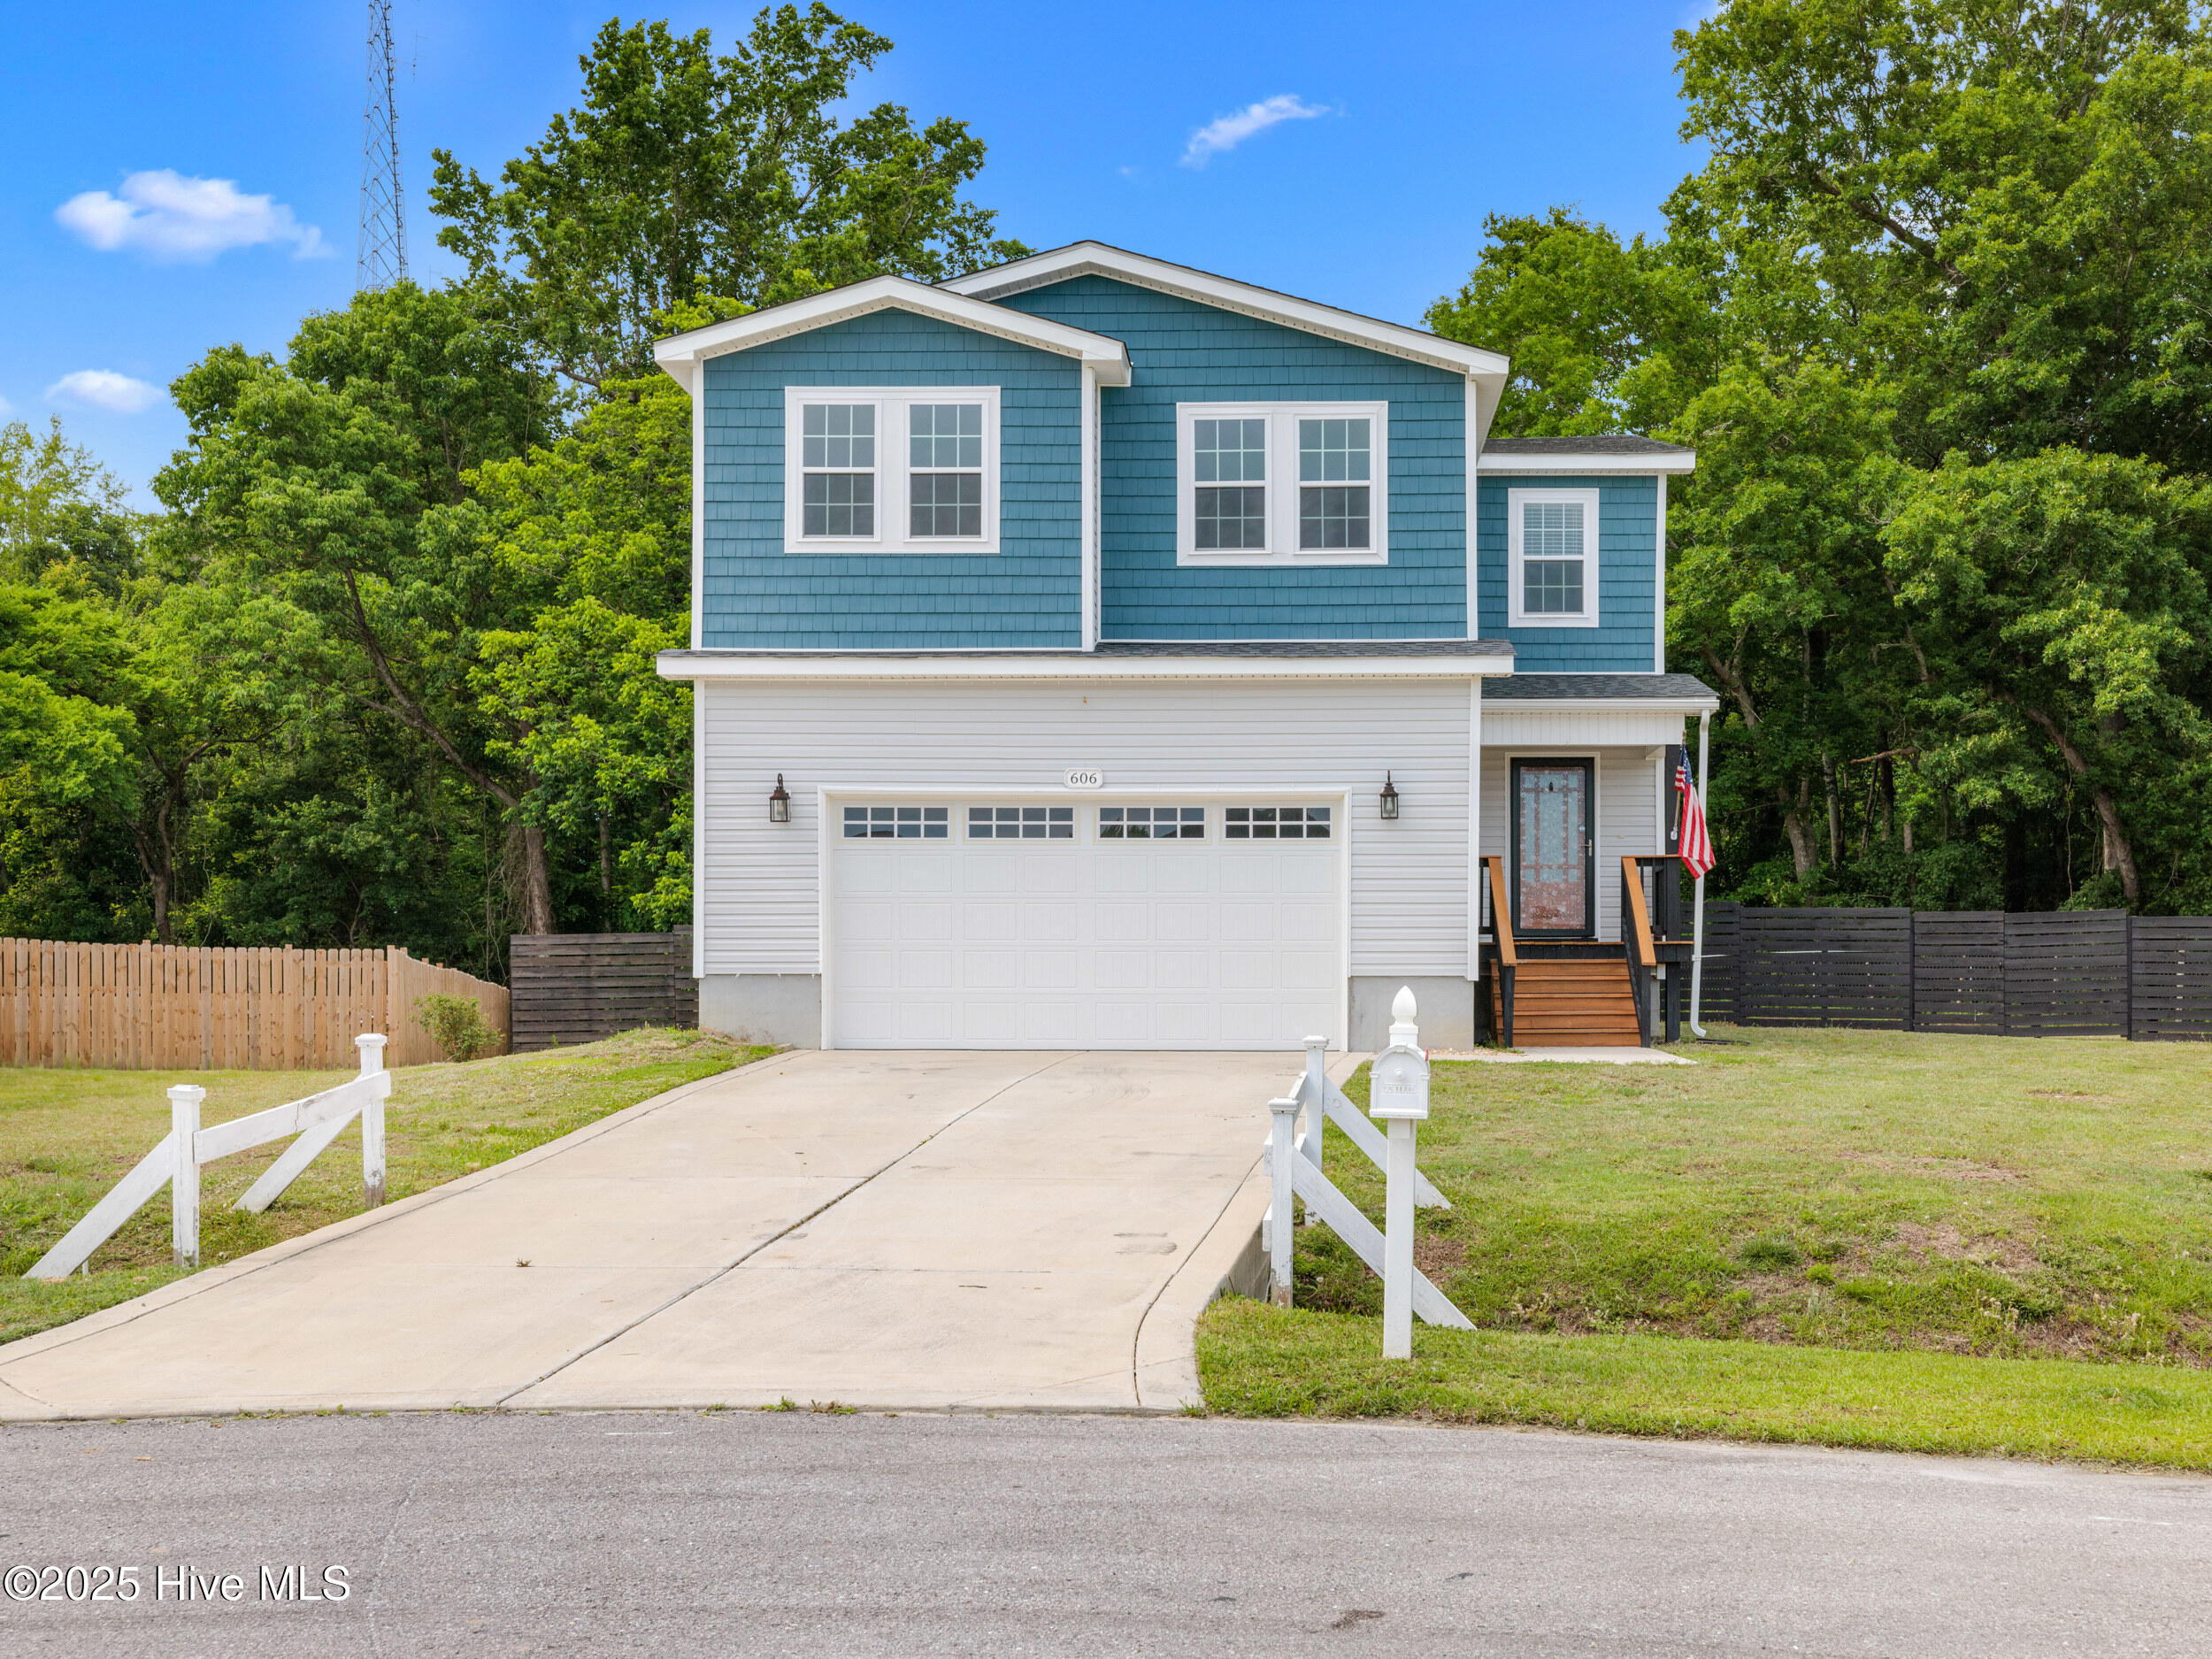
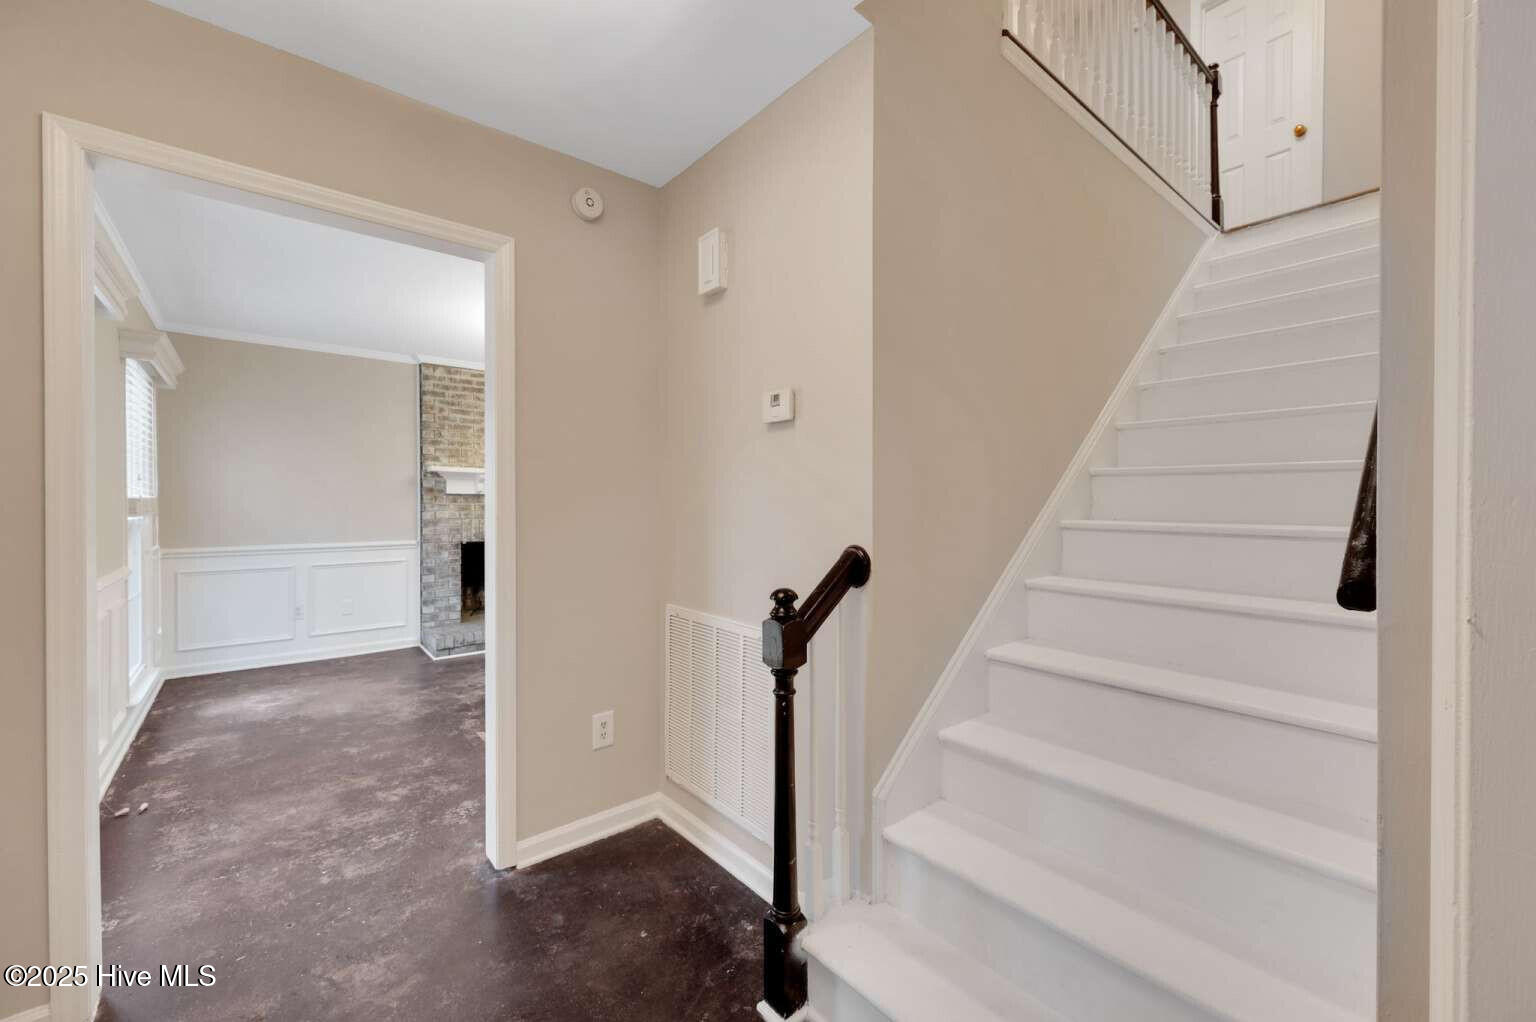
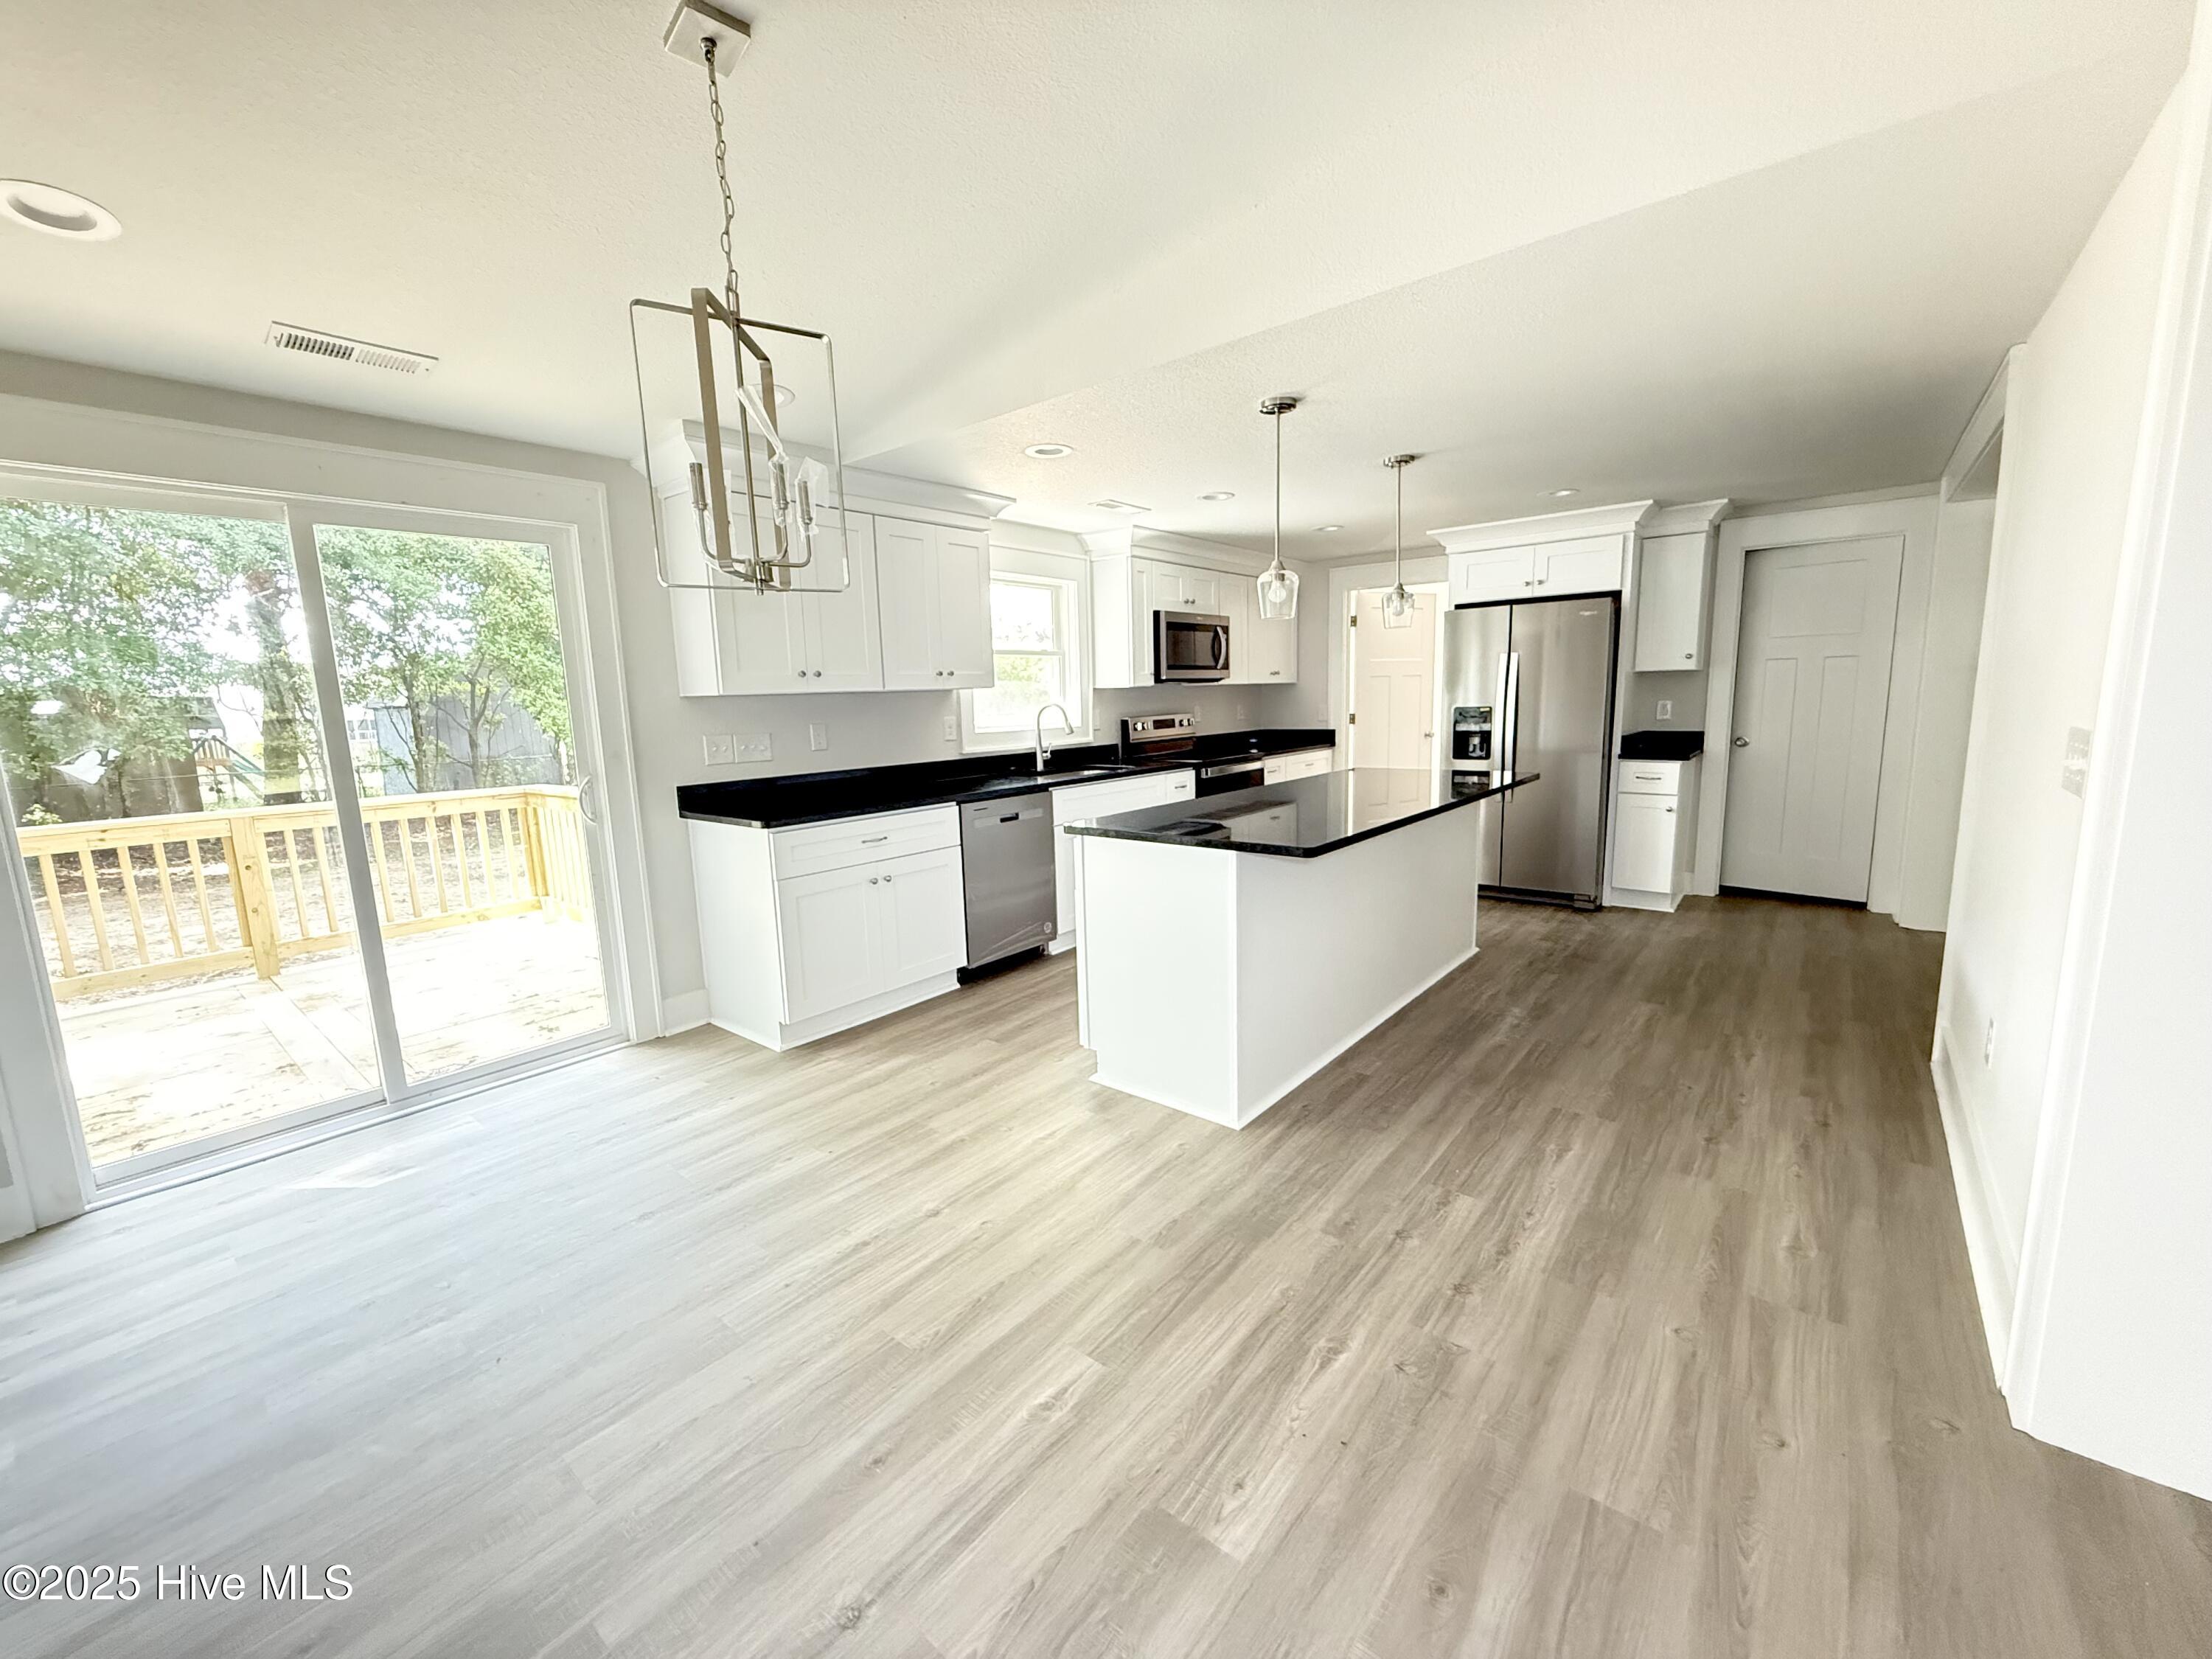
Pending
$332,900
3
bds
|
3
ba
|
2,225
sqft
|
built
2021
606 Sonata Ct, Richlands, NC 28574
$-140
Cash flow
-2.2%
Cash-on-Cash Return
5.2%
Cap rate
0.7%
Rent to Value Ratio

Active
$435,000
3
bds
|
3
ba
|
2,485
sqft
|
built
2006
53 Country Club Dr, Shallotte, NC 28470
$-579
Cash flow
-6.9%
Cash-on-Cash Return
4.1%
Cap rate
0.6%
Rent to Value Ratio

Active
$624,000
5
bds
|
4
ba
|
2,827
sqft
|
built
2005
4029 Berberis Way, Wilmington, NC 28412
$-1,175
Cash flow
-9.8%
Cash-on-Cash Return
3.4%
Cap rate
0.4%
Rent to Value Ratio
Active
$364,900
3
bds
|
3
ba
|
1,968
sqft
|
built
1987
2801 Hobart Dr, Wilmington, NC 28405
$-226
Cash flow
-3.2%
Cash-on-Cash Return
4.9%
Cap rate
0.7%
Rent to Value Ratio
Active
$408,000
4
bds
|
3
ba
|
1,672
sqft
|
built
1985
155 Launch Landing Rd, Moyock, NC 27958
$-413
Cash flow
-5.3%
Cash-on-Cash Return
4.5%
Cap rate
0.5%
Rent to Value Ratio
Pending
$229,000
1
bds
|
1
ba
|
375
sqft
|
built
2018
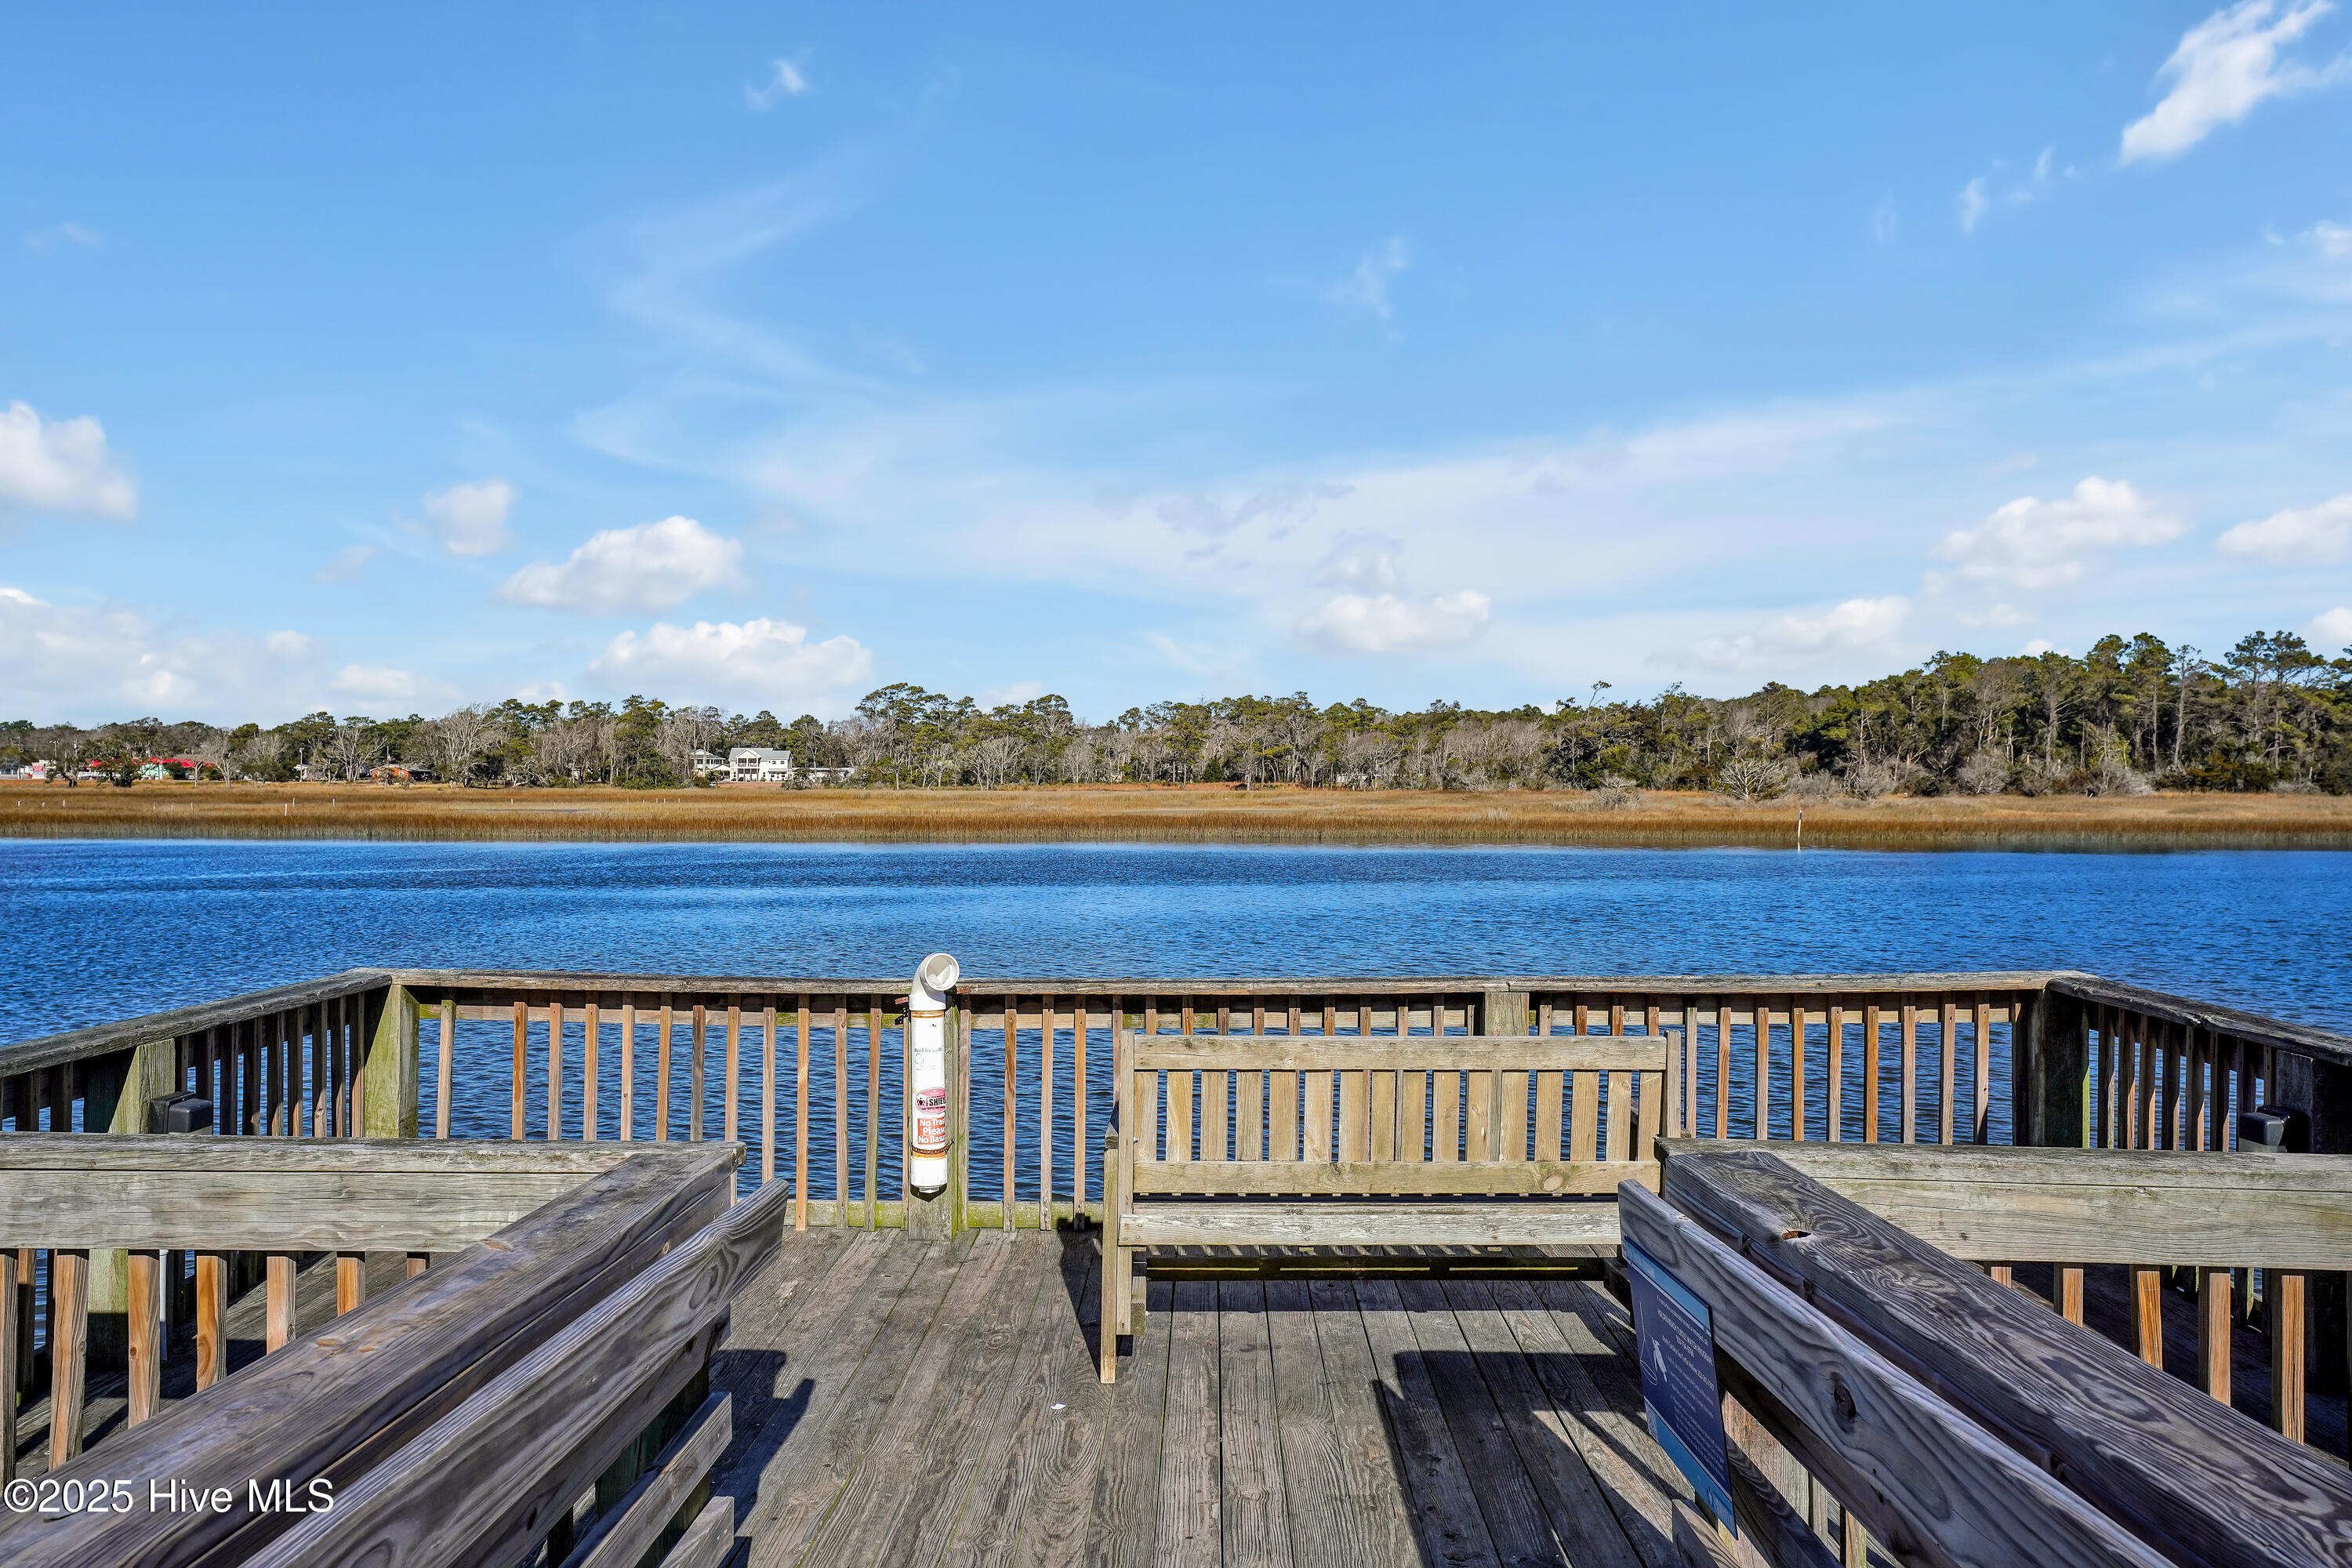
704 E Moore St, Southport, NC 28461
$-731
Cash flow
-16.7%
Cash-on-Cash Return
1.8%
Cap rate
0.5%
Rent to Value Ratio
Active
$539,000
4
bds
|
3
ba
|
1,809
sqft
|
built
1979
902 Vickie Dr, Cary, NC 27511
$-1,484
Cash flow
-14.4%
Cash-on-Cash Return
2.4%
Cap rate
0.4%
Rent to Value Ratio
Active
$849,000
3
bds
|
3
ba
|
1,904
sqft
|
built
1997
127 Halstead St, Holden Beach, NC 28462
$-1,826
Cash flow
-11.2%
Cash-on-Cash Return
3.1%
Cap rate
0.4%
Rent to Value Ratio
Pending
$735,000
4
bds
|
5
ba
|
3,357
sqft
|
built
2012
1013 Dowling Ct, Leland, NC 28451
$-1,973
Cash flow
-14.0%
Cash-on-Cash Return
2.5%
Cap rate
0.4%
Rent to Value Ratio
Active
$429,900
3
bds
|
3
ba
|
2,235
sqft
|
built
2005
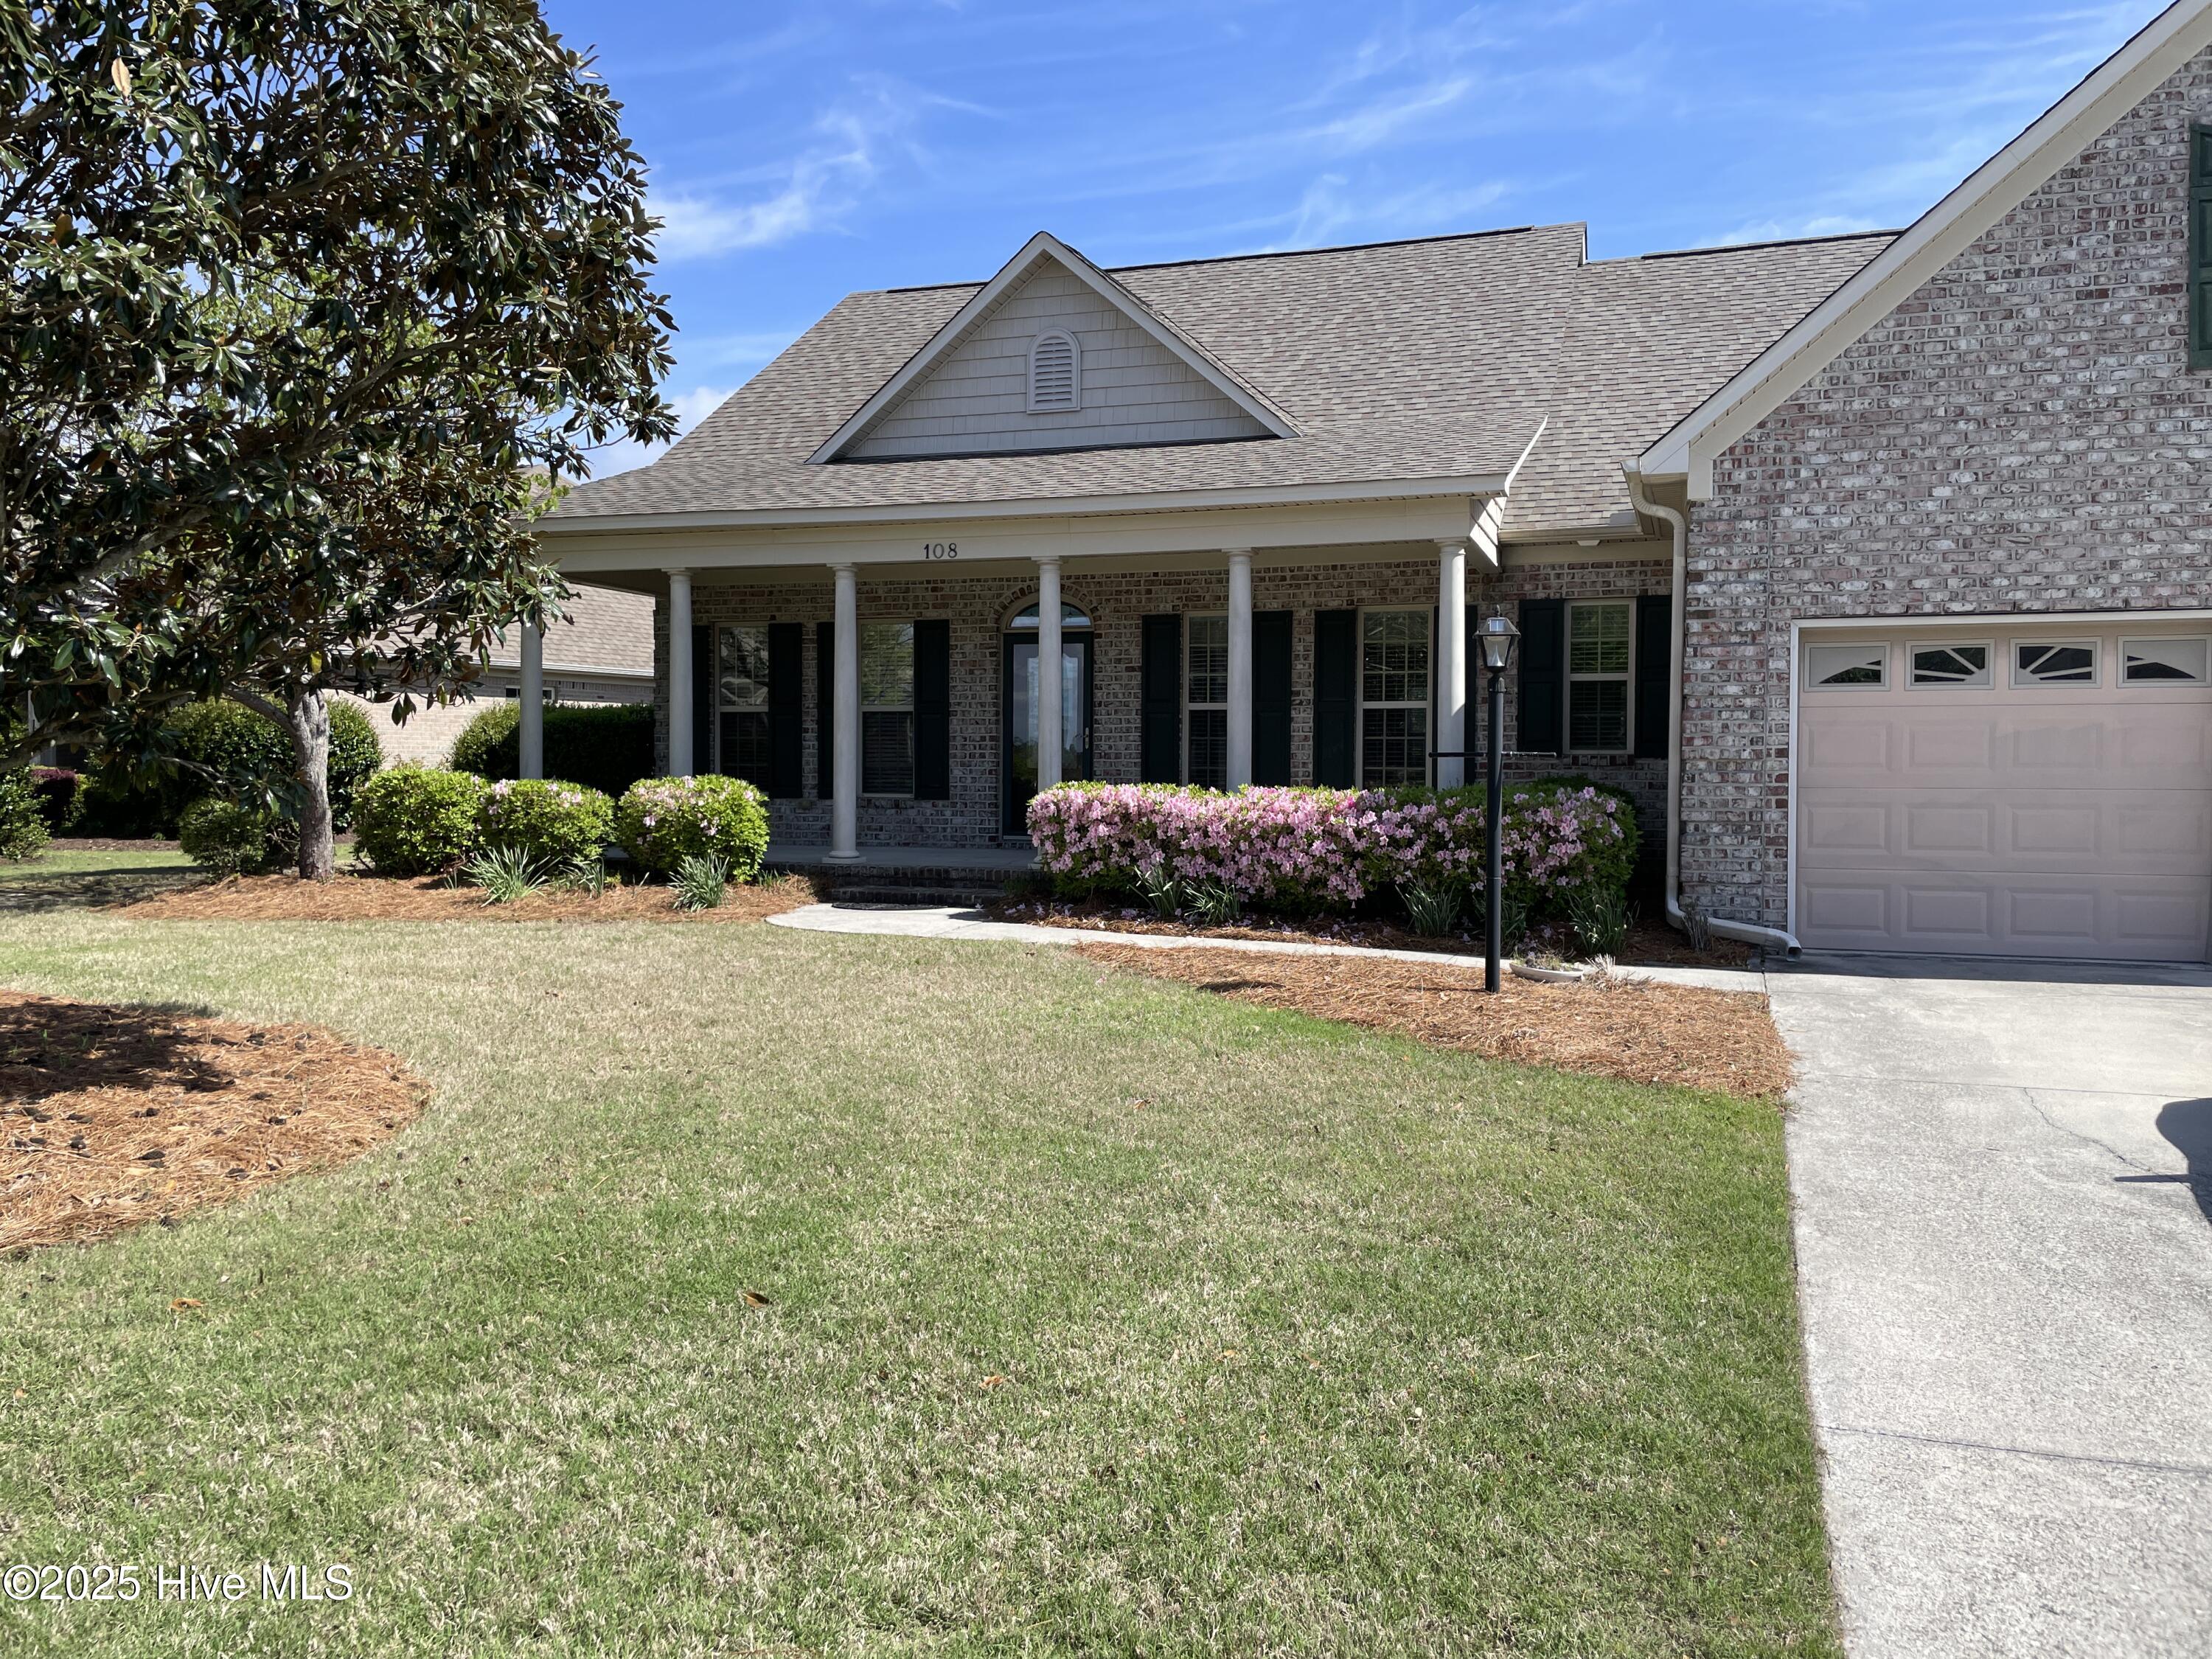
108 Sir Walter Ct, Hampstead, NC 28443
$-223
Cash flow
-2.7%
Cash-on-Cash Return
5.1%
Cap rate
0.7%
Rent to Value Ratio
Active
$275,000
3
bds
|
2
ba
|
1,795
sqft
|
built
1966
2912 Ridgecrest Dr, Rocky Mount, NC 27803
$-301
Cash flow
-5.7%
Cash-on-Cash Return
4.4%
Cap rate
0.6%
Rent to Value Ratio
Active
$315,000
3
bds
|
3
ba
|
2,465
sqft
|
built
1997
2750 Sunrise St SW, Supply, NC 28462
$-131
Cash flow
-2.2%
Cash-on-Cash Return
5.2%
Cap rate
0.6%
Rent to Value Ratio
Active
$344,888
3
bds
|
2
ba
|
1,595
sqft
|
built
2007
5 Coffee Mill Creek Ln, Carolina Shores, NC 28467
$-541
Cash flow
-8.2%
Cash-on-Cash Return
3.8%
Cap rate
0.6%
Rent to Value Ratio
Active
$434,900
4
bds
|
3
ba
|
2,281
sqft
|
built
2020
409 Kerr Lake Rd, Aberdeen, NC 28315
$-524
Cash flow
-6.3%
Cash-on-Cash Return
4.2%
Cap rate
0.6%
Rent to Value Ratio
Pending
$280,000
2
bds
|
2
ba
|
1,063
sqft
|
built
1942
2090 Burnett Blvd, Wilmington, NC 28401
$-320
Cash flow
-6.0%
Cash-on-Cash Return
4.3%
Cap rate
0.6%
Rent to Value Ratio
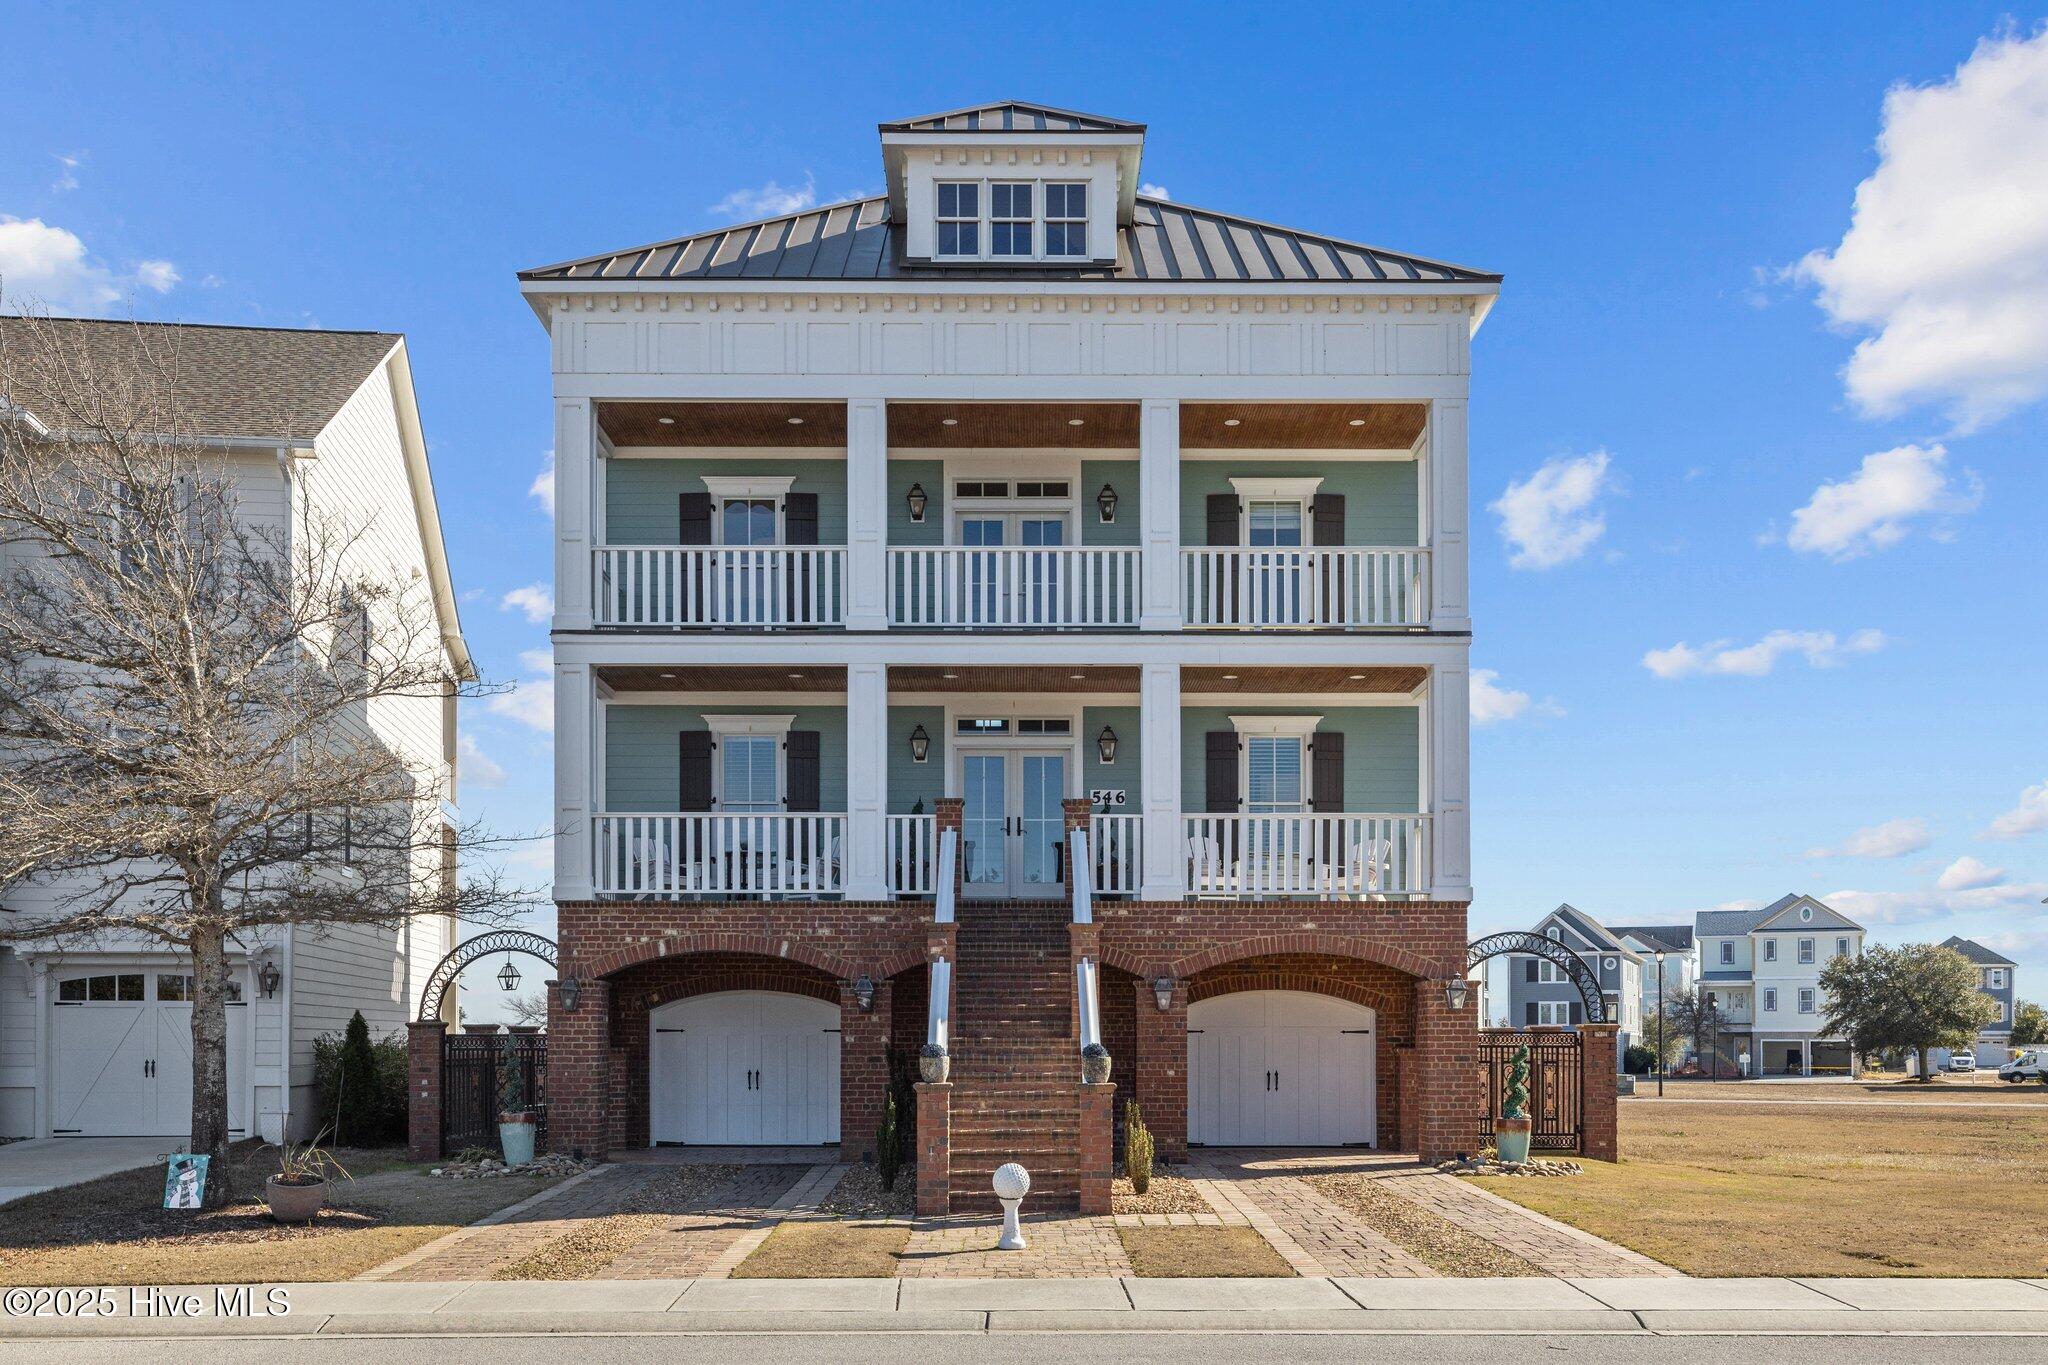
Active
$1,199,000
5
bds
|
7
ba
|
4,100
sqft
|
built
2010
546 Cannonsgate Dr, Newport, NC 28570
$-2,179
Cash flow
-9.5%
Cash-on-Cash Return
3.5%
Cap rate
0.5%
Rent to Value Ratio
Active
$285,000
2
bds
|
2
ba
|
1,579
sqft
|
built
1981
20 Carolina Shores Pkwy, Carolina Shores, NC 28467
$-114
Cash flow
-2.1%
Cash-on-Cash Return
5.2%
Cap rate
0.7%
Rent to Value Ratio
Active
$354,900
2
bds
|
3
ba
|
1,435
sqft
|
built
1998
502 Main Street Ext, Swansboro, NC 28584
$-1,110
Cash flow
-16.3%
Cash-on-Cash Return
1.9%
Cap rate
0.5%
Rent to Value Ratio
Active
$845,000
4
bds
|
4
ba
|
3,546
sqft
|
built
2009
1092 Leesburg Dr, Leland, NC 28451
$-2,452
Cash flow
-15.1%
Cash-on-Cash Return
2.2%
Cap rate
0.4%
Rent to Value Ratio
Active
$830,000
3
bds
|
3
ba
|
1,576
sqft
|
built
1998
118 Clippership Dr, Holden Beach, NC 28462
$-2,077
Cash flow
-13.1%
Cash-on-Cash Return
2.7%
Cap rate
0.4%
Rent to Value Ratio
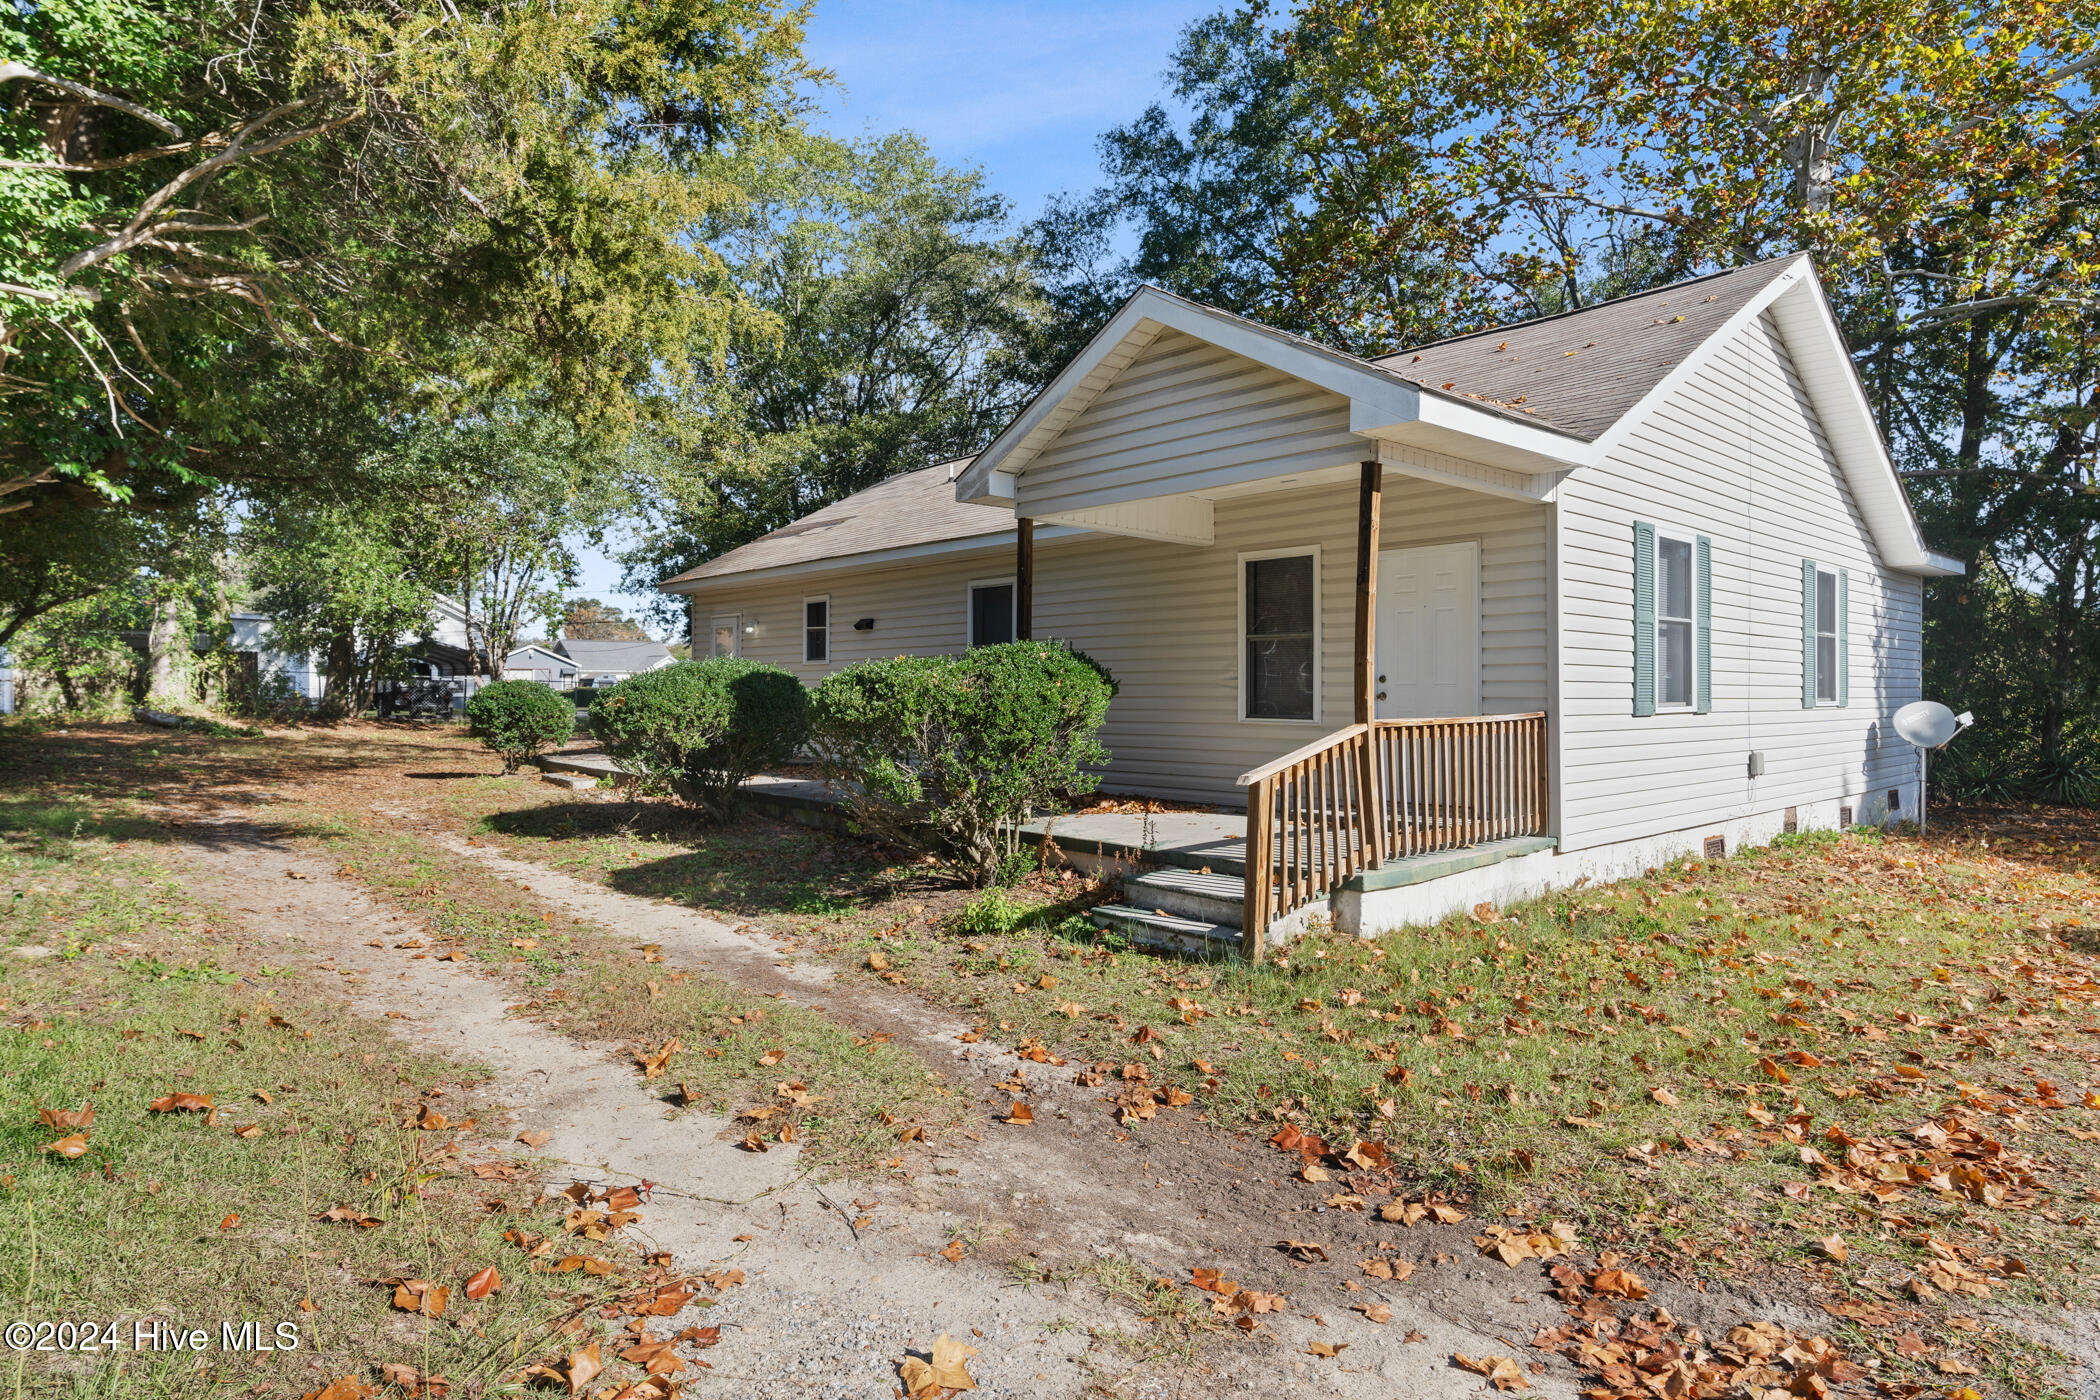
Active
$180,000
3
bds
|
2
ba
|
1,141
sqft
|
built
1988
660 Beachview Dr SE, Bolivia, NC 28422
$369
Cash flow
10.7%
Cash-on-Cash Return
8.1%
Cap rate
1.0%
Rent to Value Ratio

Pending
$450,000
3
bds
|
3
ba
|
1,984
sqft
|
built
2018
1160 Morganton Rd, Pinehurst, NC 28374
$-405
Cash flow
-4.7%
Cash-on-Cash Return
4.6%
Cap rate
0.6%
Rent to Value Ratio
Active
$289,000
3
bds
|
2
ba
|
2,408
sqft
|
built
1973
1901 E Mulberry St, Goldsboro, NC 27530
$357
Cash flow
6.4%
Cash-on-Cash Return
7.2%
Cap rate
0.9%
Rent to Value Ratio
Active
$149,000
3
bds
|
3
ba
|
1,200
sqft
|
built
1924
116 7th St, Rockingham, NC 28379
$-6
Cash flow
-0.2%
Cash-on-Cash Return
5.6%
Cap rate
0.7%
Rent to Value Ratio
Active
$109,900
3
bds
|
2
ba
|
1,234
sqft
|
built
1952
1620 Old Wilson Rd, Rocky Mount, NC 27801
$446
Cash flow
21.2%
Cash-on-Cash Return
10.5%
Cap rate
1.3%
Rent to Value Ratio
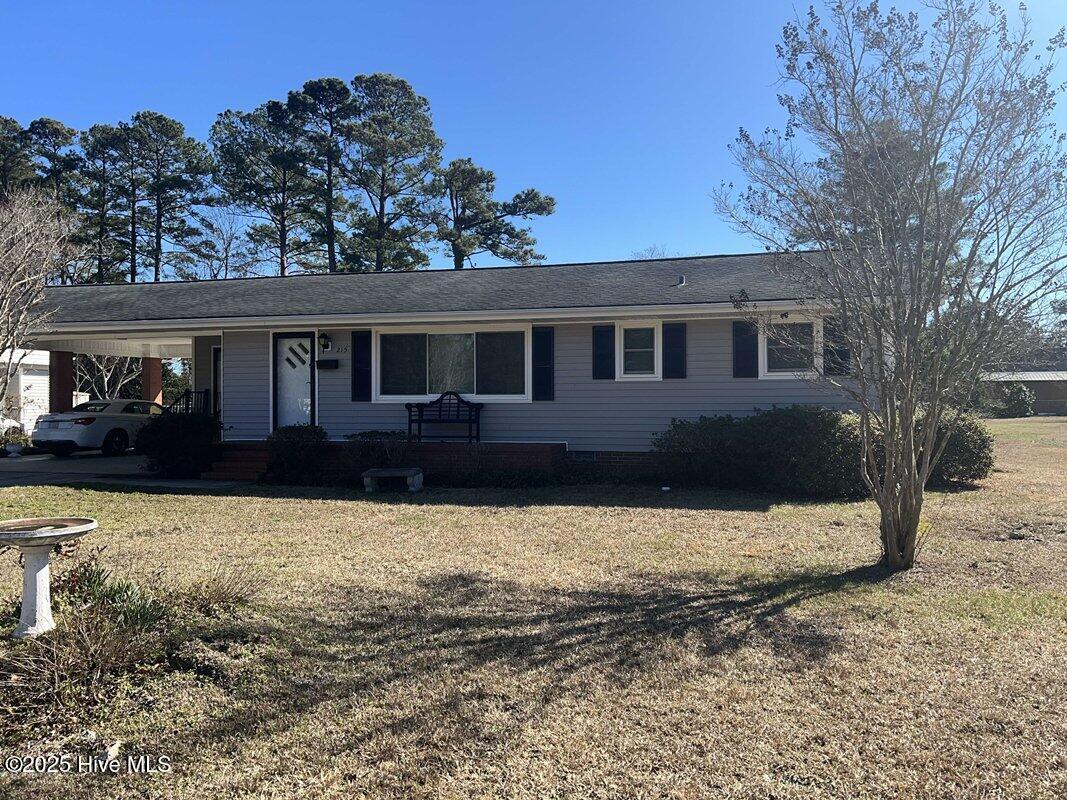
Active
$265,000
3
bds
|
2
ba
|
1,400
sqft
|
built
1958
215 Nunn St, Havelock, NC 28532
$-430
Cash flow
-8.5%
Cash-on-Cash Return
3.7%
Cap rate
0.5%
Rent to Value Ratio
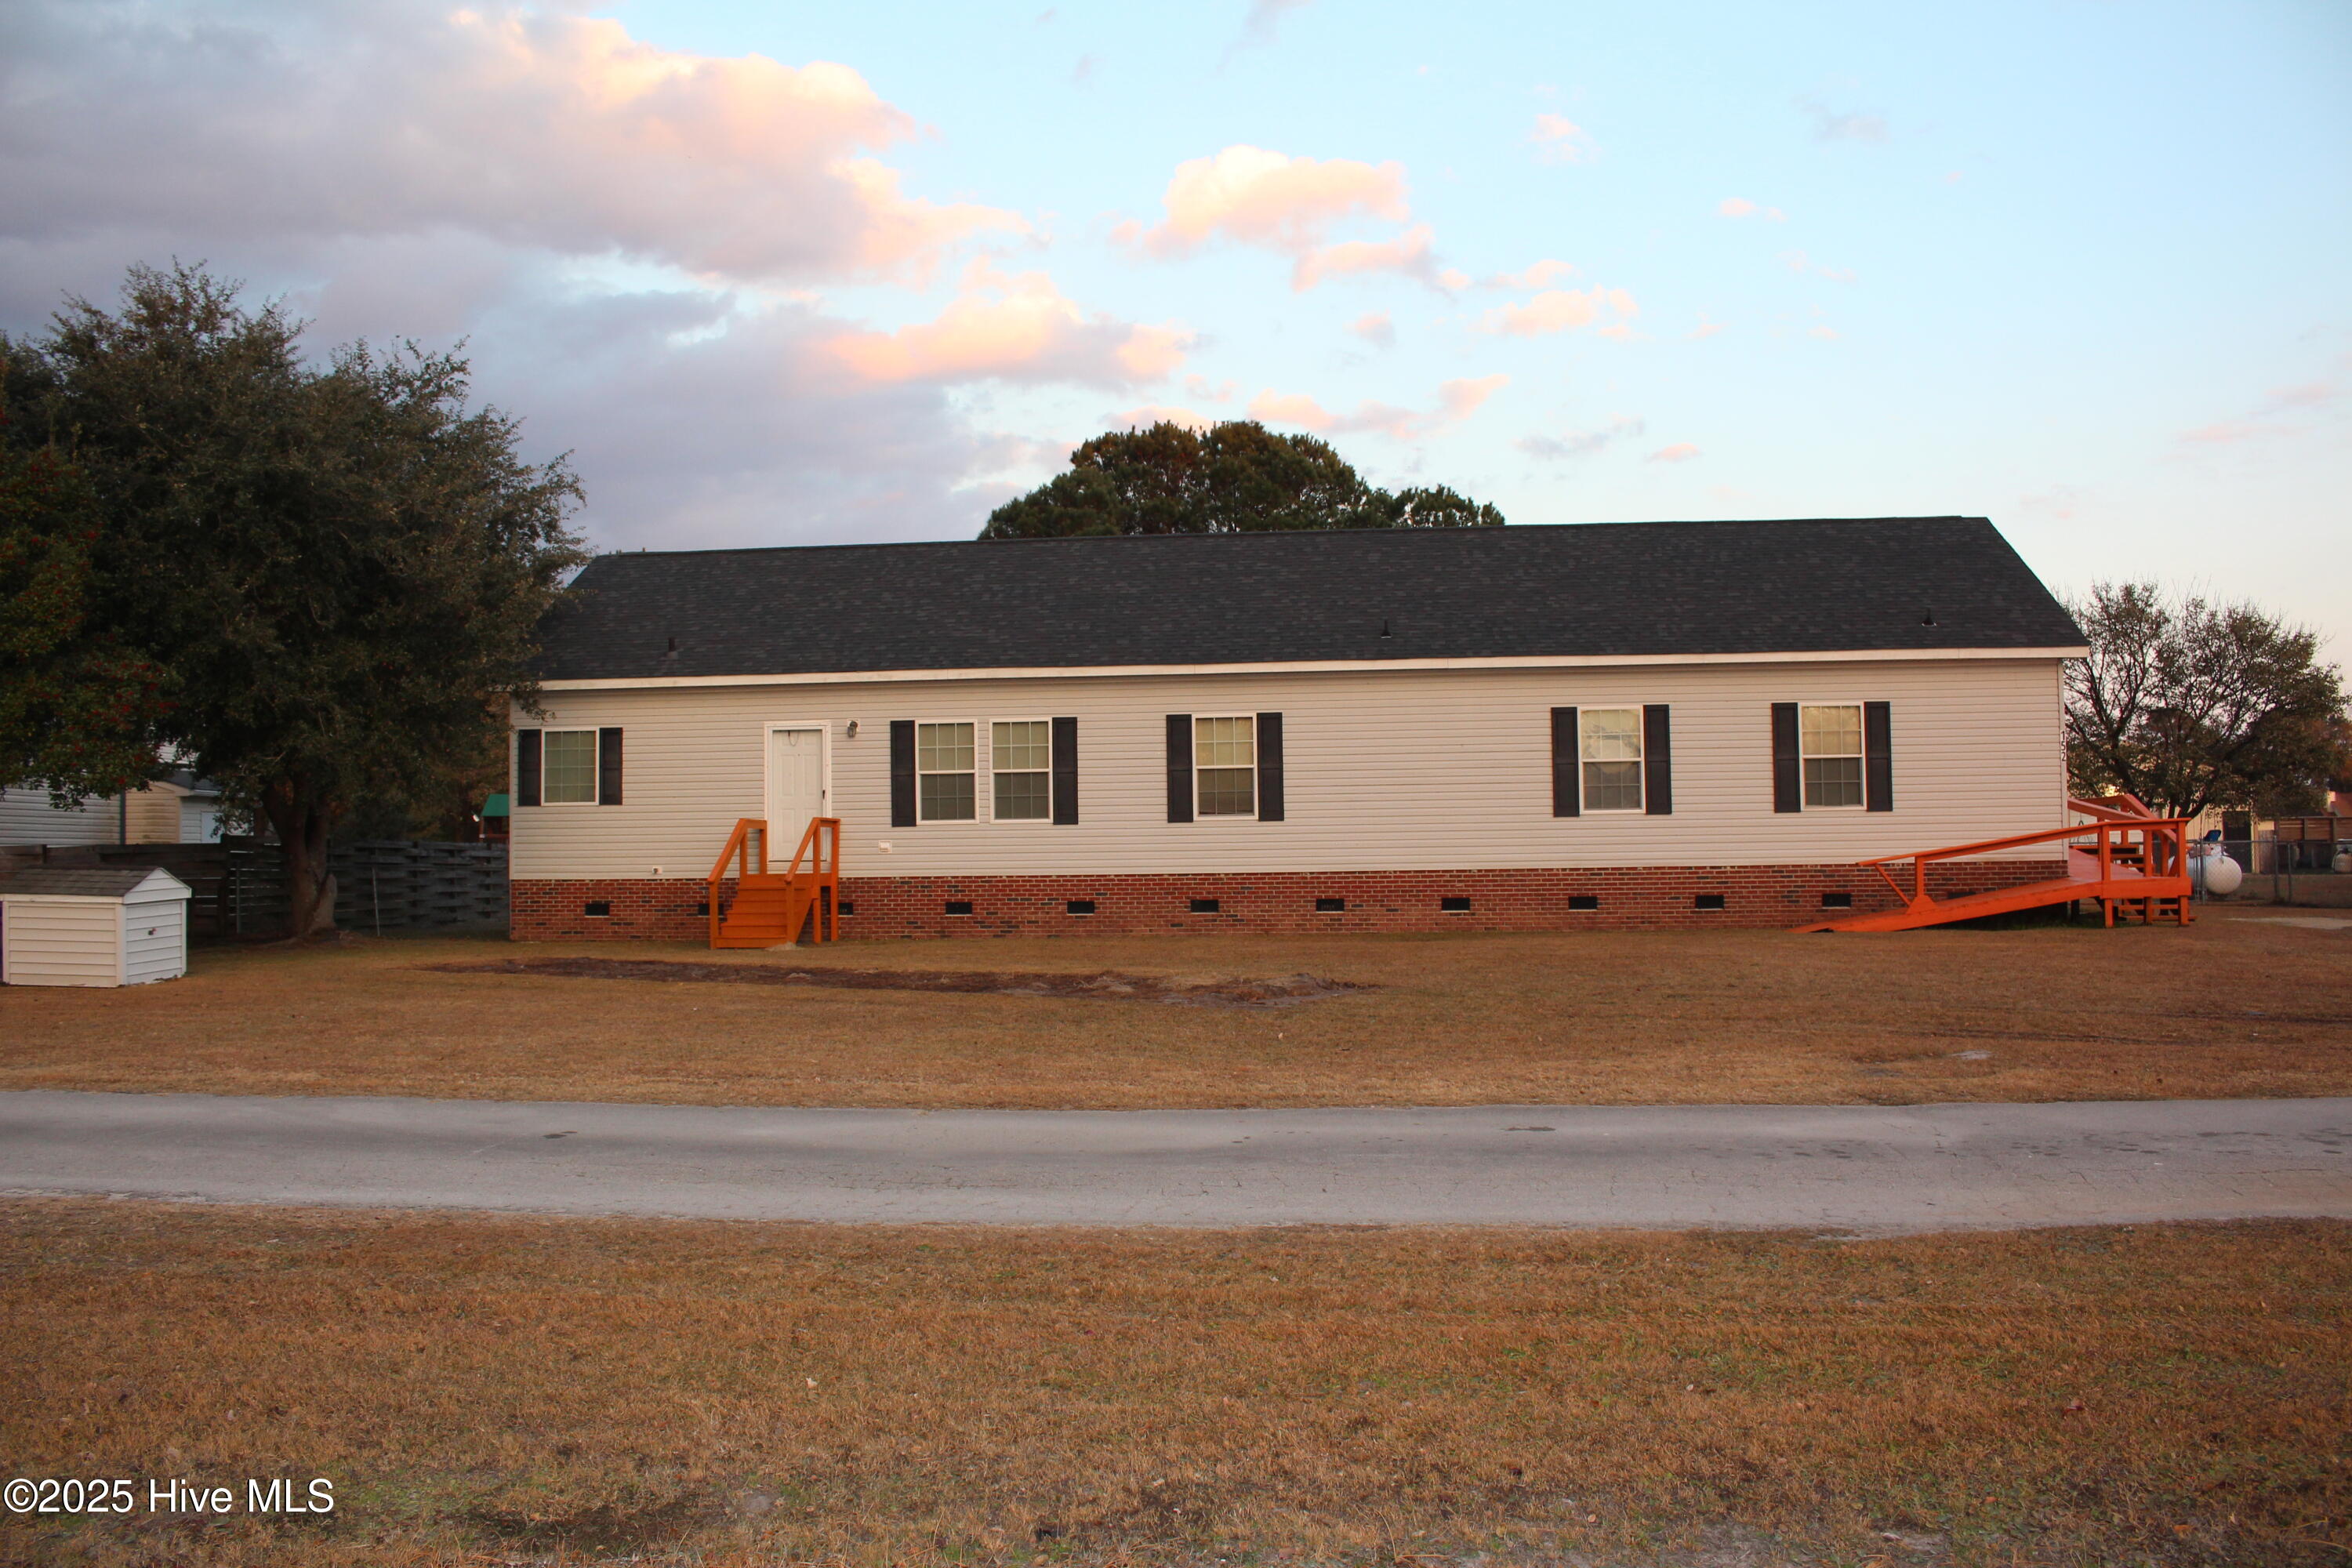
Active
$239,900
3
bds
|
2
ba
|
1,880
sqft
|
built
1962
101 Kirkland Dr, Greenville, NC 27858
$383
Cash flow
8.3%
Cash-on-Cash Return
7.6%
Cap rate
0.9%
Rent to Value Ratio
Pending
$489,000
3
bds
|
2
ba
|
2,482
sqft
|
built
1996
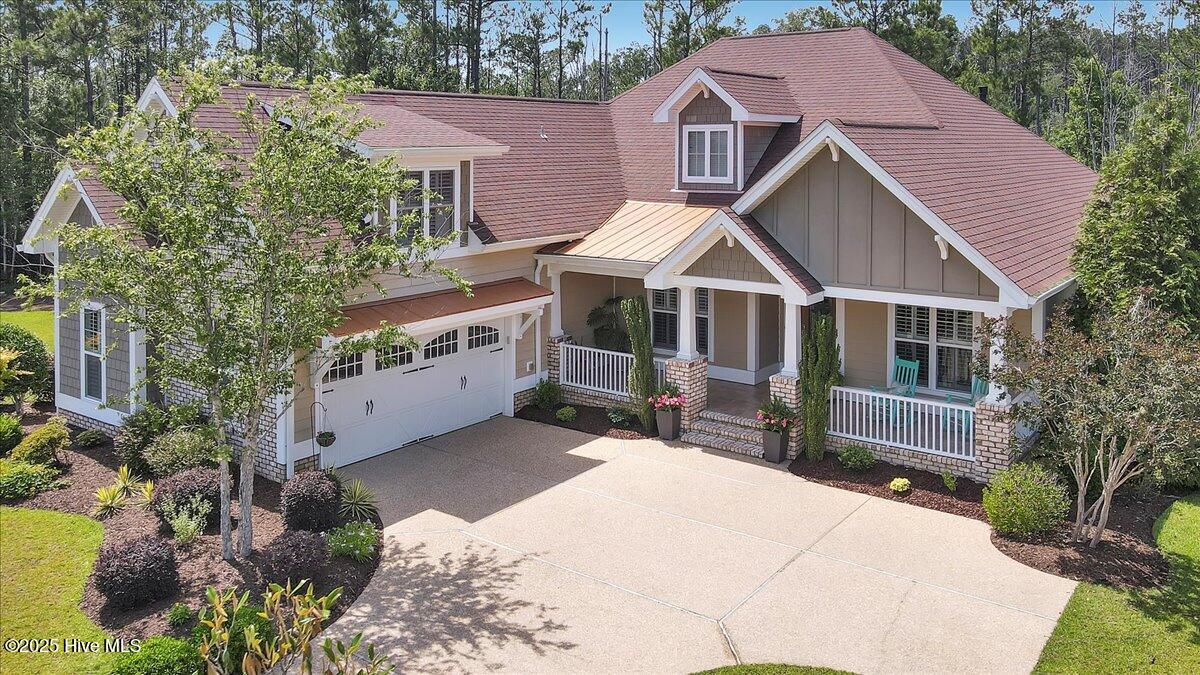
707 Brown Pelican Ln, Hampstead, NC 28443
$-635
Cash flow
-6.8%
Cash-on-Cash Return
4.1%
Cap rate
0.6%
Rent to Value Ratio

Active
$535,000
4
bds
|
3
ba
|
2,655
sqft
|
built
2017
119 Elrod Rd, Moyock, NC 27958
$-548
Cash flow
-5.3%
Cash-on-Cash Return
4.5%
Cap rate
0.6%
Rent to Value Ratio
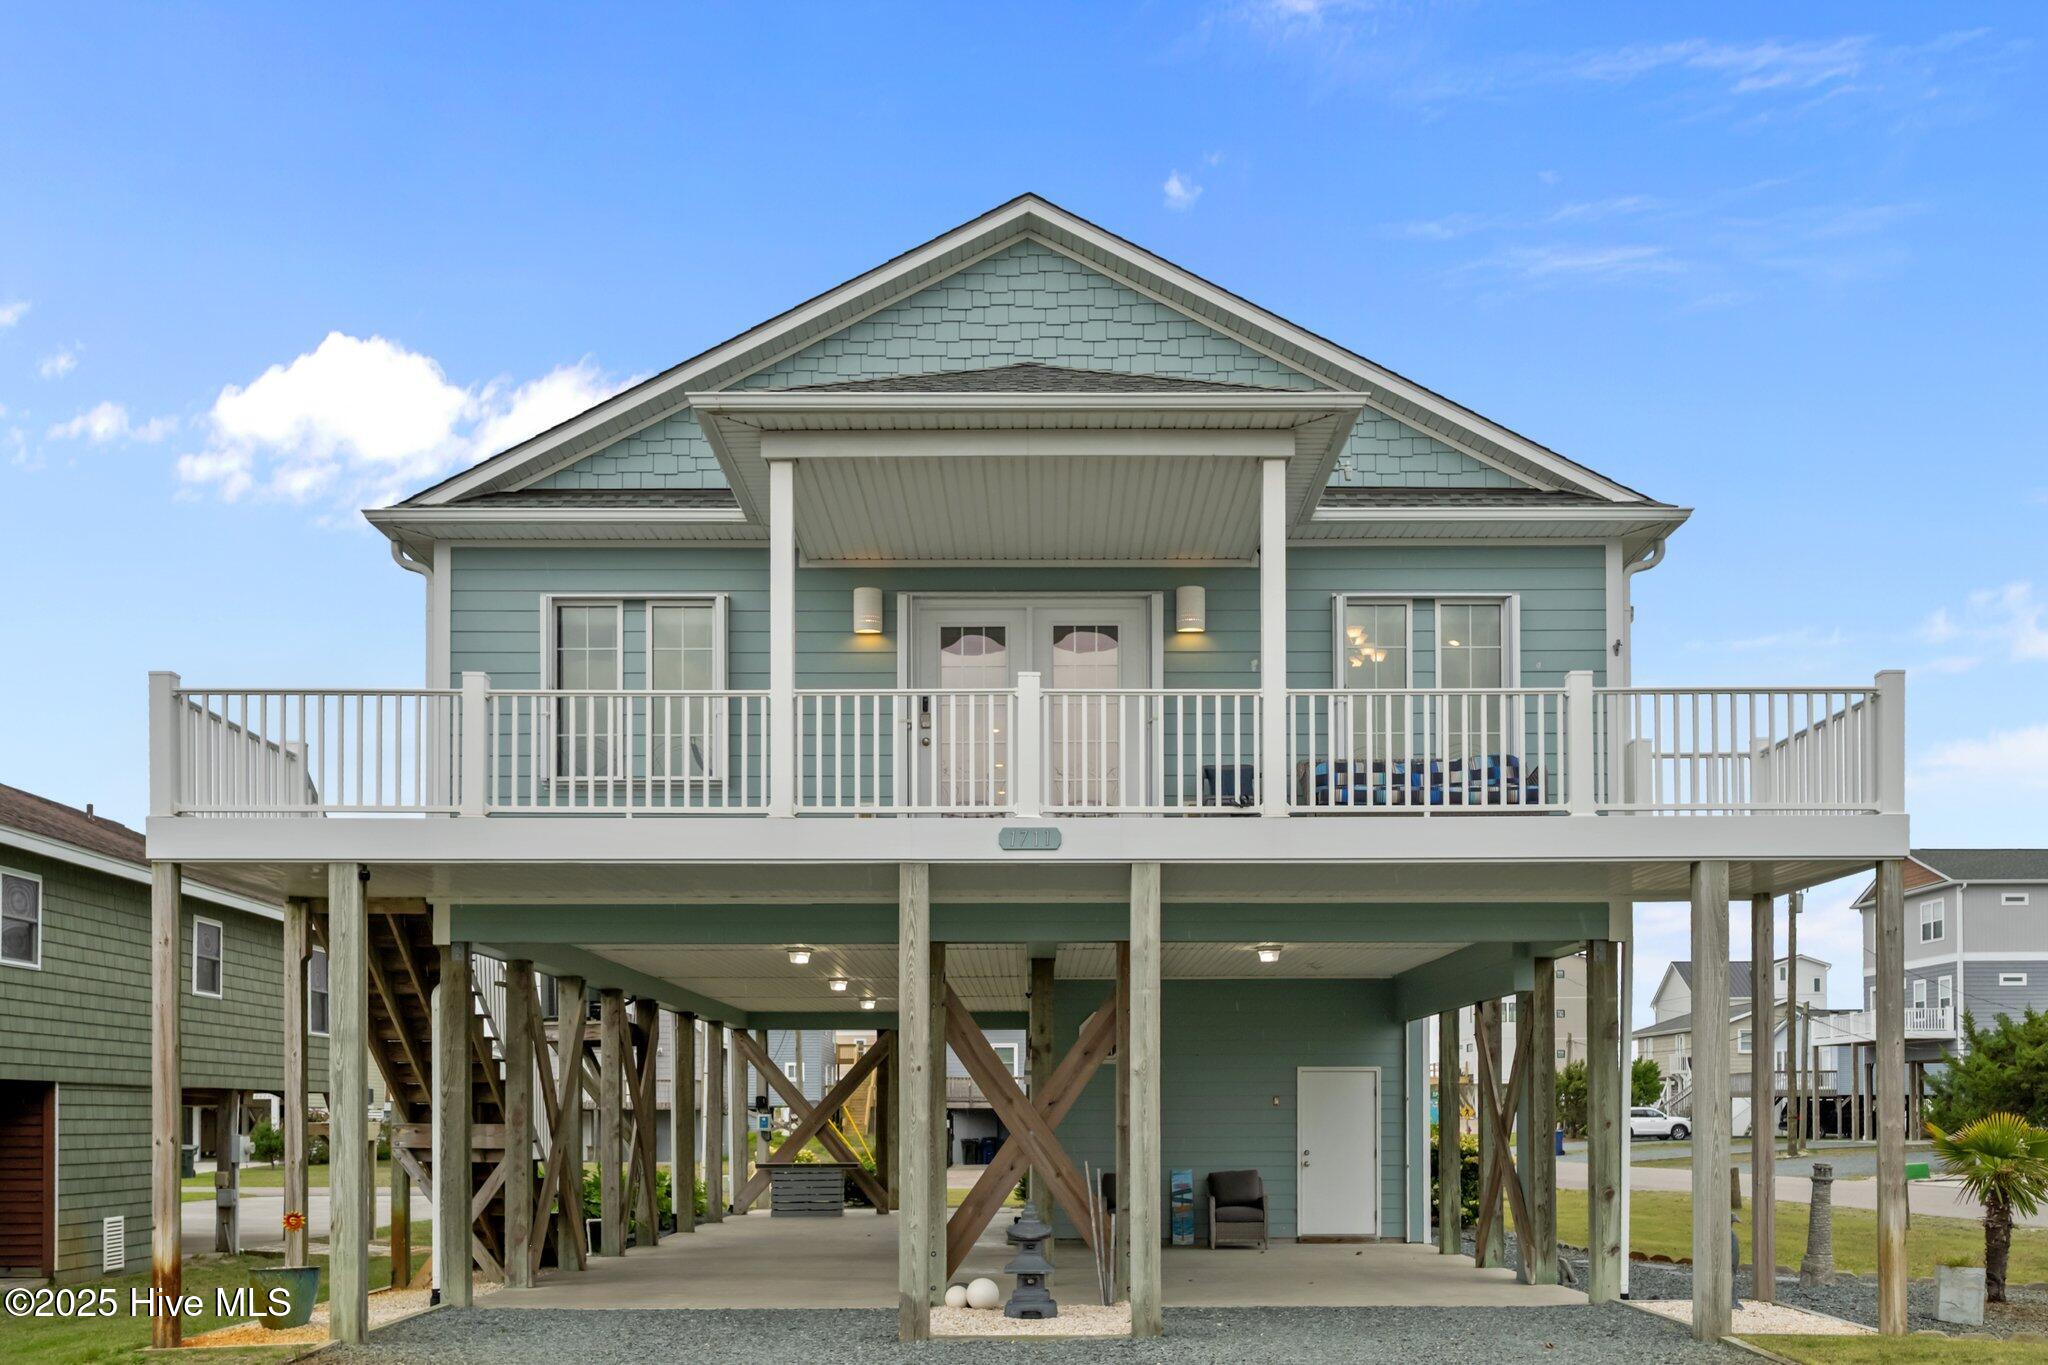
Active
$990,000
3
bds
|
4
ba
|
2,000
sqft
|
built
2012
1711 S Anderson Blvd, Surf City, NC 28445
$-3,362
Cash flow
-17.7%
Cash-on-Cash Return
1.6%
Cap rate
0.3%
Rent to Value Ratio

Active
$310,000
3
bds
|
3
ba
|
1,739
sqft
|
built
2005
4979 Montserrat Dr, Southport, NC 28461
$-288
Cash flow
-4.8%
Cash-on-Cash Return
4.6%
Cap rate
0.6%
Rent to Value Ratio
Active
$595,000
3
bds
|
2
ba
|
3,070
sqft
|
built
1985
457 Muddy Creek Rd, Aurora, NC 27806
$-884
Cash flow
-7.8%
Cash-on-Cash Return
3.9%
Cap rate
0.5%
Rent to Value Ratio
Active
$264,900
3
bds
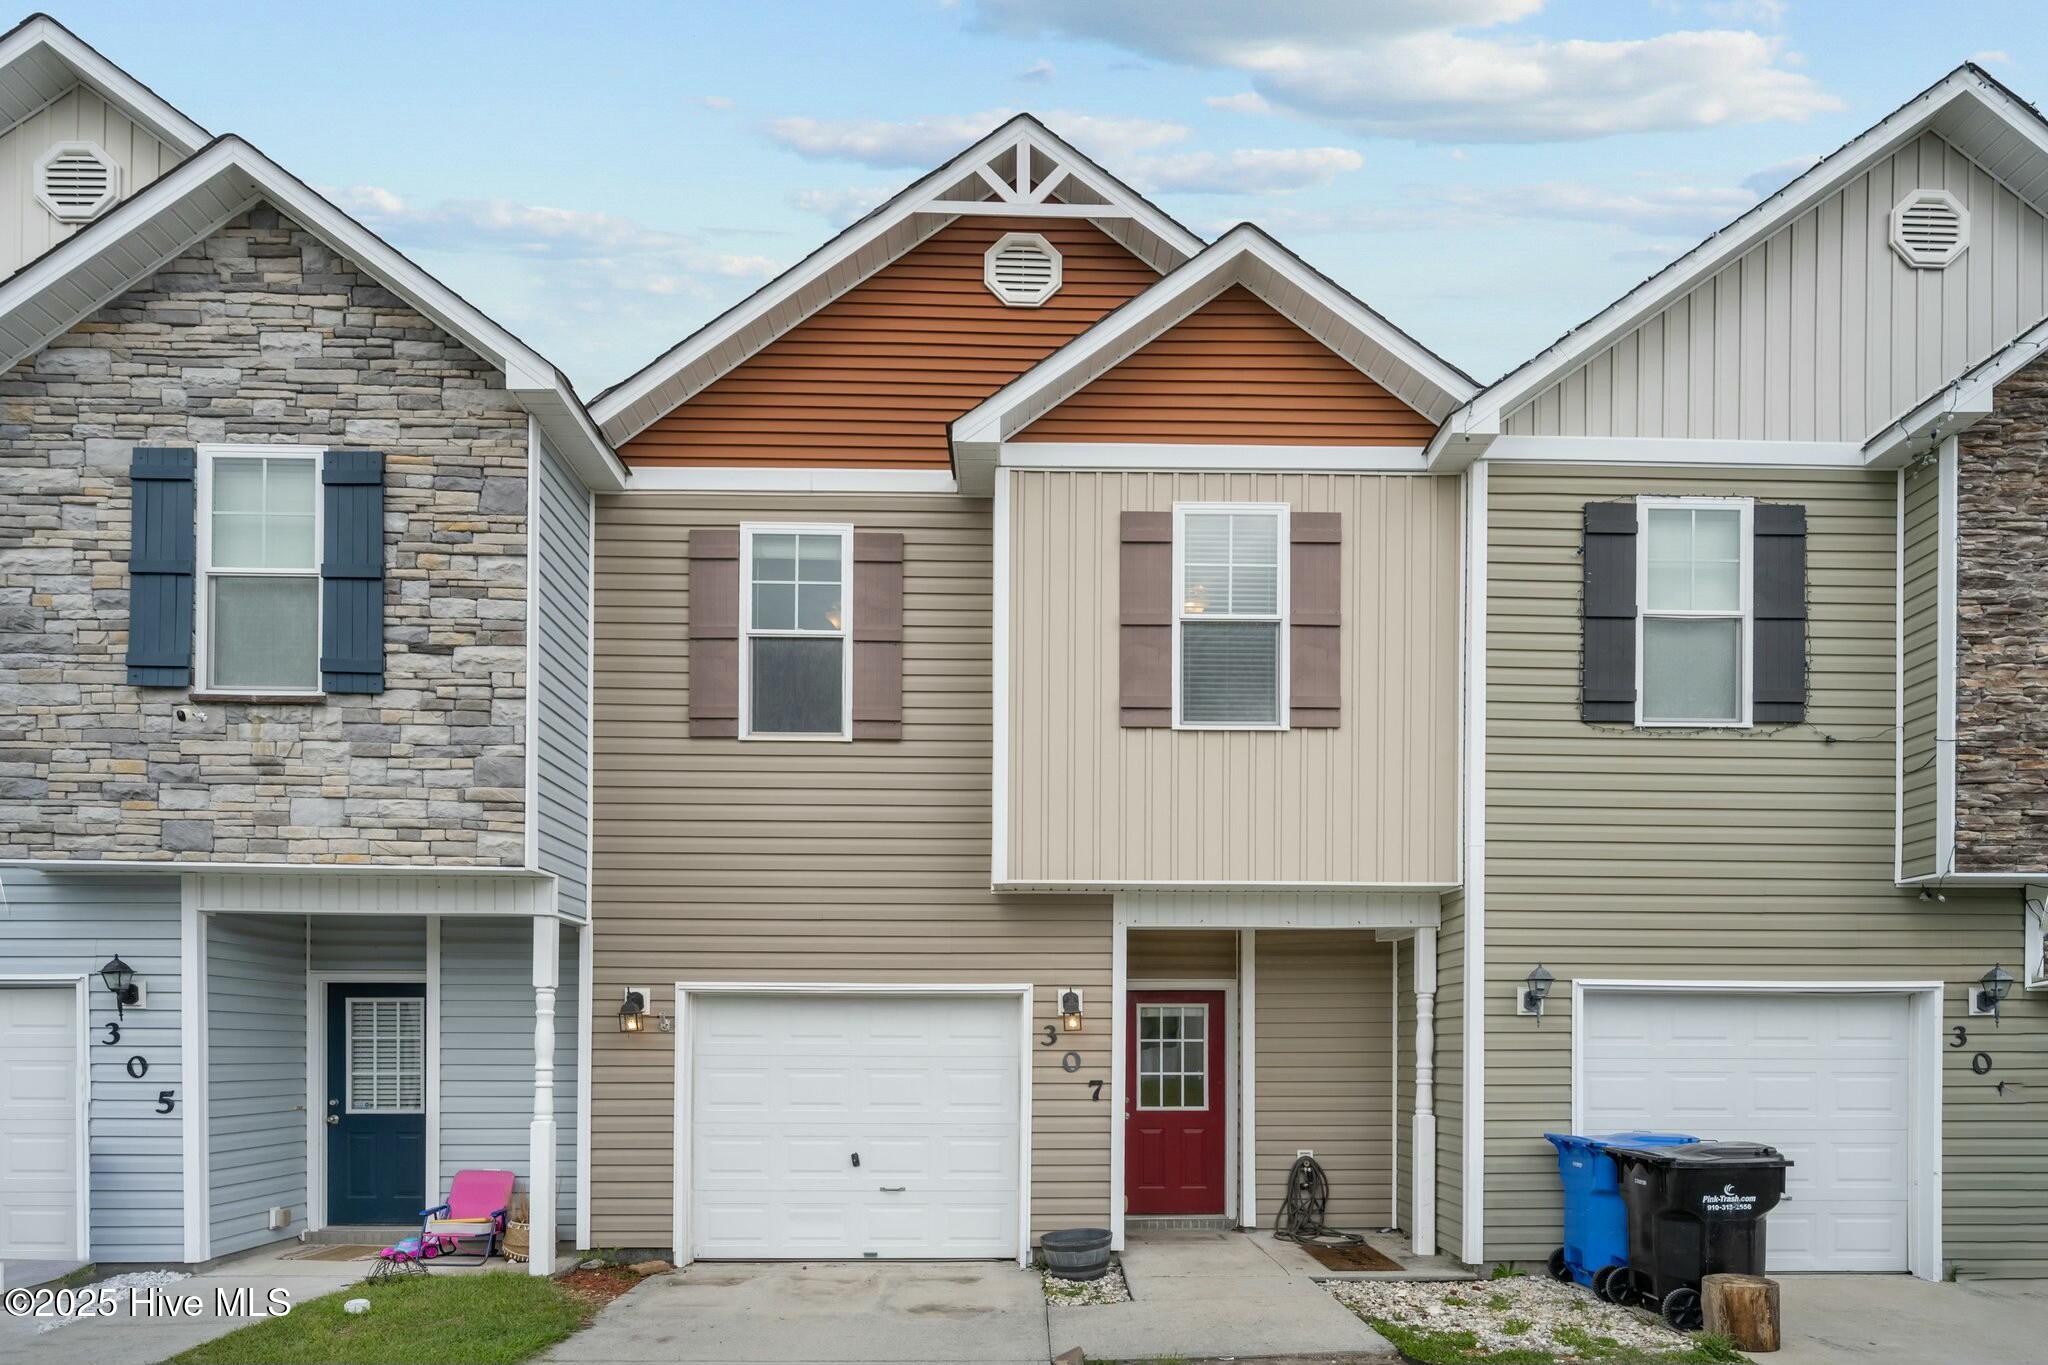
|
3
ba
|
1,511
sqft
|
built
2012
307 Cedar Island Trl, Holly Ridge, NC 28445
$-257
Cash flow
-5.1%
Cash-on-Cash Return
4.5%
Cap rate
0.6%
Rent to Value Ratio
Pending
$315,000
3
bds
|
2
ba
|
1,298
sqft
|
built
1992
4600 Weybridge Ln, Wilmington, NC 28409
$-248
Cash flow
-4.1%
Cash-on-Cash Return
4.7%
Cap rate
0.6%
Rent to Value Ratio
Active
$170,000
2
bds
|
2
ba
|
1,332
sqft
|
built
1994
113 Breezewood Dr, Greenville, NC 27858
$-63
Cash flow
-1.9%
Cash-on-Cash Return
5.2%
Cap rate
0.8%
Rent to Value Ratio
Active
$450,000
3
bds
|
3
ba
|
2,409
sqft
|
built
2008
3284 Gardenwood Dr, Leland, NC 28451
$-1,120
Cash flow
-13.0%
Cash-on-Cash Return
2.7%
Cap rate
0.6%
Rent to Value Ratio
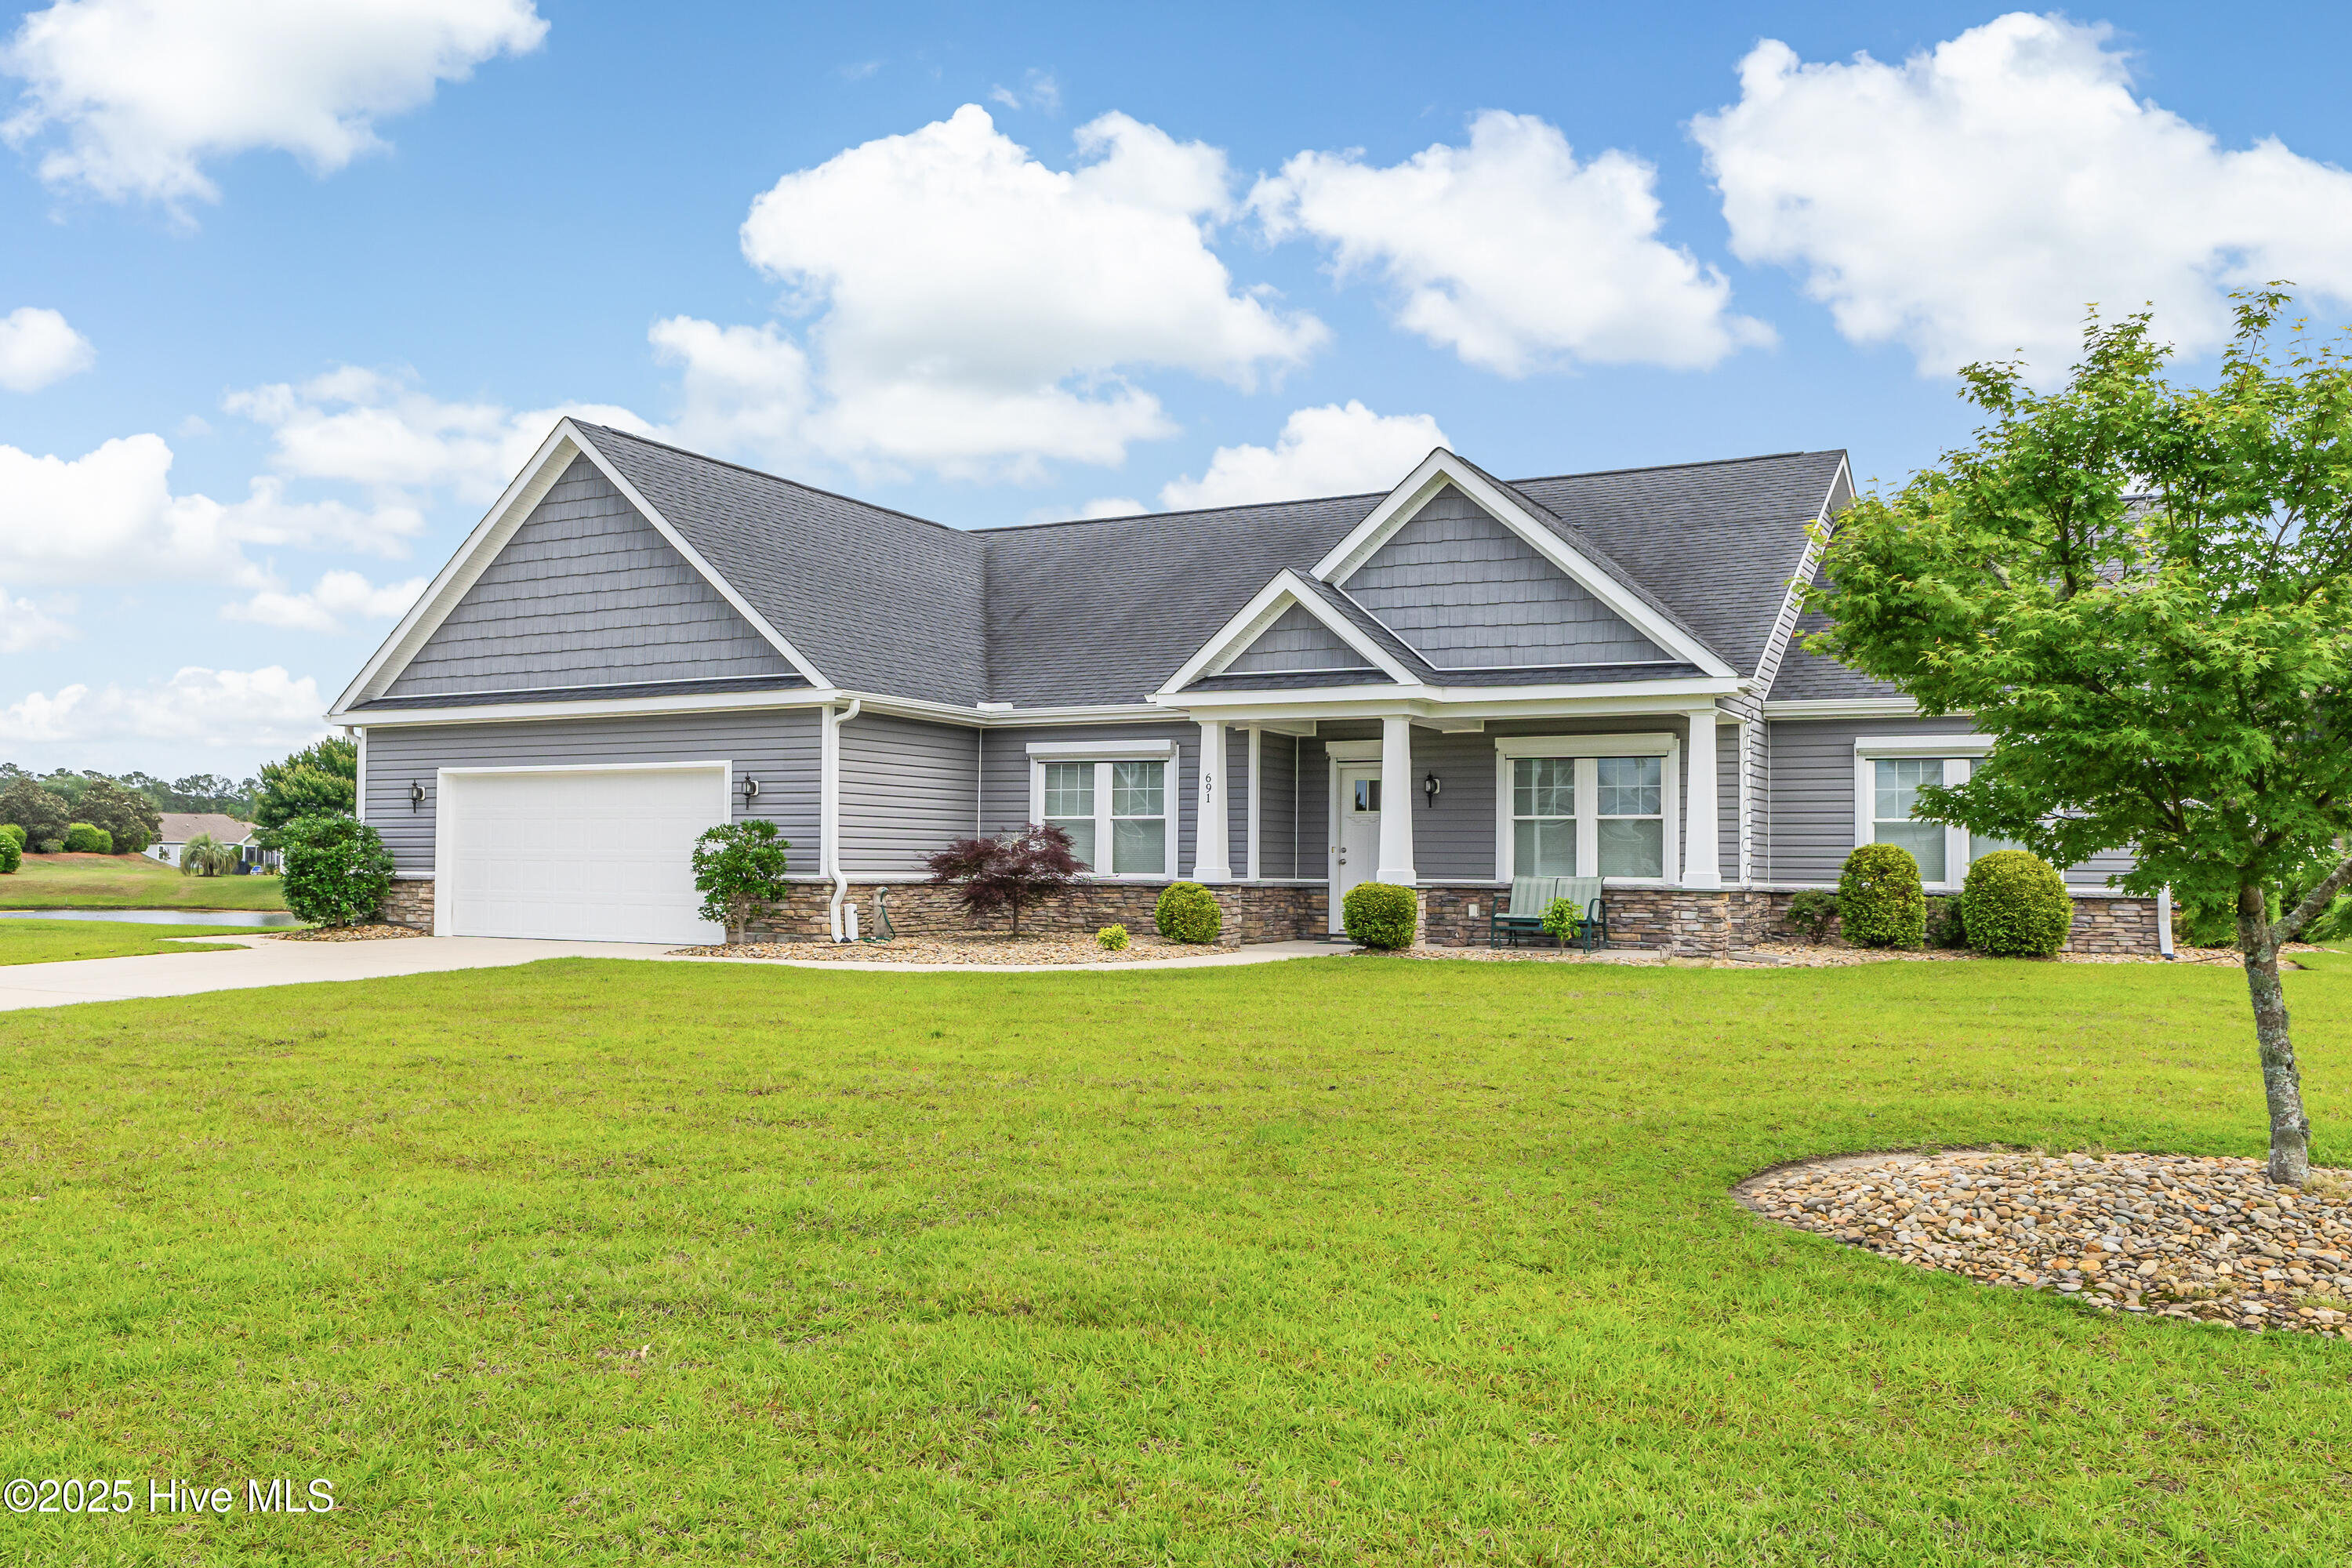
Active
$475,000
3
bds
|
2
ba
|
2,326
sqft
|
built
2017
691 Marbella Ct NW, Calabash, NC 28467
$-926
Cash flow
-10.2%
Cash-on-Cash Return
3.3%
Cap rate
0.5%
Rent to Value Ratio