Cass County Investment Properties for Sale
Browse homes for sale and investment properties in Cass County. Refine your search by price, property type, or more.
Best cash flowing properties in Cass County
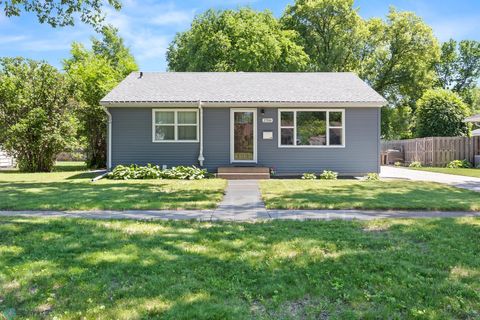
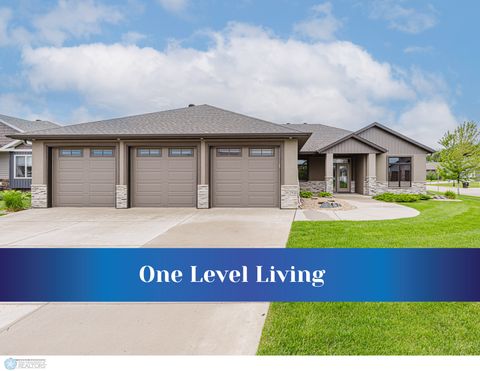
Active
$155,000
3
bds
|
2
ba
|
1,700
sqft
|
built
1893
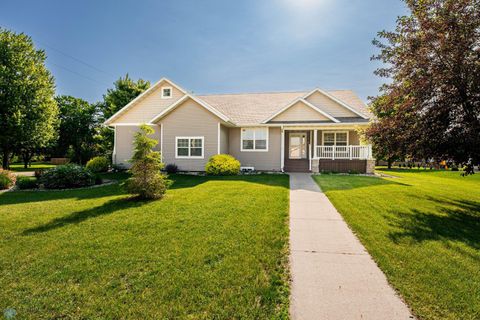
212 May Ave, Page, ND 58064
$402
Cash flow
13.5%
Cash-on-Cash Return
8.8%
Cap rate
1.2%
Rent to Value Ratio
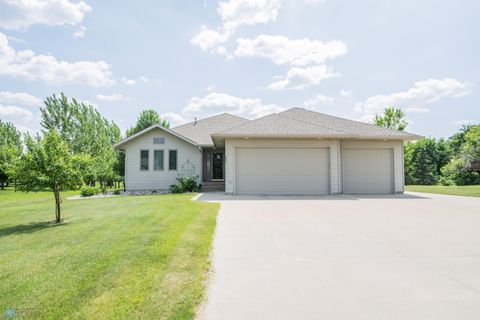
Active
$275,000
5
bds
|
3
ba
|
1,890
sqft
|
built
1957
1031 College St N, Fargo, ND 58102
$244
Cash flow
4.6%
Cash-on-Cash Return
6.7%
Cap rate
0.9%
Rent to Value Ratio
85 out of 411 properties for sale in Cass County
Limited Results Shown
Create a free account, or log in to reveal all property listings and enjoy the complete experience.
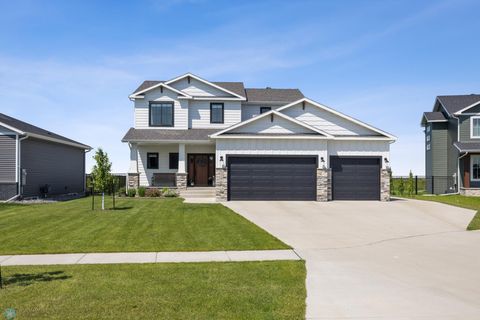
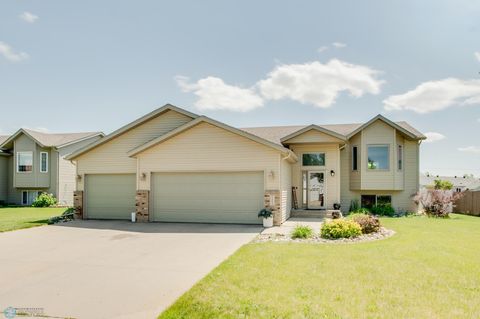
Active
$675,000
4
bds
|
4
ba
|
3,431
sqft
|
built
2016
2842 Mc Leod Dr E, West Fargo, ND 58078
$-1,766
Cash flow
-13.7%
Cash-on-Cash Return
2.5%
Cap rate
0.5%
Rent to Value Ratio
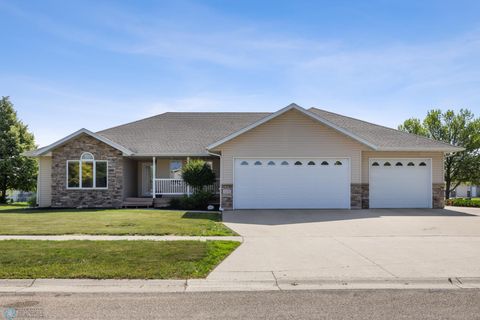
Active
$365,000
4
bds
|
3
ba
|
2,032
sqft
|
built
2007
3661 Taylor St S, Fargo, ND 58104
$-655
Cash flow
-9.4%
Cash-on-Cash Return
4.1%
Cap rate
0.7%
Rent to Value Ratio
Active
$650,000
5
bds
|
4
ba
|
3,226
sqft
|
built
2021
8871 Cottonwood Blvd, Horace, ND 58047
$-2,107
Cash flow
-16.9%
Cash-on-Cash Return
1.8%
Cap rate
0.4%
Rent to Value Ratio
Active
$380,000
4
bds
|
3
ba
|
2,182
sqft
|
built
2010
4425 Westport Pkwy, West Fargo, ND 58078
$-273
Cash flow
-3.7%
Cash-on-Cash Return
4.8%
Cap rate
0.7%
Rent to Value Ratio
Active
$440,000
4
bds
|
3
ba
|
2,980
sqft
|
built
1977
25 Birch Ln S, Fargo, ND 58103
$-440
Cash flow
-5.2%
Cash-on-Cash Return
4.5%
Cap rate
0.7%
Rent to Value Ratio
Active
$255,000
4
bds
|
1
ba
|
2,017
sqft
|
built
1983
327 6th Ave, Mapleton, ND 58059
$-339
Cash flow
-6.9%
Cash-on-Cash Return
4.6%
Cap rate
0.7%
Rent to Value Ratio
Active
$285,000
4
bds
|
2
ba
|
1,844
sqft
|
built
1955
1706 14 1/2 St S, Fargo, ND 58103
$-253
Cash flow
-4.6%
Cash-on-Cash Return
5.2%
Cap rate
0.8%
Rent to Value Ratio
Active
$390,000
4
bds
|
3
ba
|
2,366
sqft
|
built
2004
1083 Parkway Ln, West Fargo, ND 58078
$-352
Cash flow
-4.7%
Cash-on-Cash Return
4.6%
Cap rate
0.7%
Rent to Value Ratio
Active
$484,900
6
bds
|
3
ba
|
3,083
sqft
|
built
2003
1172 Morningside Ct, Casselton, ND 58012
$-971
Cash flow
-10.4%
Cash-on-Cash Return
3.3%
Cap rate
0.5%
Rent to Value Ratio
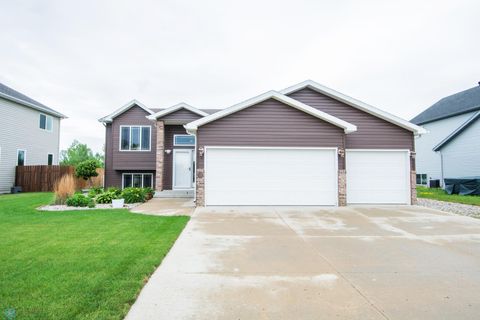
Active
$315,000
3
bds
|
2
ba
|
2,464
sqft
|
built
1907
619 University Dr S, Fargo, ND 58103
$-200
Cash flow
-3.3%
Cash-on-Cash Return
5.5%
Cap rate
0.8%
Rent to Value Ratio
Active
$245,000
4
bds
|
2
ba
|
2,112
sqft
|
built
1987
2426 34 1/2 Ave S, Fargo, ND 58104
$-304
Cash flow
-6.5%
Cash-on-Cash Return
4.8%
Cap rate
0.7%
Rent to Value Ratio
Active
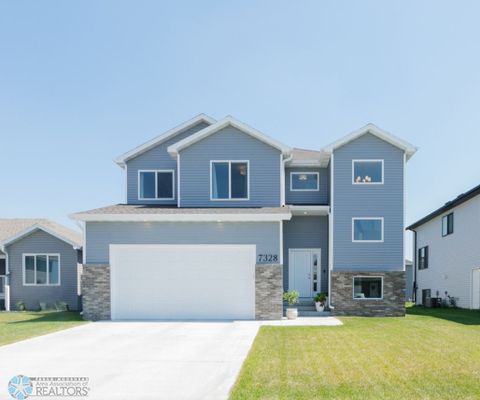
$449,900
3
bds
|
3
ba
|
1,929
sqft
|
built
2022
7328 Aquiline Dr S, Fargo, ND 58104
$-890
Cash flow
-10.3%
Cash-on-Cash Return
3.9%
Cap rate
0.7%
Rent to Value Ratio
Active
$262,000
3
bds
|
2
ba
|
1,672
sqft
|
built
2003
1030 Oak Pl, West Fargo, ND 58078
$-134
Cash flow
-2.7%
Cash-on-Cash Return
5.1%
Cap rate
0.8%
Rent to Value Ratio
Active
$550,000
4
bds
|
4
ba
|
3,031
sqft
|
built
2022
10141 Concord Dr, Horace, ND 58047
$-567
Cash flow
-5.4%
Cash-on-Cash Return
4.4%
Cap rate
0.7%
Rent to Value Ratio
Active
$675,000
4
bds
|
2
ba
|
2,011
sqft
|
built
2015
3629 Houkom Dr E, West Fargo, ND 58078
$-1,674
Cash flow
-12.9%
Cash-on-Cash Return
3.3%
Cap rate
0.5%
Rent to Value Ratio
Active
$599,000
5
bds
|
3
ba
|
3,552
sqft
|
built
2002
633 Leonards Way, Argusville, ND 58005
$-1,352
Cash flow
-11.8%
Cash-on-Cash Return
3.0%
Cap rate
0.5%
Rent to Value Ratio
Active
$779,900
4
bds
|
4
ba
|
3,750
sqft
|
built
2018
6728 Ashwood Loop, Fargo, ND 58104
$-3,318
Cash flow
-22.2%
Cash-on-Cash Return
1.2%
Cap rate
0.3%
Rent to Value Ratio
Active
$675,000
5
bds
|
4
ba
|
3,510
sqft
|
built
2018
3664 Valley View Dr S, Fargo, ND 58104
$-1,740
Cash flow
-13.4%
Cash-on-Cash Return
3.2%
Cap rate
0.6%
Rent to Value Ratio
Active
$470,000
5
bds
|
3
ba
|
3,510
sqft
|
built
2007
210 1st St, Arthur, ND 58006
$-77
Cash flow
-0.9%
Cash-on-Cash Return
5.5%
Cap rate
0.8%
Rent to Value Ratio
Active
$299,500
5
bds
|
2
ba
|
2,380
sqft
|
built
1957
1005 South Dr S, Fargo, ND 58103
$-571
Cash flow
-9.9%
Cash-on-Cash Return
4.0%
Cap rate
0.7%
Rent to Value Ratio
Active
$409,000
4
bds
|
3
ba
|
2,338
sqft
|
built
1980
3113 Bohnet Blvd N, Fargo, ND 58102
$-598
Cash flow
-7.6%
Cash-on-Cash Return
4.5%
Cap rate
0.7%
Rent to Value Ratio
Active
$389,000
4
bds
|
2
ba
|
2,000
sqft
|
built
2008
4883 Lavonne Ct S, Fargo, ND 58104
$-1,270
Cash flow
-17.0%
Cash-on-Cash Return
2.3%
Cap rate
0.5%
Rent to Value Ratio
Active
$650,000
6
bds
|
5
ba
|
4,912
sqft
|
built
1985
3127 Peterson Pkwy N, Fargo, ND 58102
$-2,083
Cash flow
-16.7%
Cash-on-Cash Return
2.4%
Cap rate
0.4%
Rent to Value Ratio

Active
$525,000
4
bds
|
4
ba
|
2,674
sqft
|
built
2021
1326 Commander Dr W, West Fargo, ND 58078
$-1,525
Cash flow
-15.2%
Cash-on-Cash Return
2.8%
Cap rate
0.5%
Rent to Value Ratio

Active
$455,000
3
bds
|
3
ba
|
1,920
sqft
|
built
2021
6654 Toronto Dr S, Fargo, ND 58104
$-929
Cash flow
-10.7%
Cash-on-Cash Return
3.8%
Cap rate
0.7%
Rent to Value Ratio

Active
$445,000
5
bds
|
3
ba
|
2,800
sqft
|
built
2018
7339 21st St S, Fargo, ND 58104
$-1,496
Cash flow
-17.5%
Cash-on-Cash Return
2.2%
Cap rate
0.5%
Rent to Value Ratio

Active
$399,900
4
bds
|
3
ba
|
2,368
sqft
|
built
2002
810 Homestead Ct, West Fargo, ND 58078
$-692
Cash flow
-9.0%
Cash-on-Cash Return
4.2%
Cap rate
0.7%
Rent to Value Ratio

Active
$739,900
4
bds
|
3
ba
|
3,599
sqft
|
built
2019
2781 Golden Ln S, Fargo, ND 58104
$-2,119
Cash flow
-14.9%
Cash-on-Cash Return
2.8%
Cap rate
0.5%
Rent to Value Ratio

Active
$675,000
7
bds
|
4
ba
|
4,711
sqft
|
built
2000
4408 Riverwood Dr N, Fargo, ND 58102
$-2,282
Cash flow
-17.6%
Cash-on-Cash Return
2.2%
Cap rate
0.4%
Rent to Value Ratio

Active
$998,000
5
bds
|
3
ba
|
4,270
sqft
|
built
2022
7886 Firefly Ln, Horace, ND 58047
$-4,521
Cash flow
-23.6%
Cash-on-Cash Return
0.8%
Cap rate
0.2%
Rent to Value Ratio

Active
$620,000
2
bds
|
2
ba
|
1,639
sqft
|
built
2021
842 Rania Way W, West Fargo, ND 58078
$-2,096
Cash flow
-17.6%
Cash-on-Cash Return
2.2%
Cap rate
0.4%
Rent to Value Ratio

Active
$529,000
5
bds
|
3
ba
|
3,471
sqft
|
built
2022
7214 Eagle Pointe Dr S, Fargo, ND 58104
$-1,368
Cash flow
-13.5%
Cash-on-Cash Return
3.2%
Cap rate
0.7%
Rent to Value Ratio

Active
$495,000
5
bds
|
3
ba
|
2,844
sqft
|
built
1989
2031 Rose Creek Dr S, Fargo, ND 58104
$-1,323
Cash flow
-13.9%
Cash-on-Cash Return
3.1%
Cap rate
0.5%
Rent to Value Ratio

Active
$289,900
3
bds
|
2
ba
|
1,790
sqft
|
built
2018
2128 Admiral Dr W, West Fargo, ND 58078
$-290
Cash flow
-5.2%
Cash-on-Cash Return
5.1%
Cap rate
0.9%
Rent to Value Ratio
Active
$80,000
3
bds
|
2
ba
|
0
sqft
|
built
1984
4732 San Juan Dr S, Fargo, ND 58103
$-115
Cash flow
-7.5%
Cash-on-Cash Return
4.5%
Cap rate
1.8%
Rent to Value Ratio

Active
$779,000
6
bds
|
4
ba
|
4,286
sqft
|
built
2011
3018 4th St NW, West Fargo, ND 58078
$-2,530
Cash flow
-16.9%
Cash-on-Cash Return
2.4%
Cap rate
0.4%
Rent to Value Ratio

Active
$745,000
5
bds
|
3
ba
|
3,655
sqft
|
built
2016
2800 Mc Leod Dr E, West Fargo, ND 58078
$-1,579
Cash flow
-11.1%
Cash-on-Cash Return
3.7%
Cap rate
0.7%
Rent to Value Ratio
Active
$614,900
5
bds
|
3
ba
|
3,694
sqft
|
built
2021
140 Annies Way, Mapleton, ND 58059
$-1,462
Cash flow
-12.4%
Cash-on-Cash Return
3.4%
Cap rate
0.6%
Rent to Value Ratio