North Dakota Investment Properties for Sale
Browse homes for sale and investment properties in North Dakota. Refine your search by price, property type, or more.
Best cash flowing properties in North Dakota

Active
$135,500
2
bds
|
2
ba
|
0
sqft
|
built
1977
243 12 1/2 Ave E, West Fargo, ND 58078
$178
Cash flow
6.9%
Cash-on-Cash Return
7.3%
Cap rate
1.2%
Rent to Value Ratio

Active
$225,000
2
bds
|
1
ba
|
1,161
sqft
|
built
1919
231 3rd Ave S, Casselton, ND 58012
$102
Cash flow
2.4%
Cash-on-Cash Return
6.2%
Cap rate
0.9%
Rent to Value Ratio
177 out of 859 properties for sale in North Dakota
Limited Results Shown
Create a free account, or log in to reveal all property listings and enjoy the complete experience.
Active
$220,000
1
bds
|
2
ba
|
1,000
sqft
|
built
1978
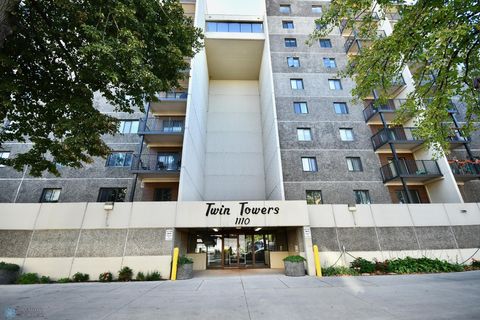
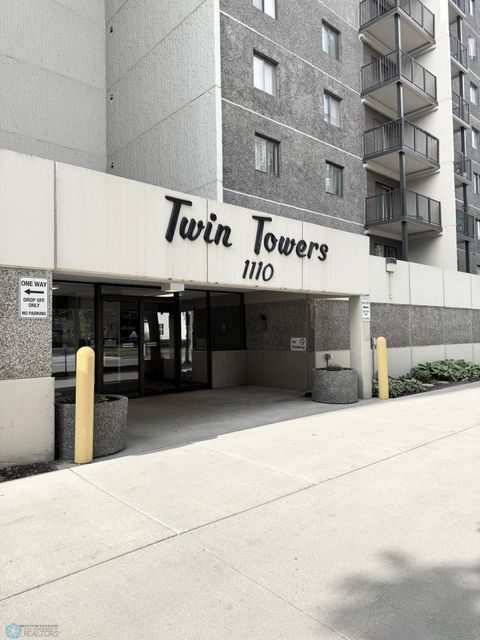
1110 3rd Ave N, Fargo, ND 58102
$-167
Cash flow
-4.0%
Cash-on-Cash Return
4.8%
Cap rate
0.8%
Rent to Value Ratio

Active
$125,000
2
bds
|
1
ba
|
882
sqft
|
built
1976
2417 Demores Dr S, Fargo, ND 58103
$-40
Cash flow
-1.7%
Cash-on-Cash Return
5.3%
Cap rate
1.1%
Rent to Value Ratio

Active
$649,900
5
bds
|
4
ba
|
3,762
sqft
|
built
2014
5480 Tanner Ave S, Fargo, ND 58104
$-1,522
Cash flow
-12.2%
Cash-on-Cash Return
2.9%
Cap rate
0.6%
Rent to Value Ratio

Pending
$265,000
3
bds
|
2
ba
|
1,870
sqft
|
built
2005
1150 38 1/2 Ave W, West Fargo, ND 58078
$-9
Cash flow
-0.2%
Cash-on-Cash Return
5.6%
Cap rate
0.8%
Rent to Value Ratio

Active
$525,000
4
bds
|
4
ba
|
2,674
sqft
|
built
2021
1326 Commander Dr W, West Fargo, ND 58078
$-1,268
Cash flow
-12.6%
Cash-on-Cash Return
2.8%
Cap rate
0.5%
Rent to Value Ratio

Active
$455,000
3
bds
|
3
ba
|
1,920
sqft
|
built
2021
6654 Toronto Dr S, Fargo, ND 58104
$-707
Cash flow
-8.1%
Cash-on-Cash Return
3.8%
Cap rate
0.7%
Rent to Value Ratio

Active
$249,900
3
bds
|
2
ba
|
1,720
sqft
|
built
2001
2383 58th Ave S, Fargo, ND 58104
$-342
Cash flow
-7.1%
Cash-on-Cash Return
4.0%
Cap rate
0.7%
Rent to Value Ratio

Active
$445,000
5
bds
|
3
ba
|
2,800
sqft
|
built
2018
7339 21st St S, Fargo, ND 58104
$-1,279
Cash flow
-15.0%
Cash-on-Cash Return
2.2%
Cap rate
0.5%
Rent to Value Ratio

Pending
$300,000
3
bds
|
3
ba
|
2,538
sqft
|
built
1973
225 Morrison St, West Fargo, ND 58078
$-485
Cash flow
-8.4%
Cash-on-Cash Return
3.7%
Cap rate
0.6%
Rent to Value Ratio

Active
$399,900
4
bds
|
3
ba
|
2,368
sqft
|
built
2002
810 Homestead Ct, West Fargo, ND 58078
$-496
Cash flow
-6.5%
Cash-on-Cash Return
4.2%
Cap rate
0.7%
Rent to Value Ratio

Active
$399,900
2
bds
|
1
ba
|
1,175
sqft
|
built
1913
319 Broadway N, Fargo, ND 58102
$-721
Cash flow
-9.4%
Cash-on-Cash Return
3.5%
Cap rate
0.6%
Rent to Value Ratio

Active
$243,500
2
bds
|
2
ba
|
968
sqft
|
built
1978
2422 Demores Dr S, Fargo, ND 58103
$-218
Cash flow
-4.7%
Cash-on-Cash Return
4.6%
Cap rate
0.7%
Rent to Value Ratio

Active
$739,900
4
bds
|
3
ba
|
3,599
sqft
|
built
2019
2781 Golden Ln S, Fargo, ND 58104
$-1,757
Cash flow
-12.4%
Cash-on-Cash Return
2.8%
Cap rate
0.5%
Rent to Value Ratio
Active
$135,500
2
bds
|
2
ba
|
0
sqft
|
built
1977
243 12 1/2 Ave E, West Fargo, ND 58078
$178
Cash flow
6.9%
Cash-on-Cash Return
7.3%
Cap rate
1.2%
Rent to Value Ratio

Active
$219,000
1
bds
|
1
ba
|
857
sqft
|
built
1913
319 Broadway N, Fargo, ND 58102
$-313
Cash flow
-7.5%
Cash-on-Cash Return
4.0%
Cap rate
0.8%
Rent to Value Ratio

Active
$459,900
4
bds
|
3
ba
|
3,651
sqft
|
built
2002
1395 Highpointe Dr N, Fargo, ND 58102
$-1,140
Cash flow
-12.9%
Cash-on-Cash Return
2.7%
Cap rate
0.6%
Rent to Value Ratio
Active
$164,900
2
bds
|
2
ba
|
1,000
sqft
|
built
1978
1110 3rd Ave N, Fargo, ND 58102
$-45
Cash flow
-1.4%
Cash-on-Cash Return
5.3%
Cap rate
0.8%
Rent to Value Ratio

Active
$675,000
7
bds
|
4
ba
|
4,711
sqft
|
built
2000
4408 Riverwood Dr N, Fargo, ND 58102
$-1,952
Cash flow
-15.1%
Cash-on-Cash Return
2.2%
Cap rate
0.4%
Rent to Value Ratio

Active
$238,000
3
bds
|
2
ba
|
1,746
sqft
|
built
1985
622 Willow Ct, Horace, ND 58047
$-246
Cash flow
-5.4%
Cash-on-Cash Return
4.4%
Cap rate
0.7%
Rent to Value Ratio

Active
$998,000
5
bds
|
3
ba
|
4,270
sqft
|
built
2022
7886 Firefly Ln, Horace, ND 58047
$-4,034
Cash flow
-21.1%
Cash-on-Cash Return
0.8%
Cap rate
0.2%
Rent to Value Ratio

Pending
$265,000
5
bds
|
2
ba
|
2,080
sqft
|
built
1973
2910 Madison Ave N, Fargo, ND 58102
$-258
Cash flow
-5.1%
Cash-on-Cash Return
4.5%
Cap rate
0.7%
Rent to Value Ratio

Active
$285,000
3
bds
|
3
ba
|
1,778
sqft
|
built
2009
4286 Auburn Ave, Fargo, ND 58104
$-109
Cash flow
-2.0%
Cash-on-Cash Return
5.2%
Cap rate
0.8%
Rent to Value Ratio

Active
$409,000
3
bds
|
3
ba
|
1,975
sqft
|
built
2019
5726 Deb Dr W, West Fargo, ND 58078
$-332
Cash flow
-4.2%
Cash-on-Cash Return
4.7%
Cap rate
0.7%
Rent to Value Ratio

Active
$620,000
2
bds
|
2
ba
|
1,639
sqft
|
built
2021
842 Rania Way W, West Fargo, ND 58078
$-1,793
Cash flow
-15.1%
Cash-on-Cash Return
2.2%
Cap rate
0.4%
Rent to Value Ratio

Active
$355,000
2
bds
|
3
ba
|
1,631
sqft
|
built
1996
1426 Heatherwood Ct, West Fargo, ND 58078
$-794
Cash flow
-11.7%
Cash-on-Cash Return
3.0%
Cap rate
0.6%
Rent to Value Ratio

Pending
$250,000
2
bds
|
2
ba
|
1,326
sqft
|
built
2005
816 3rd St N, Fargo, ND 58102
$-394
Cash flow
-8.2%
Cash-on-Cash Return
3.8%
Cap rate
0.8%
Rent to Value Ratio

Pending
$295,000
3
bds
|
2
ba
|
2,096
sqft
|
built
1998
2834 Wheatland Dr S, Fargo, ND 58103
$-433
Cash flow
-7.7%
Cash-on-Cash Return
3.9%
Cap rate
0.6%
Rent to Value Ratio

Active
$375,000
3
bds
|
3
ba
|
1,954
sqft
|
built
2010
4110 Clubhouse Dr S, Fargo, ND 58104
$-404
Cash flow
-5.6%
Cash-on-Cash Return
4.4%
Cap rate
0.7%
Rent to Value Ratio

Active
$529,000
5
bds
|
3
ba
|
3,471
sqft
|
built
2022
7214 Eagle Pointe Dr S, Fargo, ND 58104
$-1,109
Cash flow
-10.9%
Cash-on-Cash Return
3.2%
Cap rate
0.7%
Rent to Value Ratio

Active
$89,900
2
bds
|
1
ba
|
768
sqft
|
built
1966
702 Oak St N, Fargo, ND 58102
$-67
Cash flow
-3.9%
Cash-on-Cash Return
4.8%
Cap rate
1.1%
Rent to Value Ratio

Active
$495,000
5
bds
|
3
ba
|
2,844
sqft
|
built
1989
2031 Rose Creek Dr S, Fargo, ND 58104
$-1,081
Cash flow
-11.4%
Cash-on-Cash Return
3.1%
Cap rate
0.5%
Rent to Value Ratio

Active
$289,900
3
bds
|
2
ba
|
1,790
sqft
|
built
2018
2128 Admiral Dr W, West Fargo, ND 58078
$-149
Cash flow
-2.7%
Cash-on-Cash Return
5.1%
Cap rate
0.9%
Rent to Value Ratio
Active
$225,000
2
bds
|
1
ba
|
1,161
sqft
|
built
1919
231 3rd Ave S, Casselton, ND 58012
$102
Cash flow
2.4%
Cash-on-Cash Return
6.2%
Cap rate
0.9%
Rent to Value Ratio

Active
$267,500
2
bds
|
2
ba
|
2,024
sqft
|
built
1979
3359 16th Ave S, Fargo, ND 58103
$-385
Cash flow
-7.5%
Cash-on-Cash Return
4.0%
Cap rate
0.7%
Rent to Value Ratio

Pending
$349,900
4
bds
|
3
ba
|
2,242
sqft
|
built
1977
1813 Prairie Ln S, Fargo, ND 58103
$-572
Cash flow
-8.5%
Cash-on-Cash Return
3.7%
Cap rate
0.6%
Rent to Value Ratio

Active
$989,900
5
bds
|
4
ba
|
5,970
sqft
|
built
2019
4375 Lee Ln S, Fargo, ND 58104
$-2,445
Cash flow
-12.9%
Cash-on-Cash Return
2.7%
Cap rate
0.5%
Rent to Value Ratio

Active
$77,000
1
bds
|
1
ba
|
807
sqft
|
built
1963
813 6th Ave N, Fargo, ND 58102
$74
Cash flow
5.0%
Cash-on-Cash Return
6.8%
Cap rate
1.3%
Rent to Value Ratio
Active
$80,000
3
bds
|
2
ba
|
0
sqft
|
built
1984
4732 San Juan Dr S, Fargo, ND 58103
$-76
Cash flow
-5.0%
Cash-on-Cash Return
4.5%
Cap rate
1.8%
Rent to Value Ratio

Active
$499,900
5
bds
|
3
ba
|
2,952
sqft
|
built
1994
3217 35 1/2 Court Ave S, Fargo, ND 58104
$-1,076
Cash flow
-11.2%
Cash-on-Cash Return
3.1%
Cap rate
0.5%
Rent to Value Ratio

Active
$779,000
6
bds
|
4
ba
|
4,286
sqft
|
built
2011
3018 4th St NW, West Fargo, ND 58078
$-2,149
Cash flow
-14.4%
Cash-on-Cash Return
2.4%
Cap rate
0.4%
Rent to Value Ratio