New Port Richey, FL Investment Properties for Sale
Browse homes for sale and investment properties in New Port Richey, FL. Refine your search by price, property type, or more.
Best cash flowing properties in New Port Richey, FL
Active
$119,000
2
bds
|
2
ba
|
1,088
sqft
|
built
1974
4557 Garnet Dr, New Port Richey, FL 34652
$367
Cash flow
16.1%
Cash-on-Cash Return
10.0%
Cap rate
1.4%
Rent to Value Ratio
Active
$120,000
2
bds
|
1
ba
|
924
sqft
|
built
1958
7339 Royal Palm Dr, New Port Richey, FL 34652
$365
Cash flow
15.9%
Cash-on-Cash Return
9.9%
Cap rate
1.4%
Rent to Value Ratio
433 out of 435 properties for sale in New Port Richey, FL
Limited Results Shown
Create a free account, or log in to reveal all property listings and enjoy the complete experience.
Active
$575,000
6
bds
|
6
ba
|
3,392
sqft
|
built
1972
6621 Congress St, New Port Richey, FL 34653
$-2,606
Cash flow
-23.6%
Cash-on-Cash Return
0.8%
Cap rate
0.2%
Rent to Value Ratio
Active
$424,900
3
bds
|
2
ba
|
2,022
sqft
|
built
1988
6056 Fall River Dr, New Port Richey, FL 34655
$-648
Cash flow
-8.0%
Cash-on-Cash Return
4.5%
Cap rate
0.6%
Rent to Value Ratio
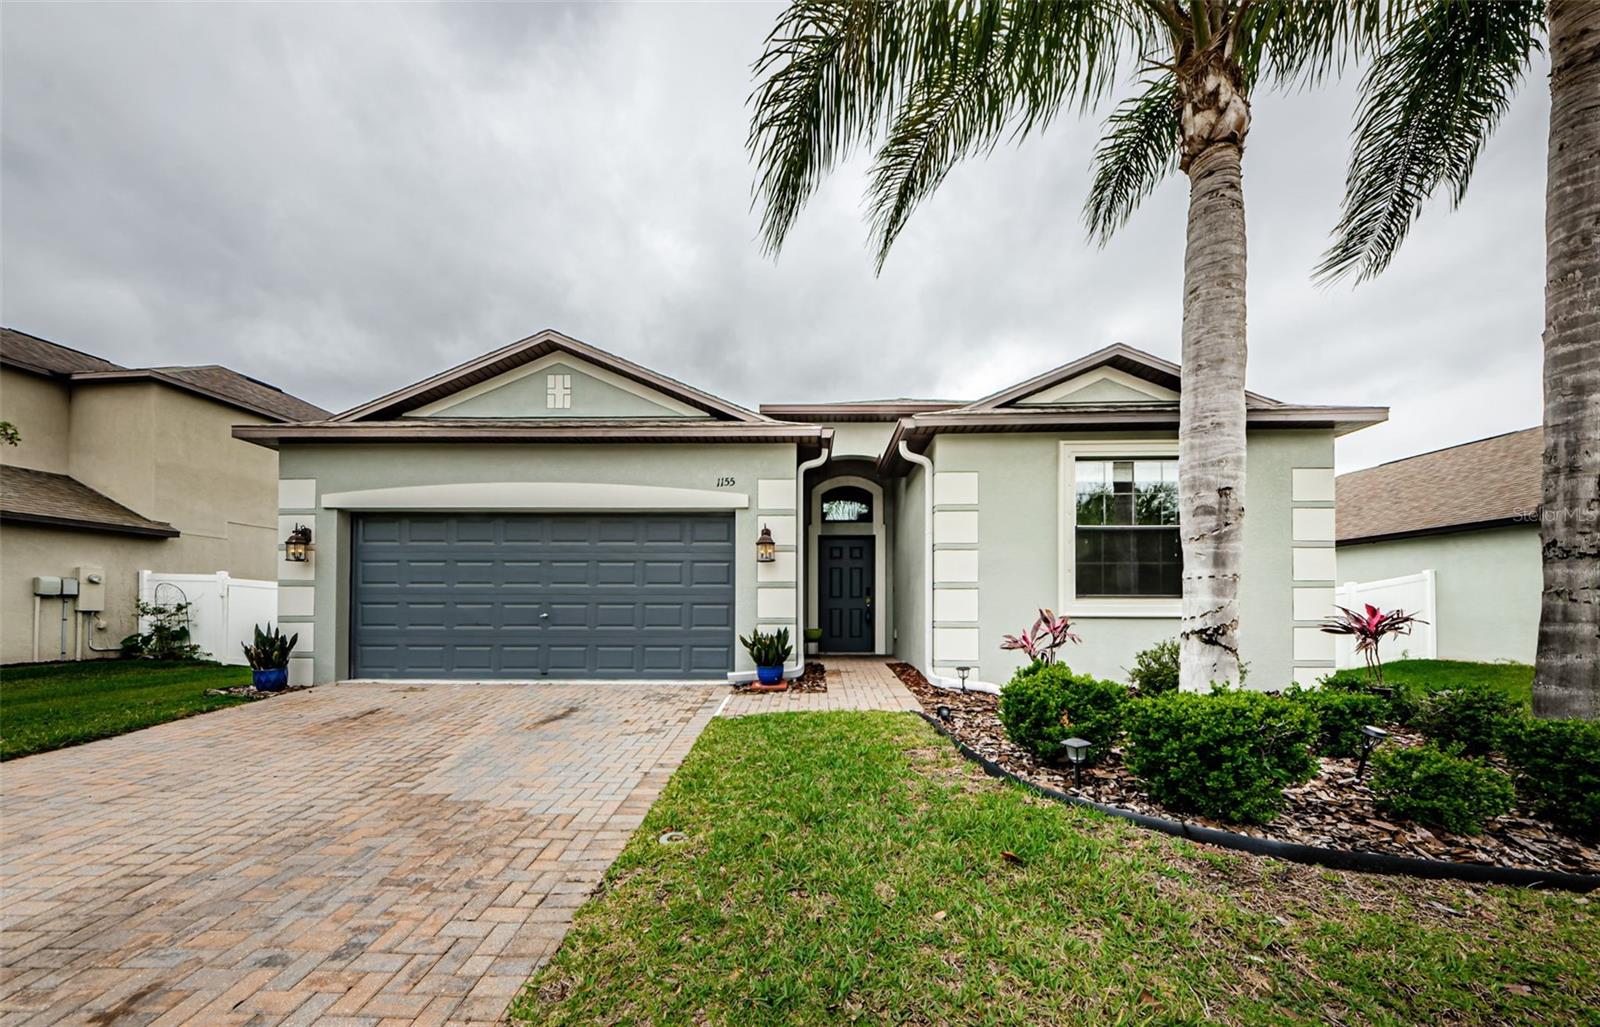
Pending
$459,000
4
bds
|
3
ba
|
2,027
sqft
|
built
2015
1155 Lawnview Ter, New Port Richey, FL 34655
$-696
Cash flow
-7.9%
Cash-on-Cash Return
4.5%
Cap rate
0.7%
Rent to Value Ratio
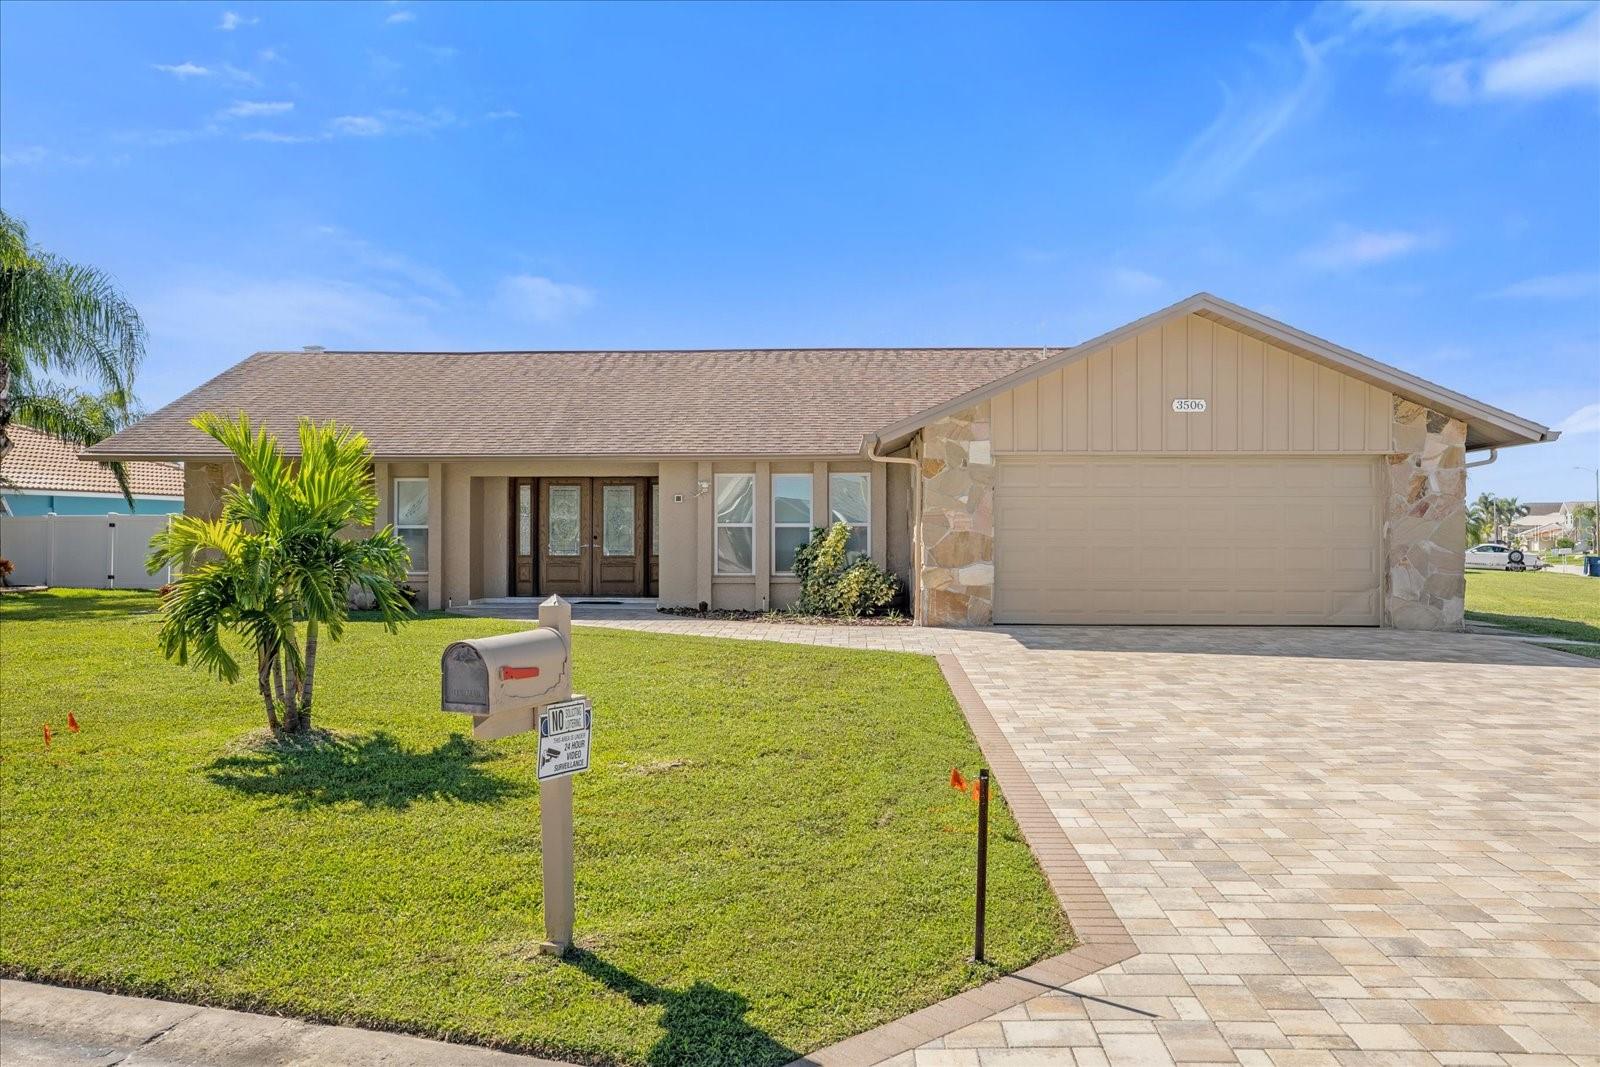
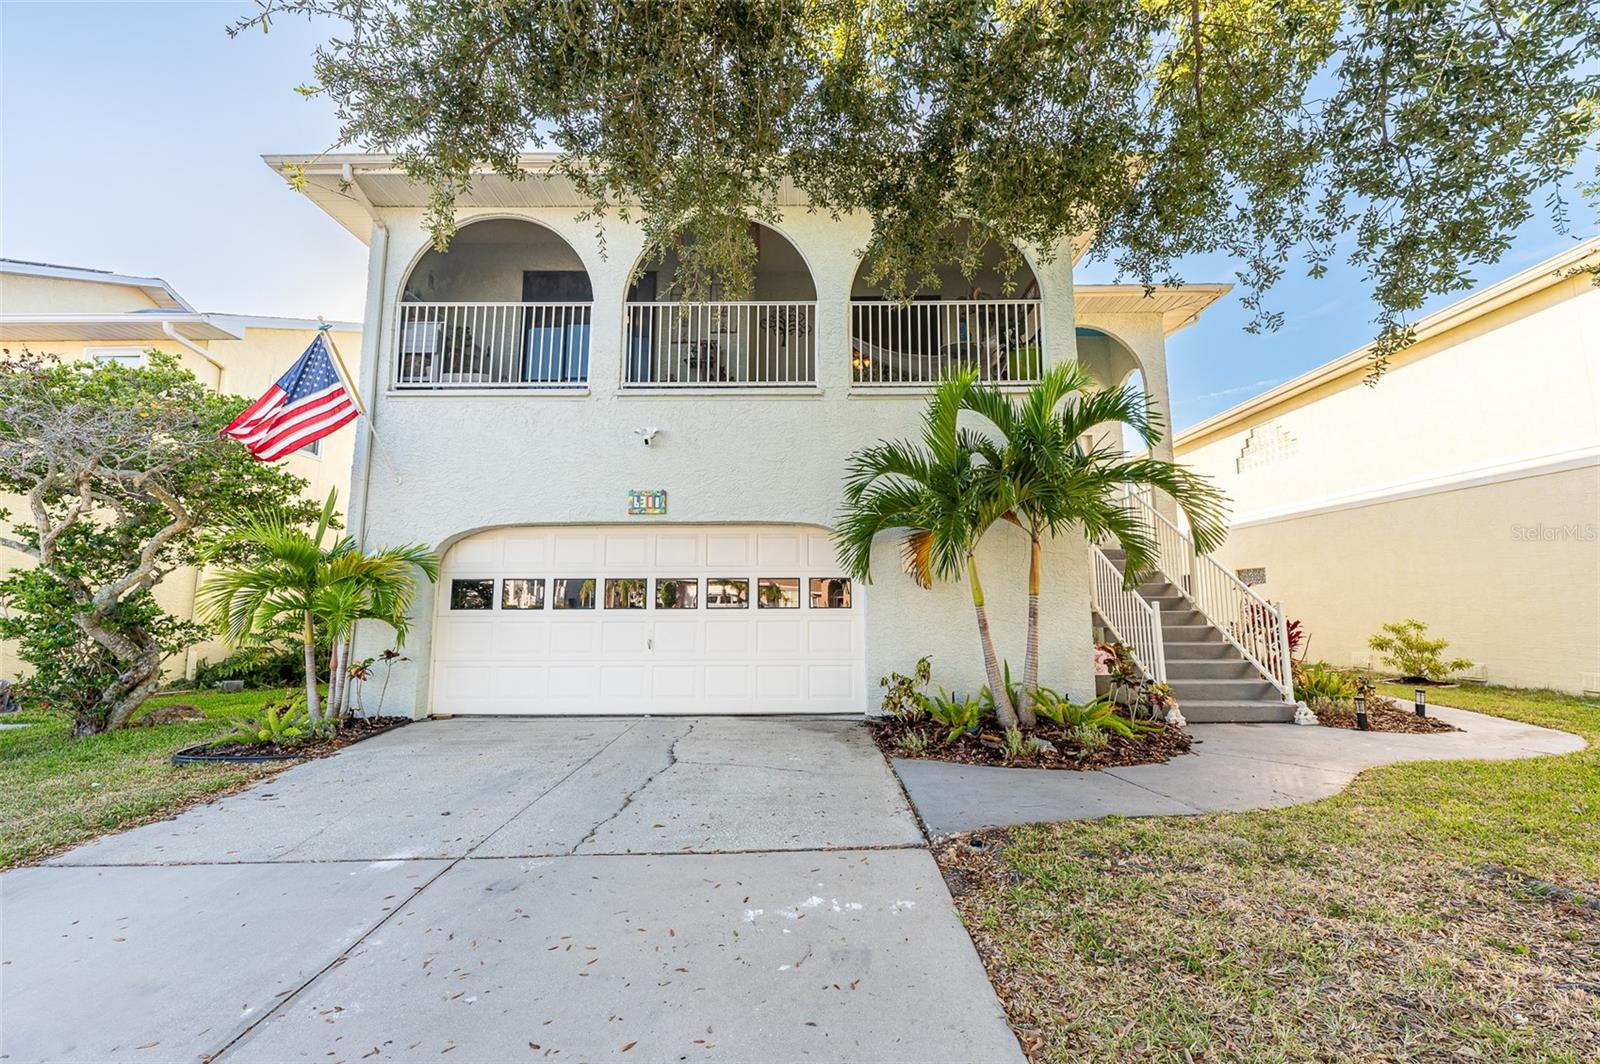
Active
$1,085,000
4
bds
|
3
ba
|
2,212
sqft
|
built
1977
3506 Seaway Dr, New Port Richey, FL 34652
$-2,500
Cash flow
-12.0%
Cash-on-Cash Return
3.5%
Cap rate
0.5%
Rent to Value Ratio
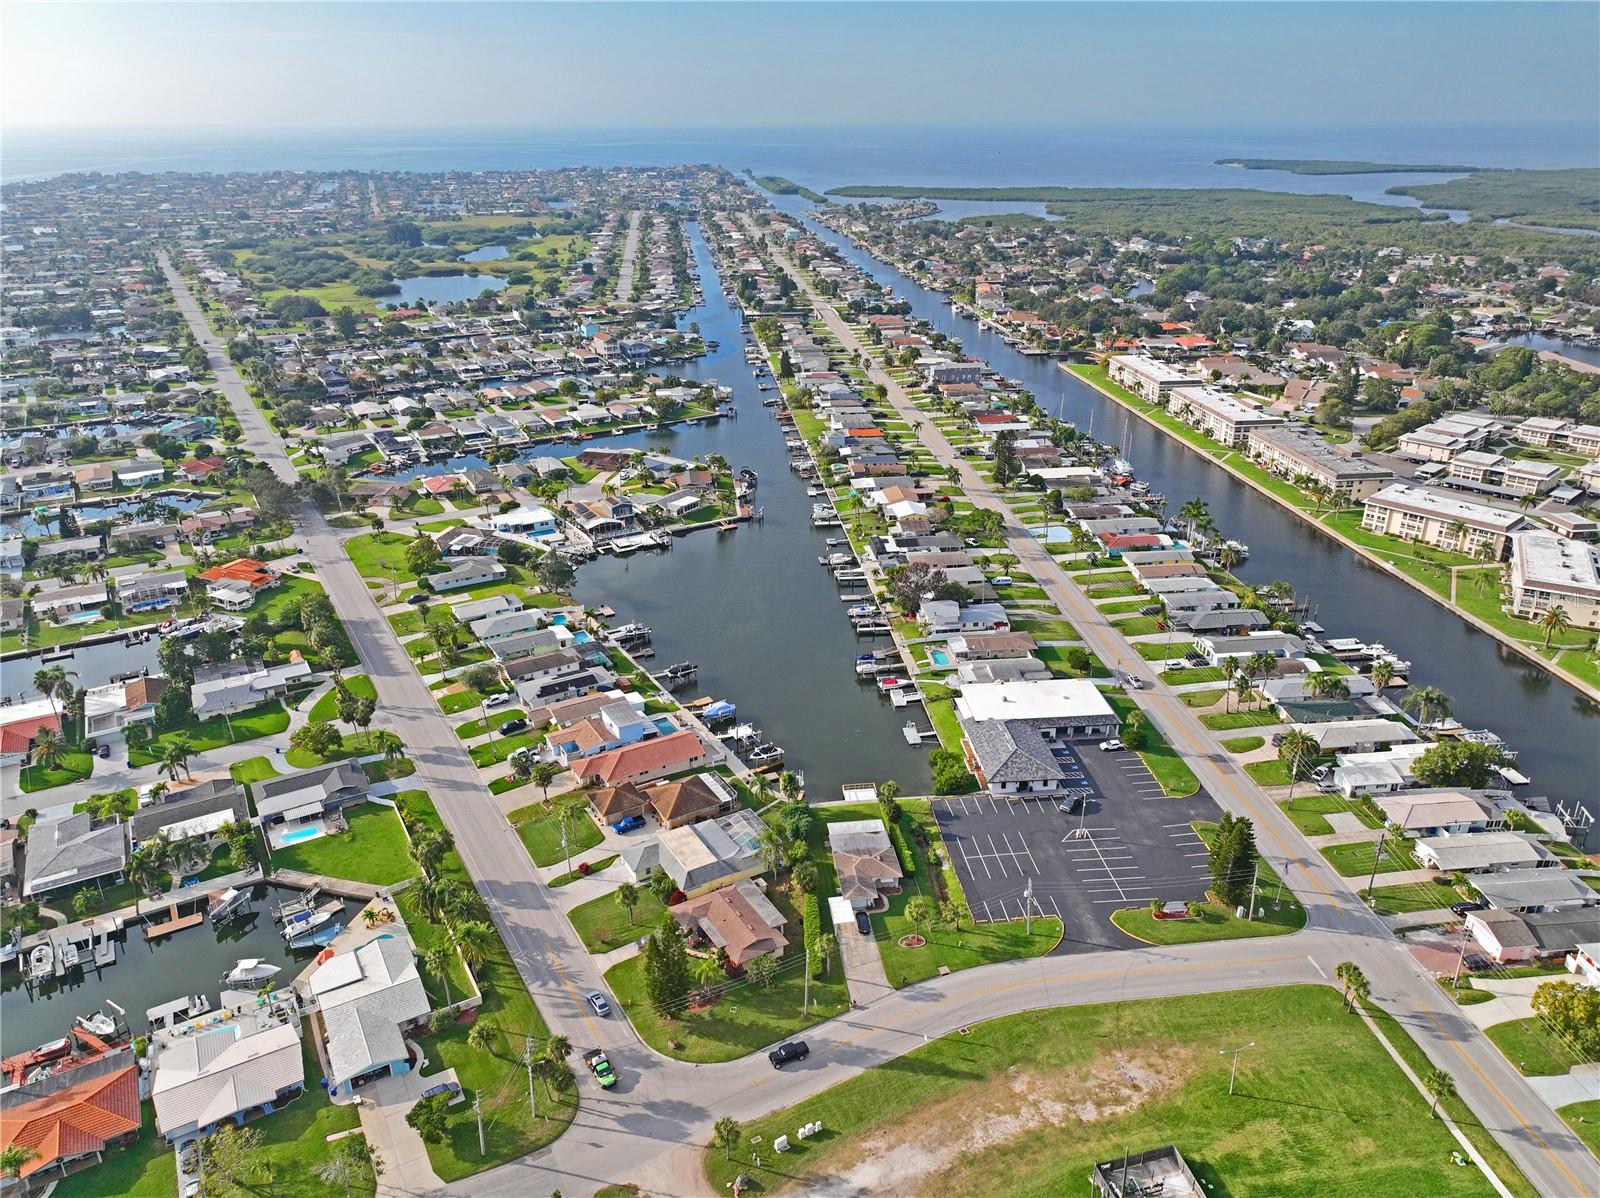
Active
$538,500
2
bds
|
2
ba
|
1,055
sqft
|
built
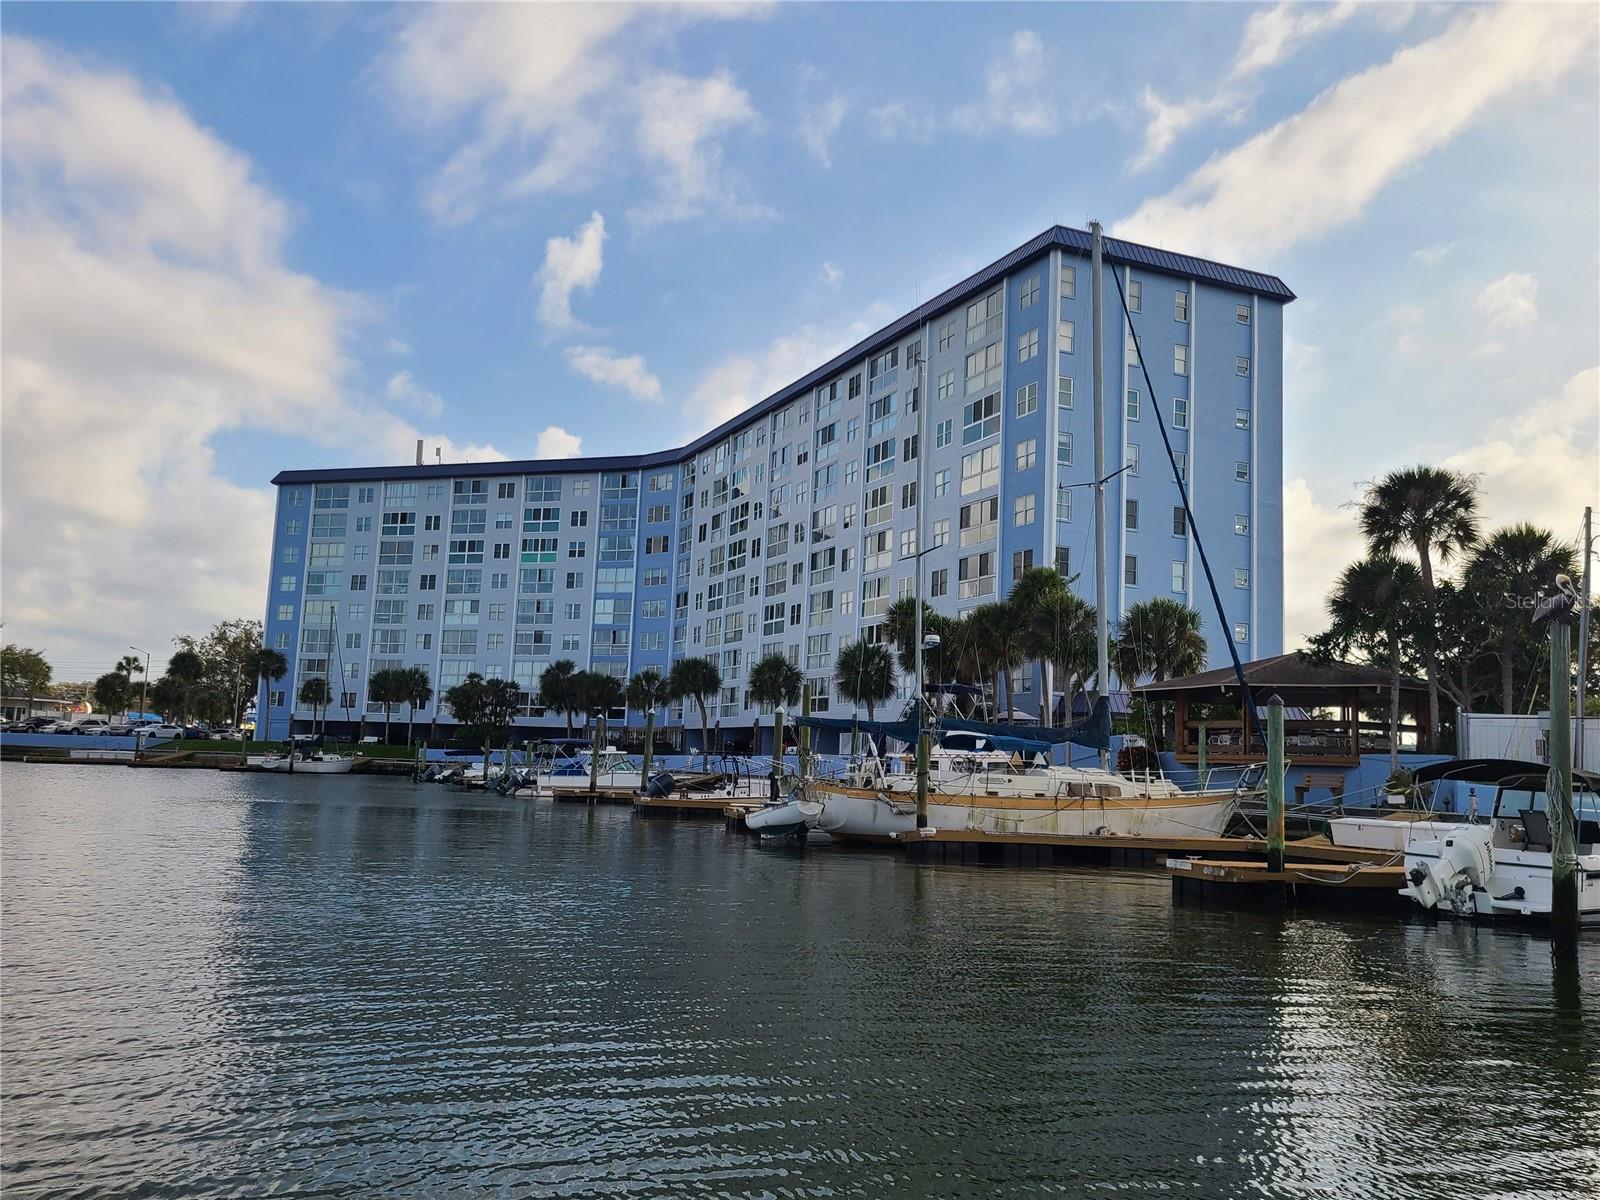
1961
4400 Floramar Ter, New Port Richey, FL 34652
$-1,506
Cash flow
-14.6%
Cash-on-Cash Return
2.9%
Cap rate
0.5%
Rent to Value Ratio
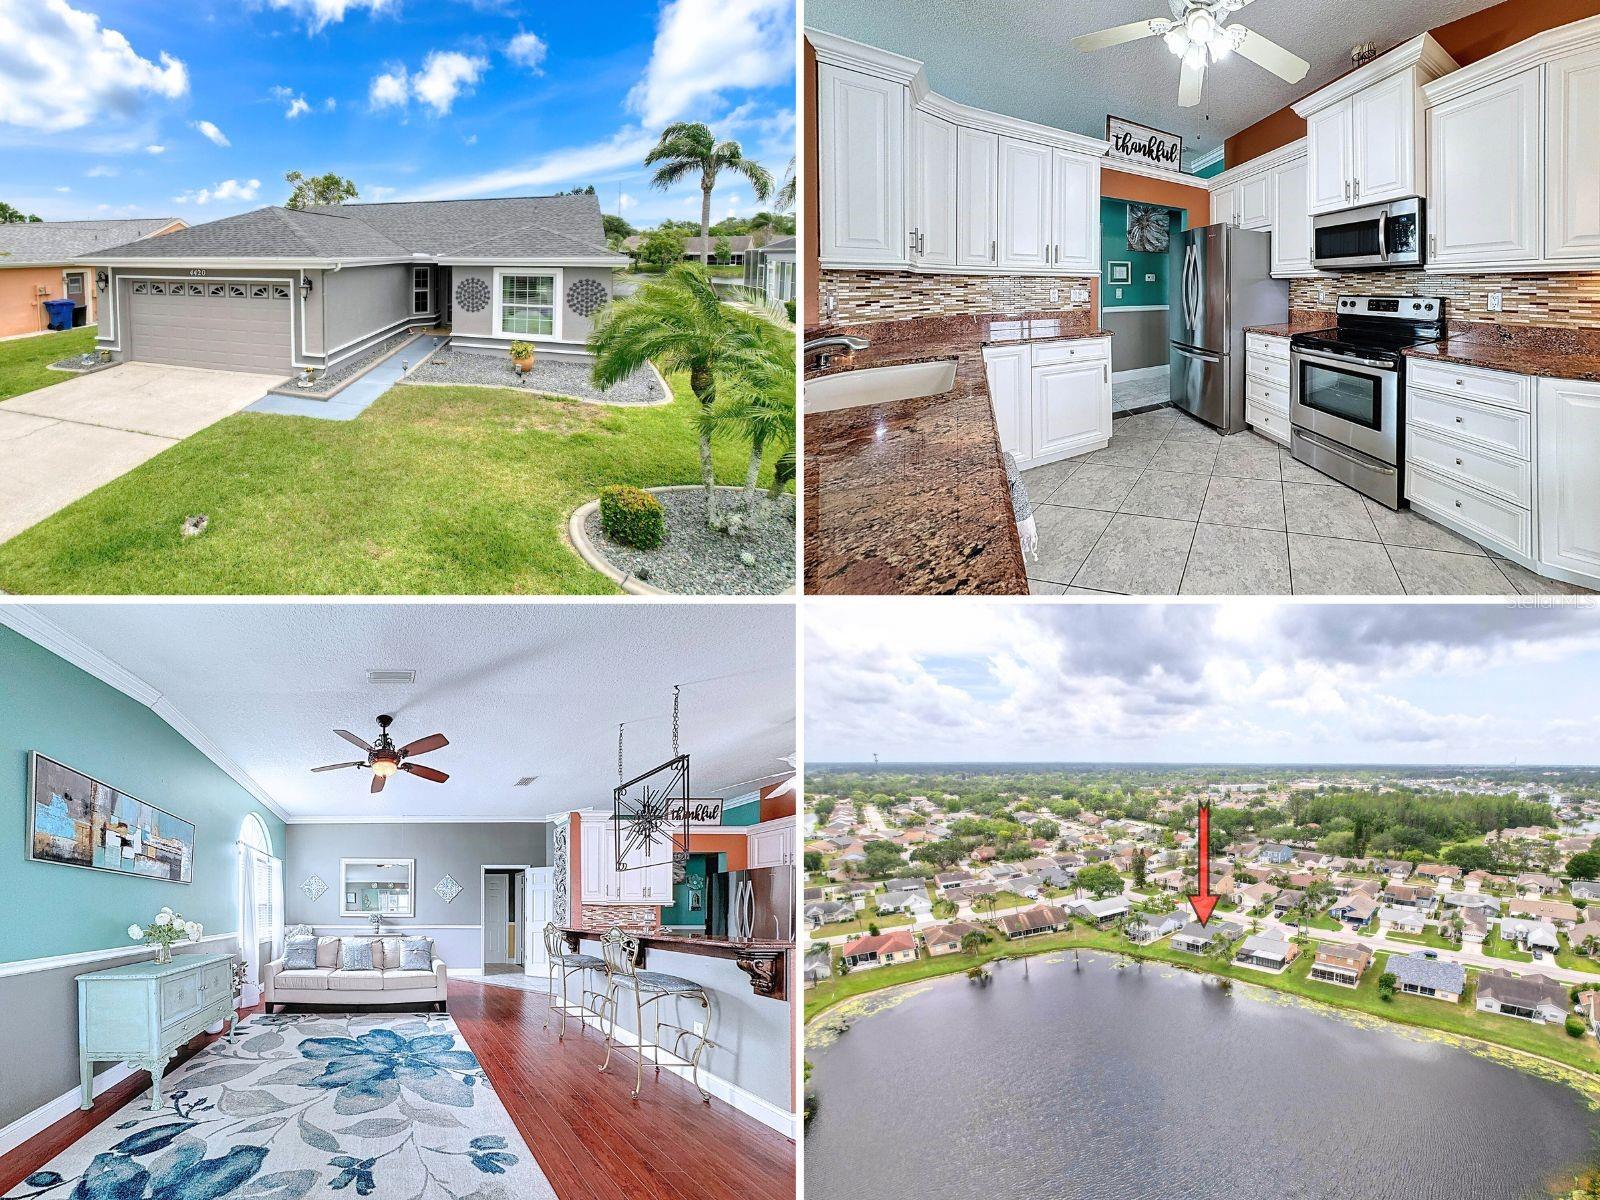
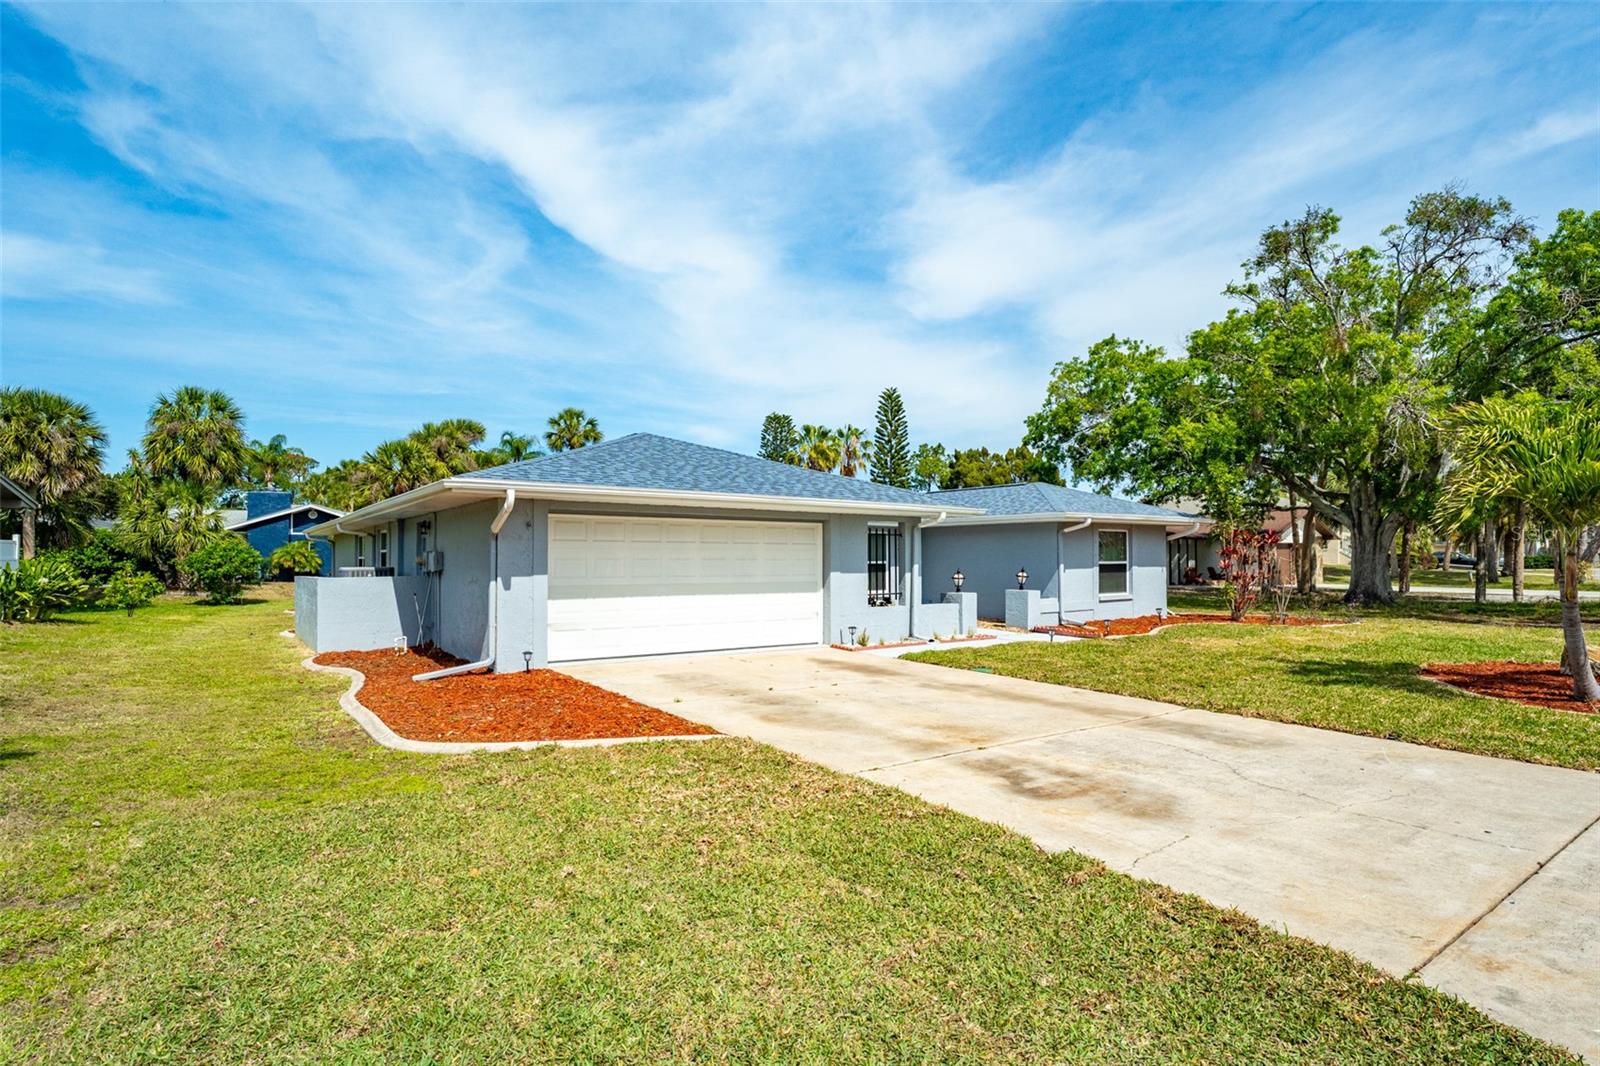
Active
$350,000
3
bds
|
2
ba
|
1,595
sqft
|
built
1989
4420 Devon Dr, New Port Richey, FL 34653
$-582
Cash flow
-8.7%
Cash-on-Cash Return
4.3%
Cap rate
0.6%
Rent to Value Ratio
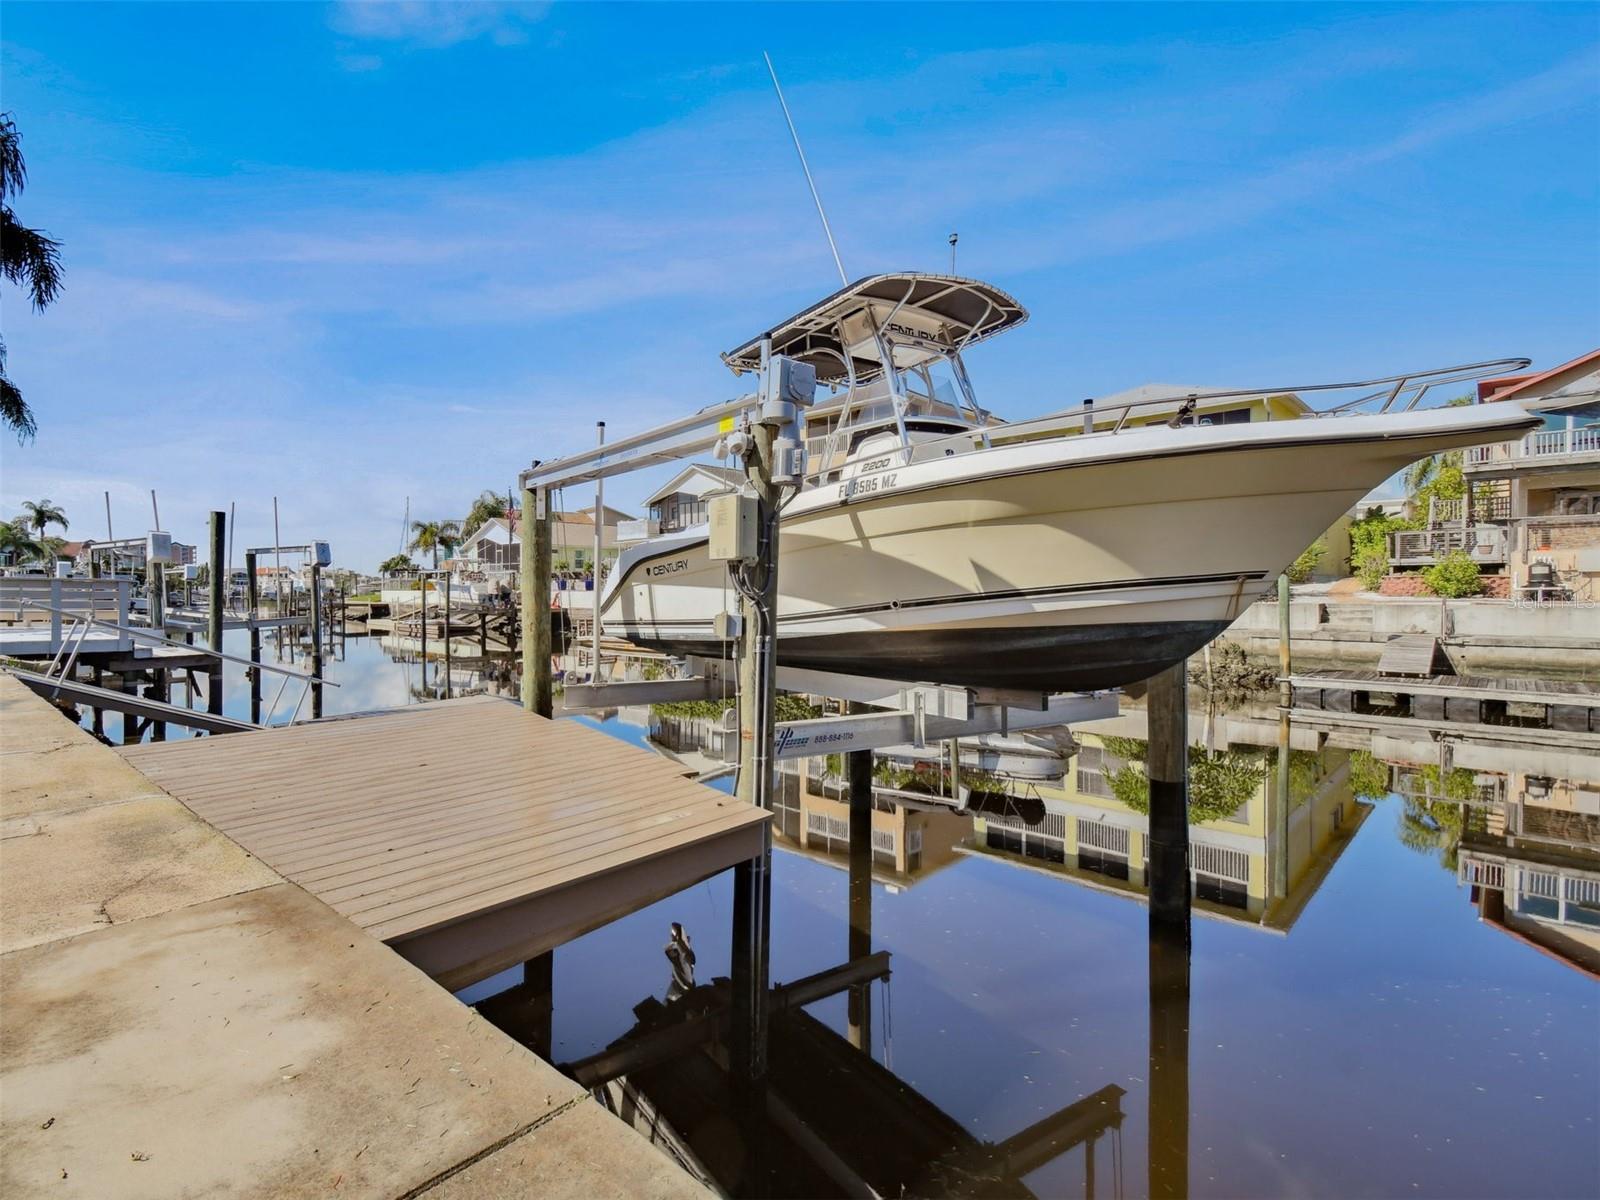
Active
$429,900
2
bds
|
1
ba
|
786
sqft
|
built
1960
4551 Floramar Ter, New Port Richey, FL 34652
$-1,150
Cash flow
-14.0%
Cash-on-Cash Return
3.1%
Cap rate
0.5%
Rent to Value Ratio
Active
$210,000
2
bds
|
2
ba
|
1,306
sqft
|
built
1988
5557 Sea Forest Dr, New Port Richey, FL 34652
$-162
Cash flow
-4.0%
Cash-on-Cash Return
5.4%
Cap rate
1.0%
Rent to Value Ratio
Active
$225,000
2
bds
|
2
ba
|
1,090
sqft
|
built
1962
4129 Highland Loop, New Port Richey, FL 34652
$-266
Cash flow
-6.2%
Cash-on-Cash Return
4.9%
Cap rate
0.7%
Rent to Value Ratio
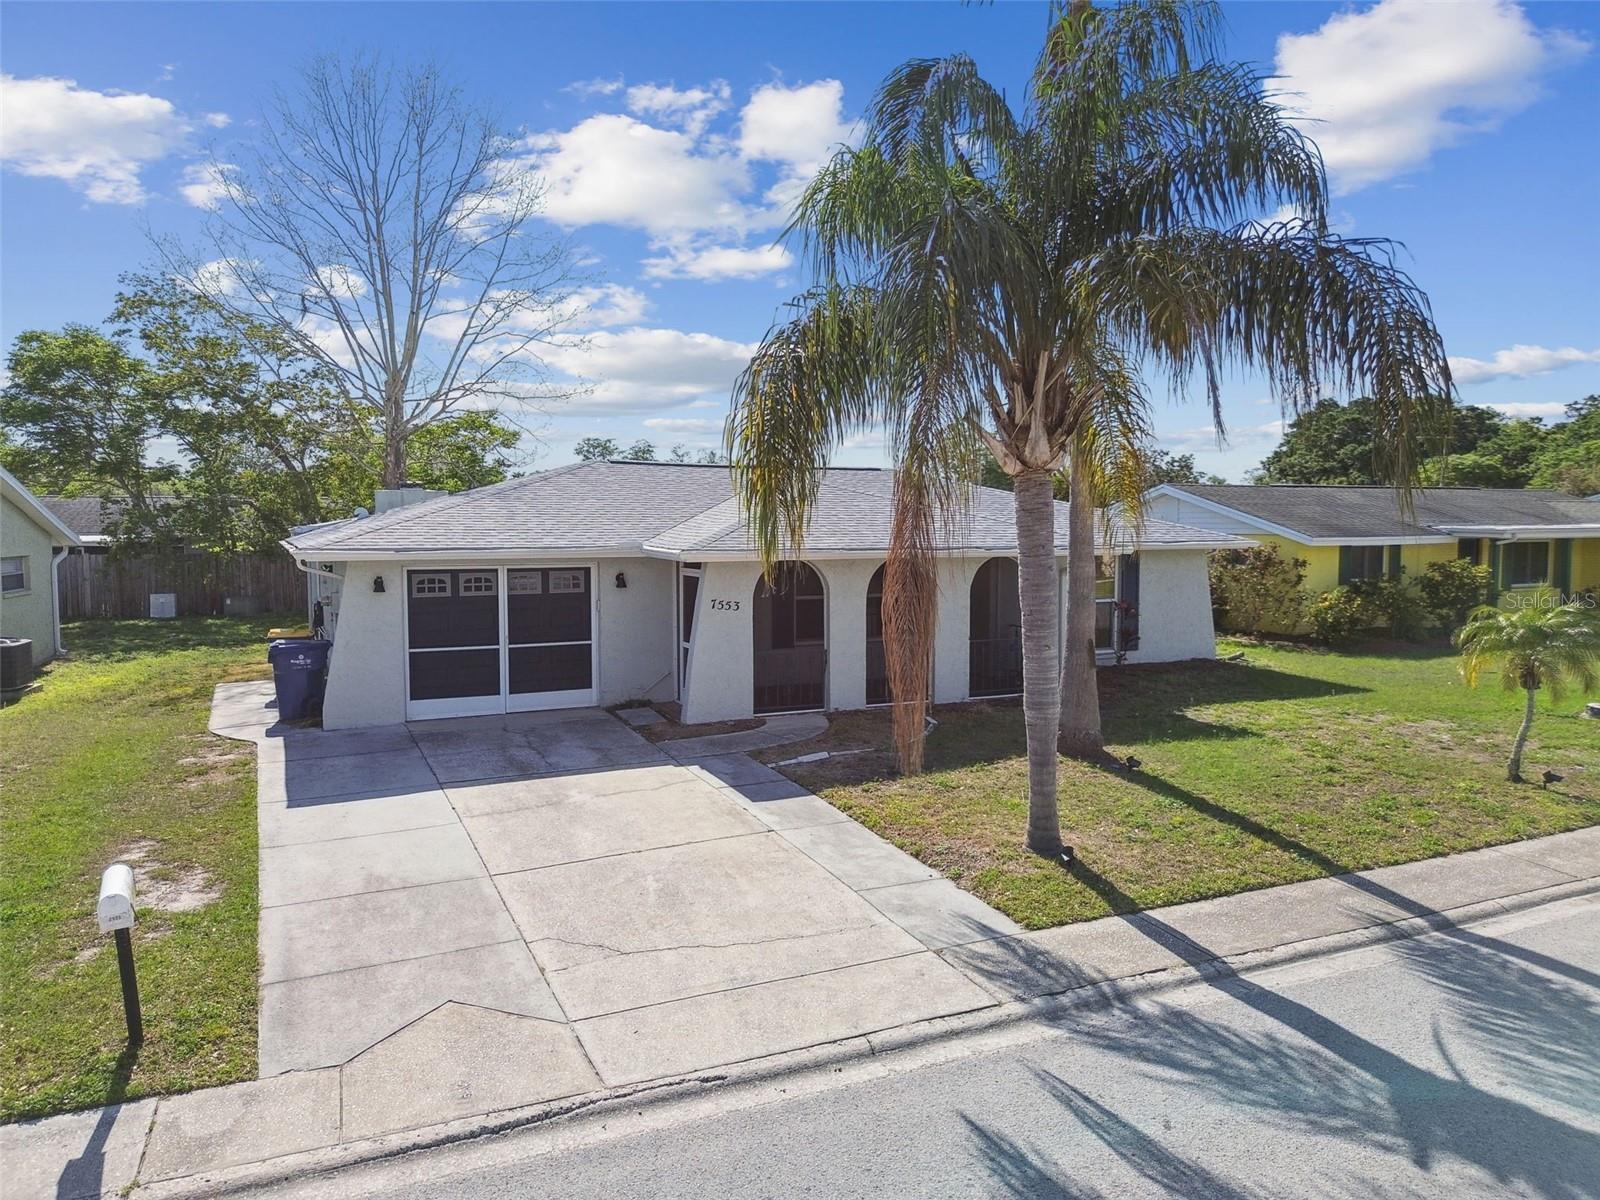
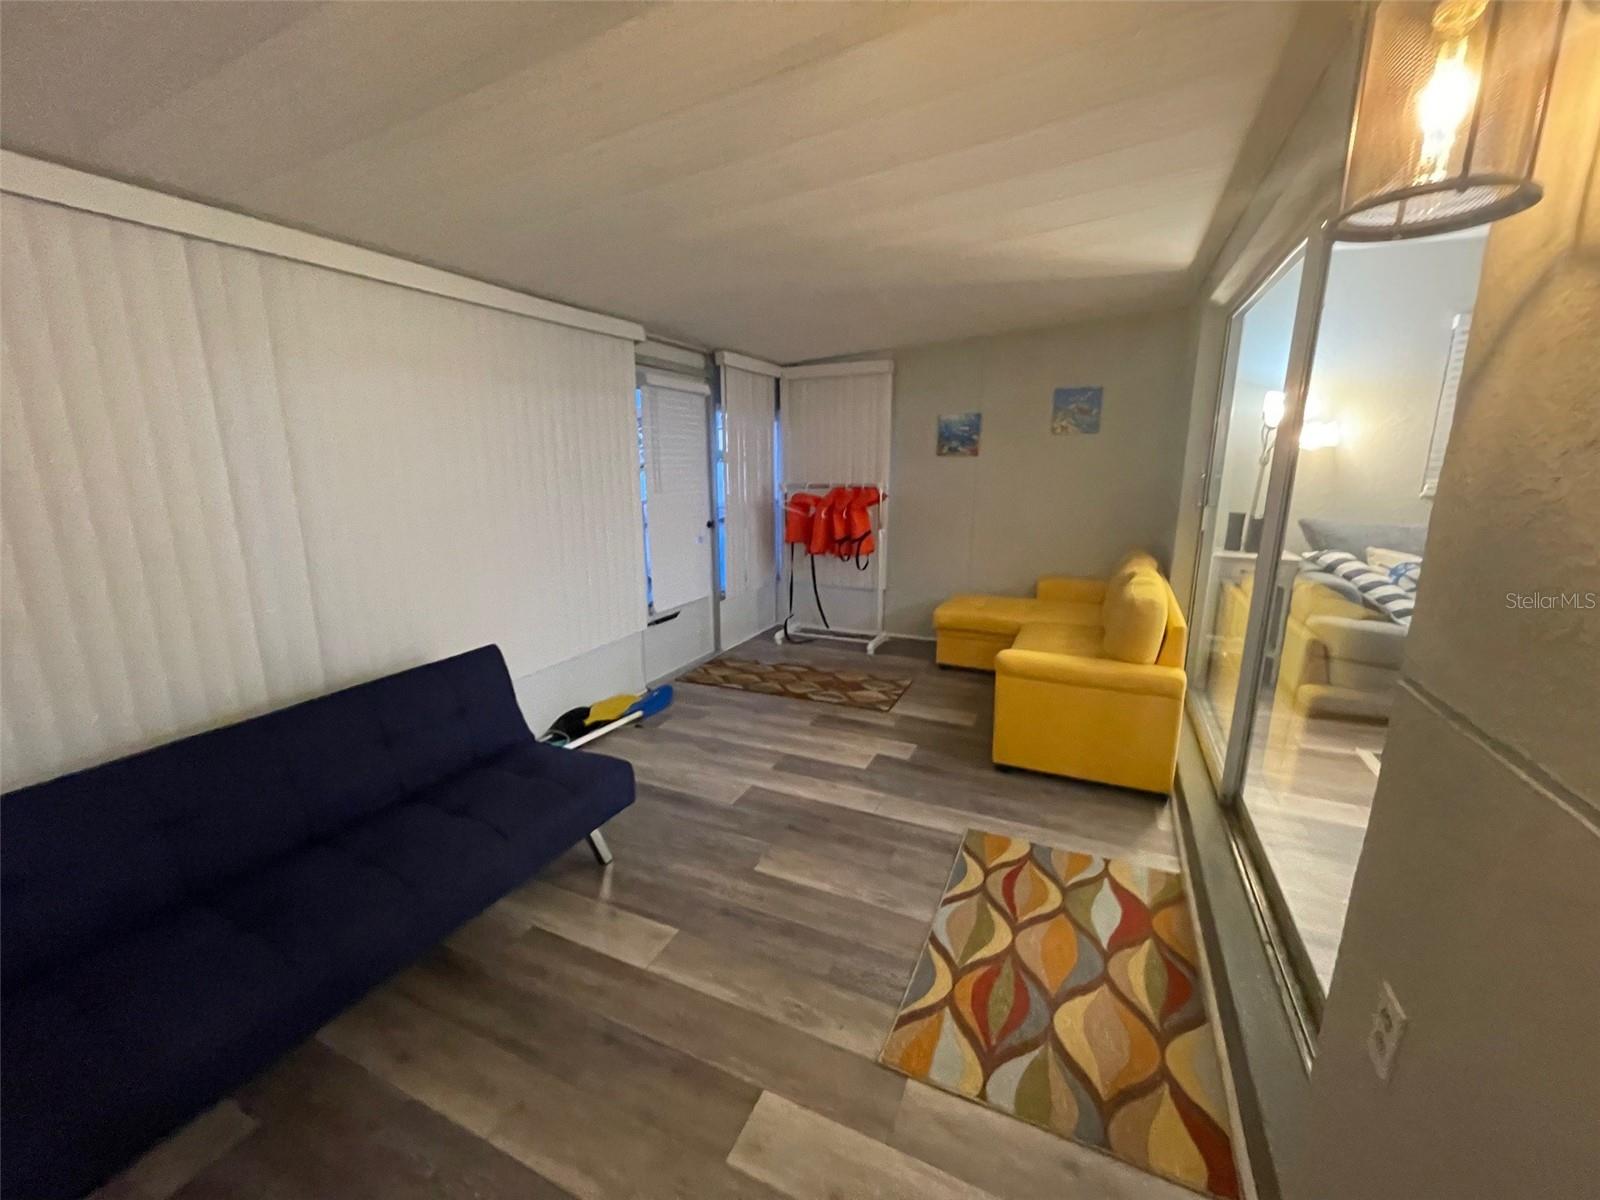
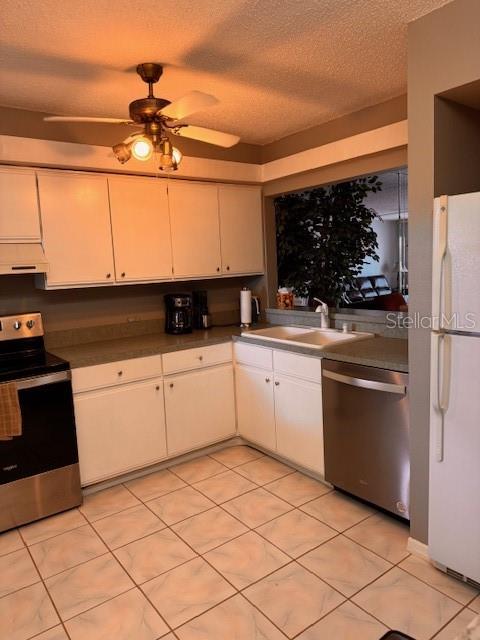
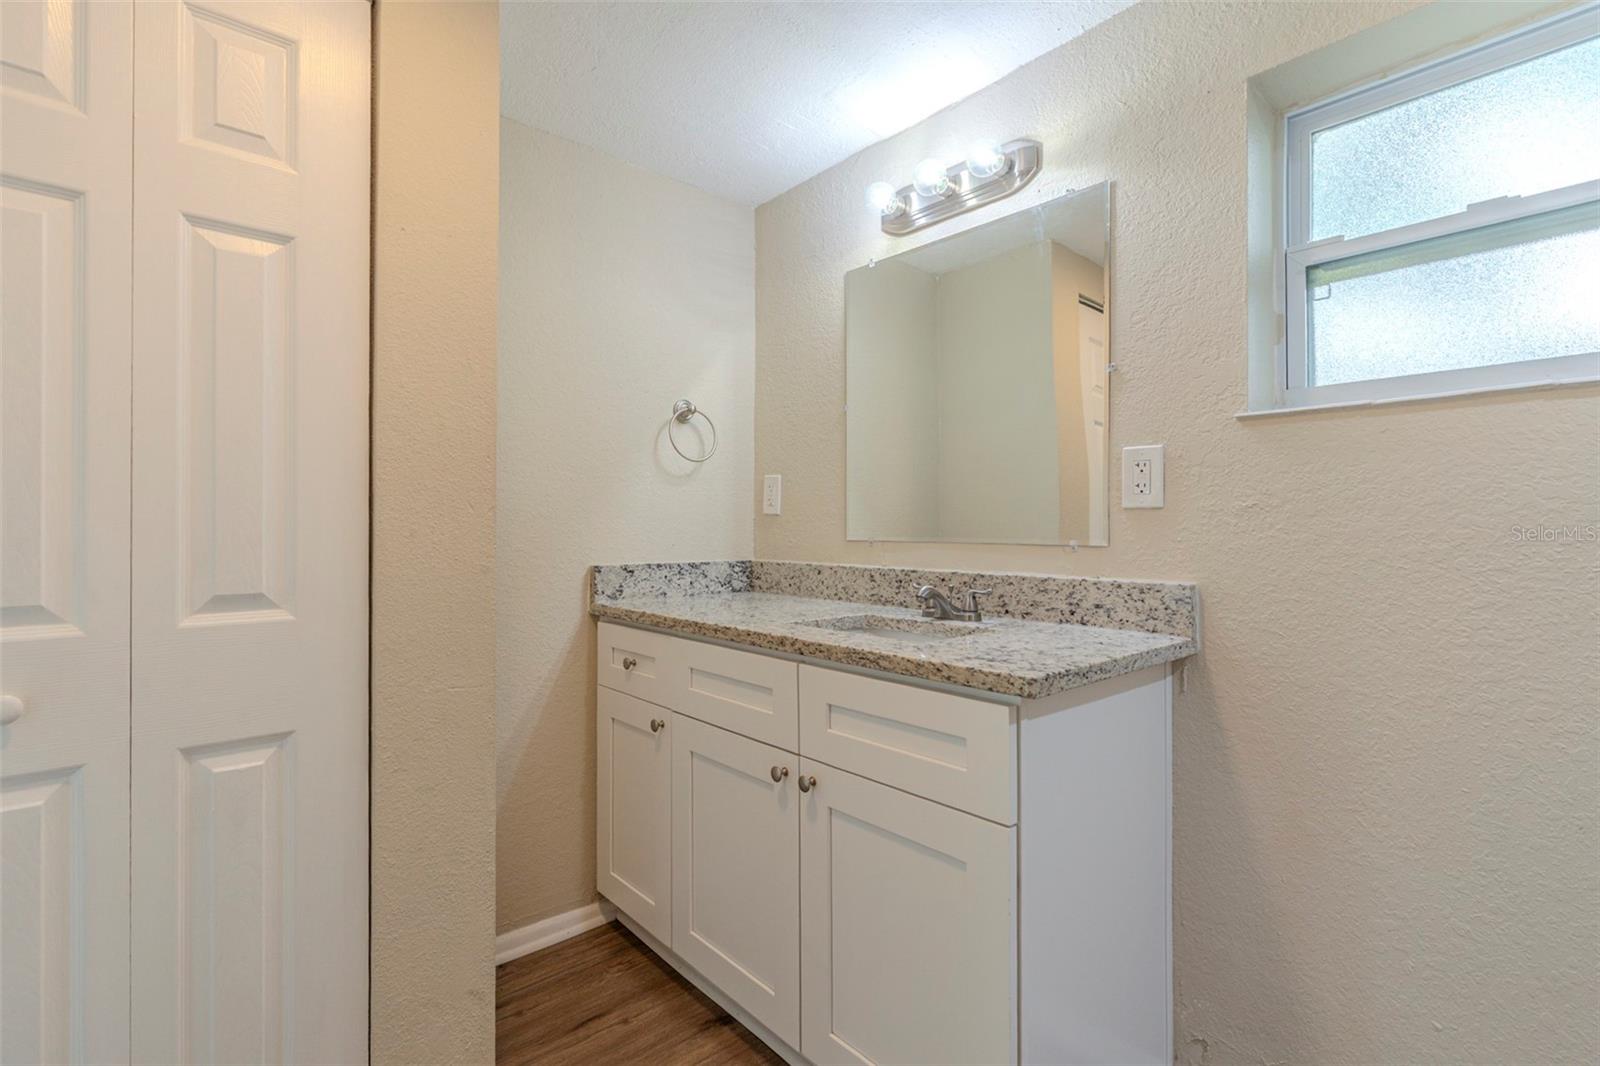
Active
$325,000
3
bds
|
2
ba
|
1,286
sqft
|
built
1980
7553 Sequoia Dr, New Port Richey, FL 34653
$-808
Cash flow
-13.0%
Cash-on-Cash Return
3.3%
Cap rate
0.6%
Rent to Value Ratio
Active
$224,000
1
bds
|
1
ba
|
693
sqft
|
built
1987
5712 Biscayne Ct, New Port Richey, FL 34652
$-488
Cash flow
-11.4%
Cash-on-Cash Return
3.7%
Cap rate
0.7%
Rent to Value Ratio
Active
$679,900
4
bds
|
3
ba
|
2,348
sqft
|
built
2005
1709 Nodding Thistle Dr, New Port Richey, FL 34655
$-1,631
Cash flow
-12.5%
Cash-on-Cash Return
3.4%
Cap rate
0.5%
Rent to Value Ratio
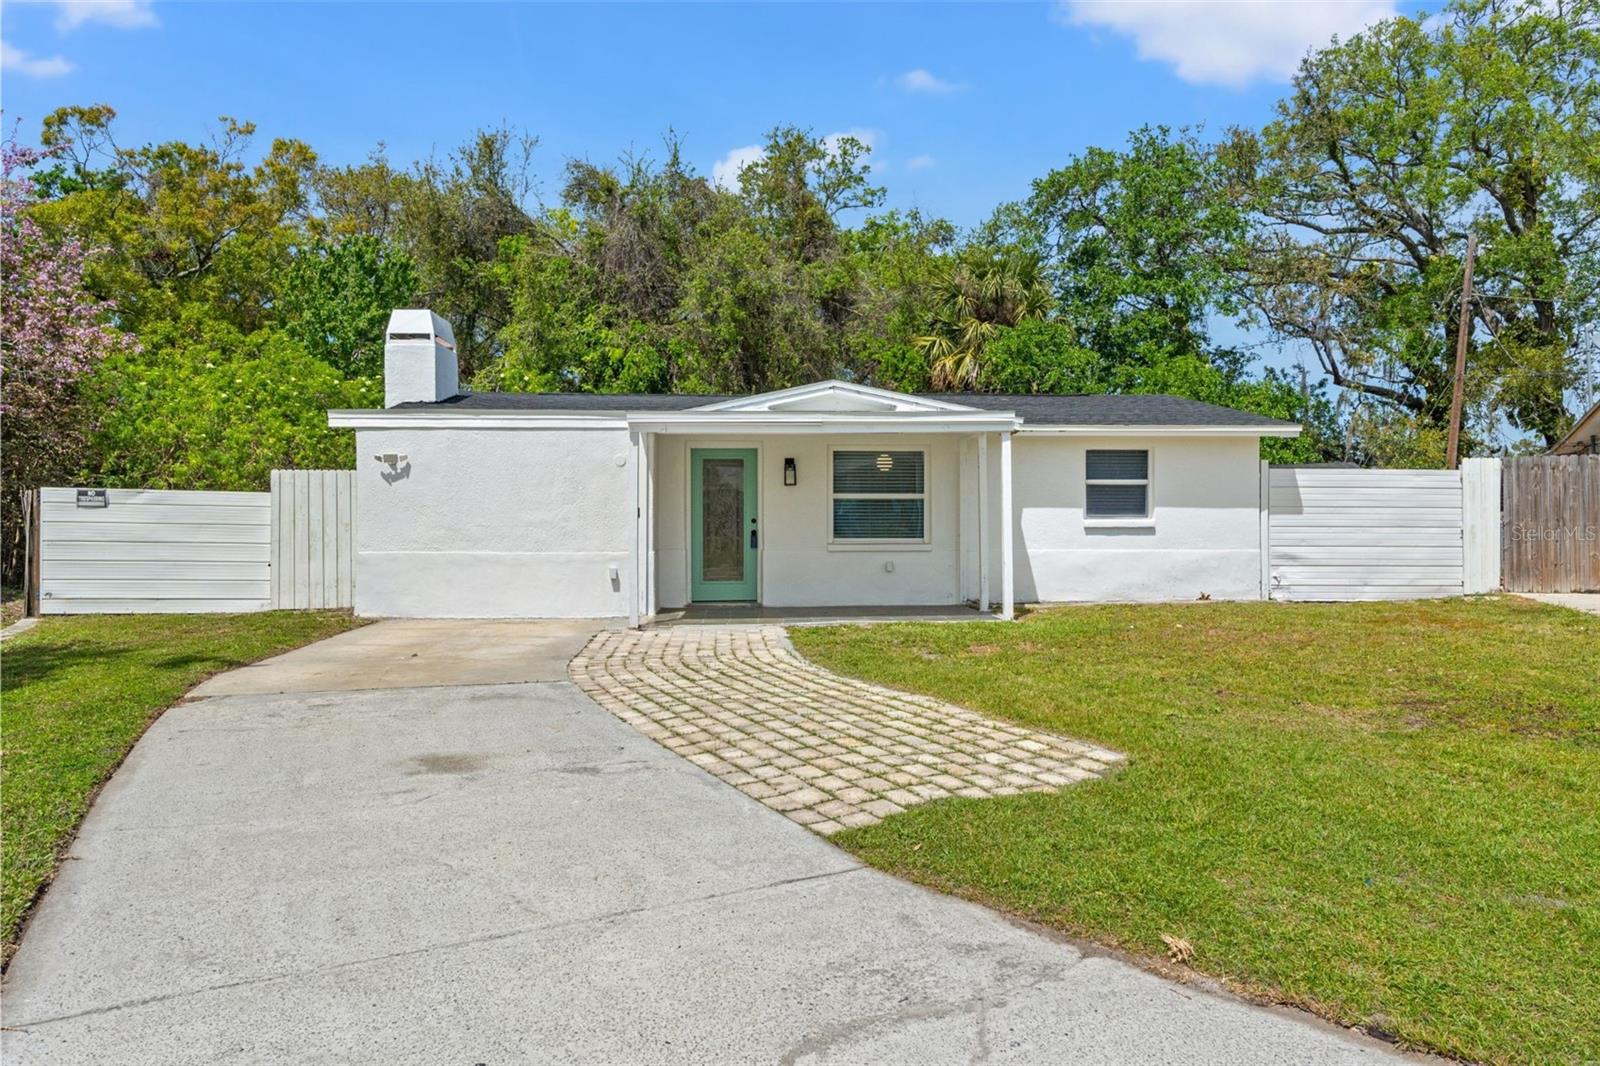
Active
$399,999
3
bds
|
3
ba
|
1,610
sqft
|
built
1956
6106 Montana Ave, New Port Richey, FL 34653
$-1,394
Cash flow
-18.2%
Cash-on-Cash Return
2.1%
Cap rate
0.4%
Rent to Value Ratio
Active
$495,000
4
bds
|
3
ba
|
2,053
sqft
|
built
1994
5412 Merkin Pl, New Port Richey, FL 34655
$-1,034
Cash flow
-10.9%
Cash-on-Cash Return
3.8%
Cap rate
0.5%
Rent to Value Ratio
Active
$317,000
2
bds
|
3
ba
|
1,541
sqft
|
built
2023
8299 Crescent Oaks Dr, New Port Richey, FL 34655
$-719
Cash flow
-11.8%
Cash-on-Cash Return
3.6%
Cap rate
0.7%
Rent to Value Ratio
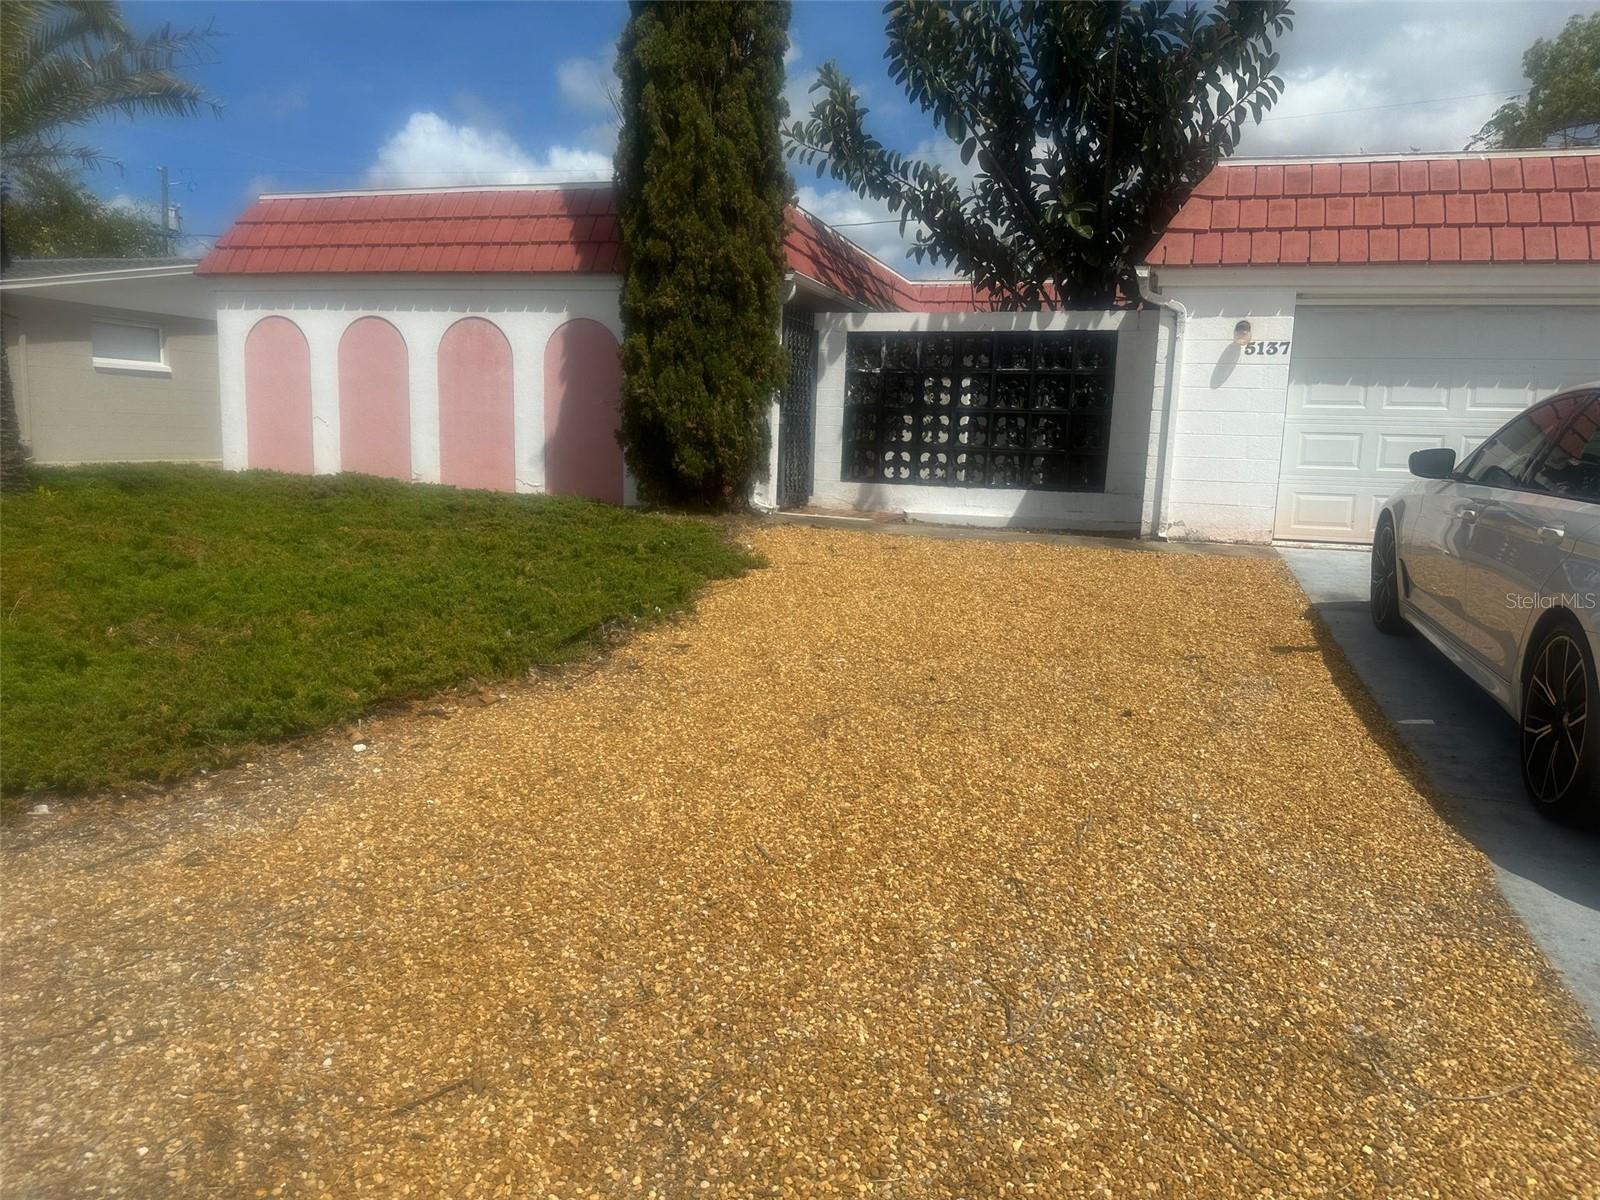
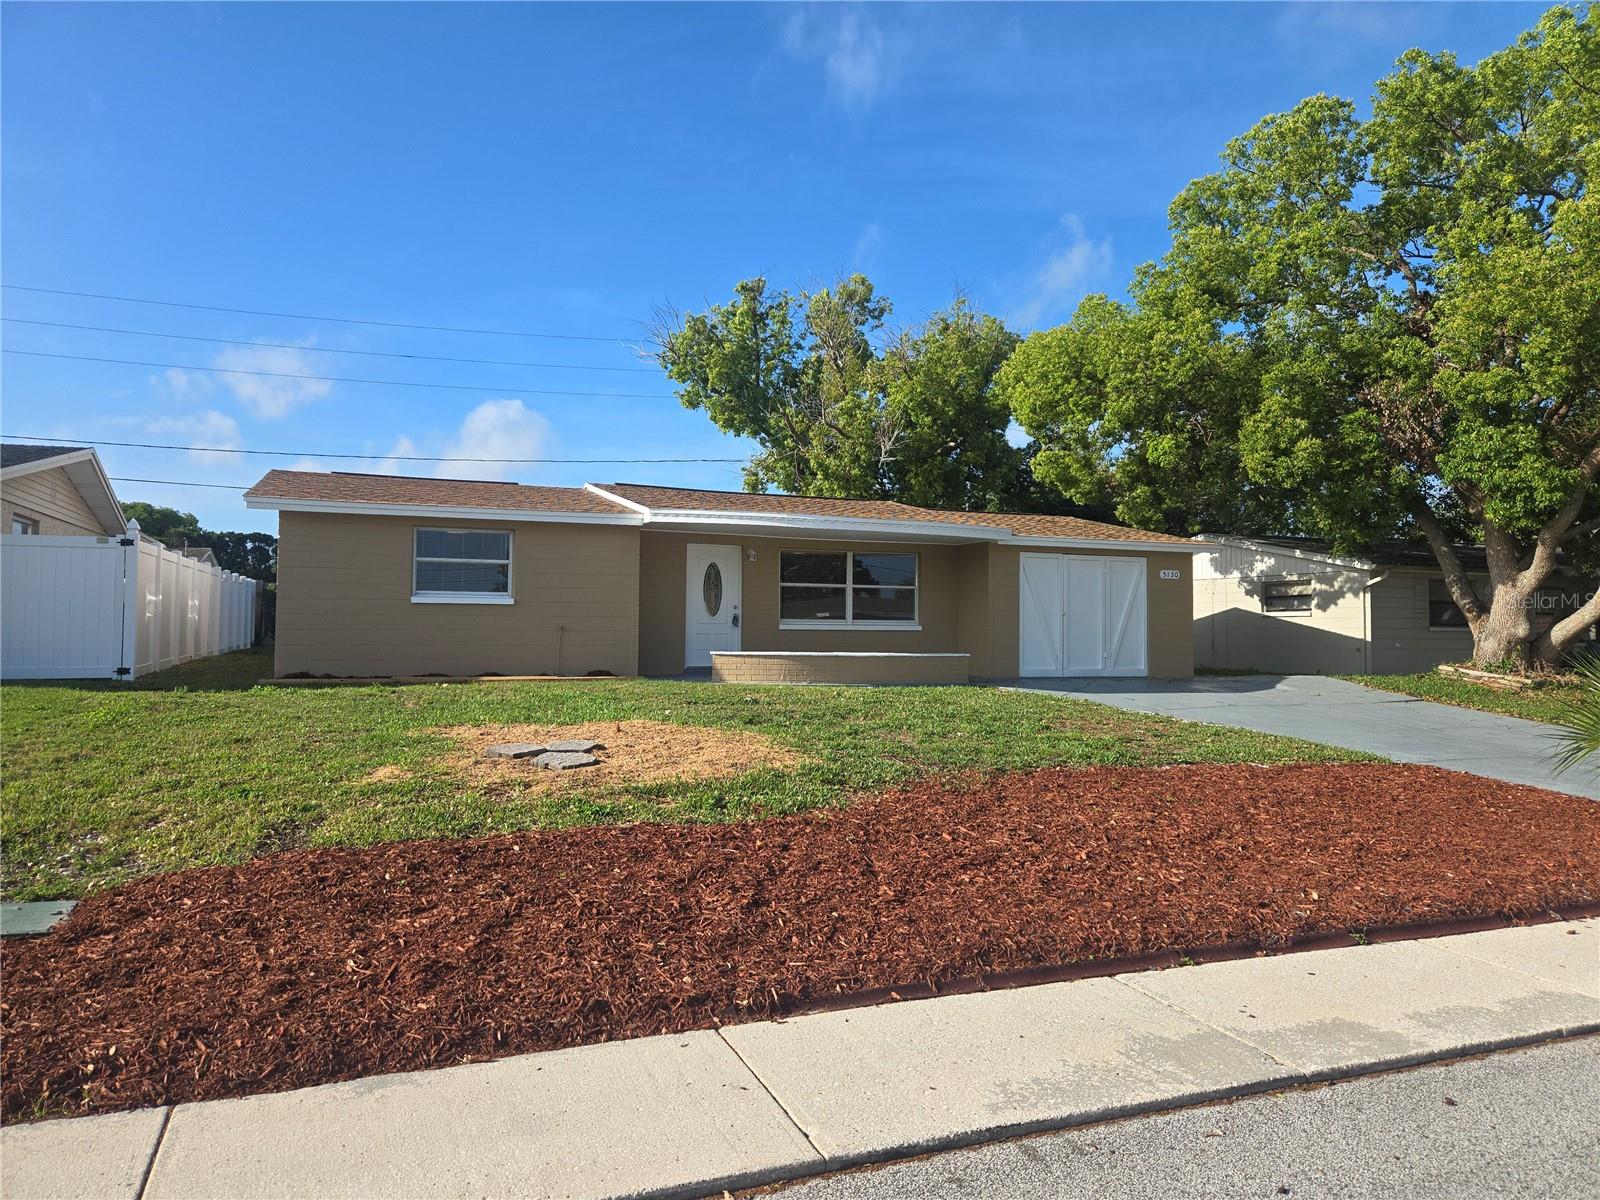
Active
$184,900
3
bds
|
2
ba
|
1,288
sqft
|
built
1970
5137 Manor Dr, New Port Richey, FL 34652
$7
Cash flow
0.2%
Cash-on-Cash Return
6.3%
Cap rate
1.0%
Rent to Value Ratio
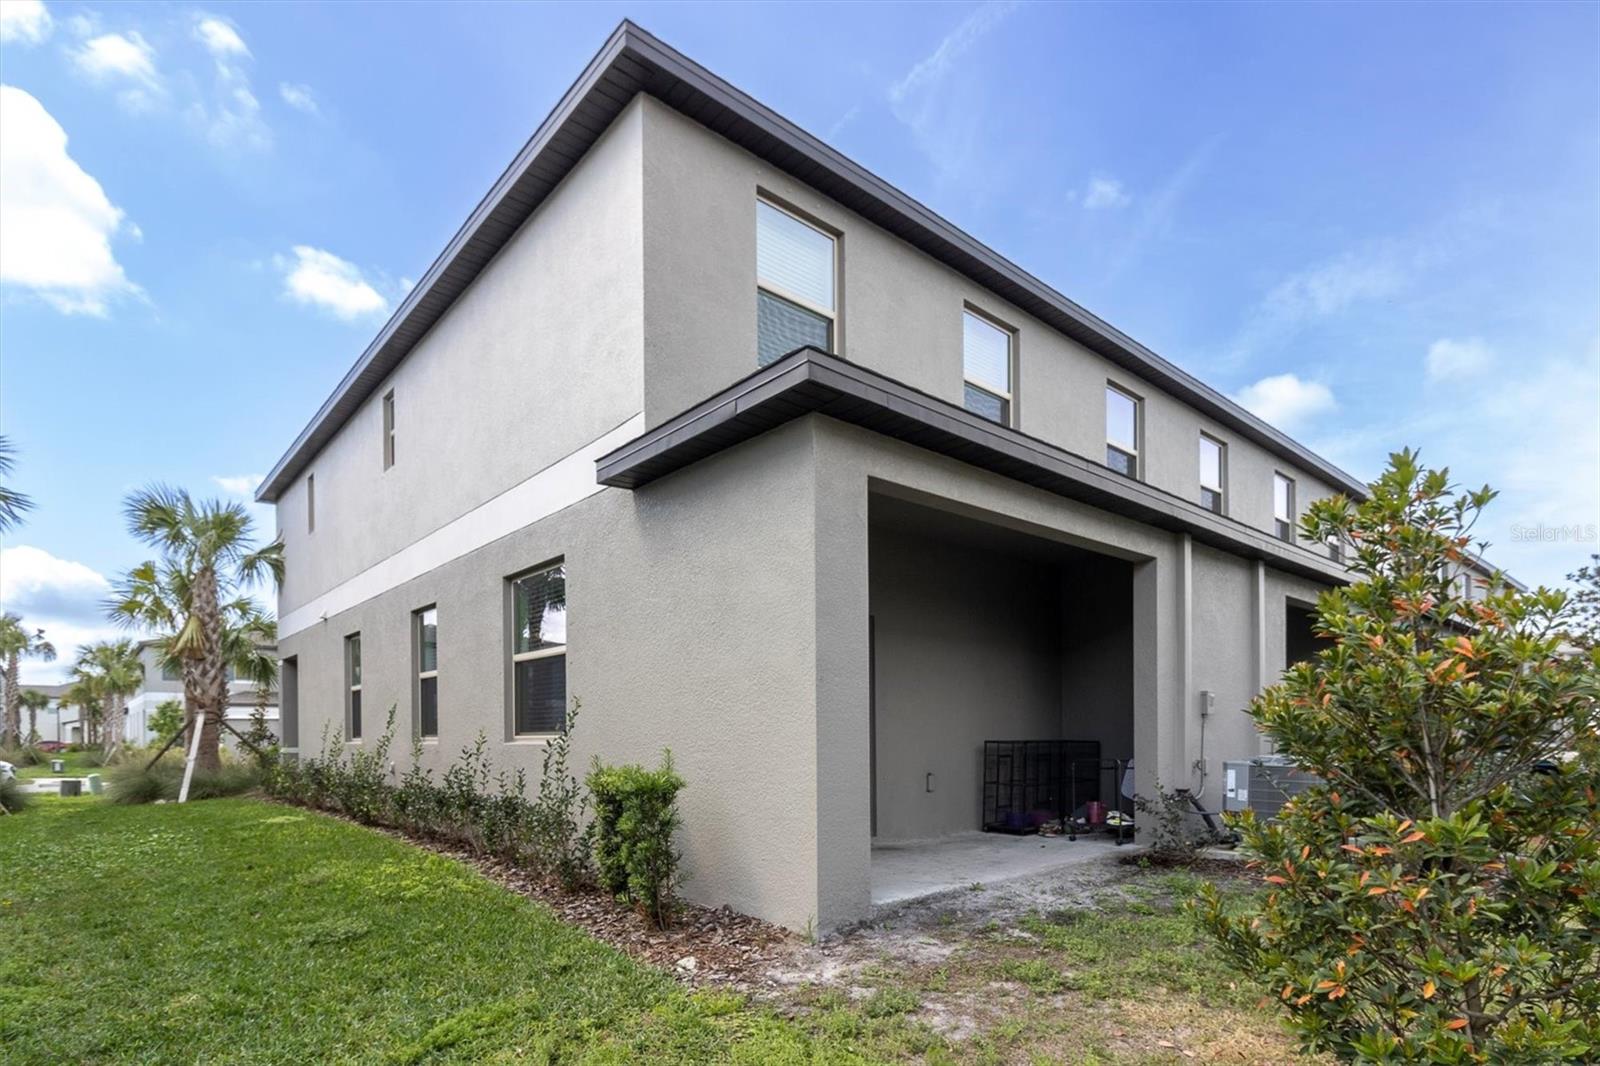
Active
$245,513
3
bds
|
2
ba
|
1,450
sqft
|
built
1970
5130 Tilson Dr, New Port Richey, FL 34652
$-101
Cash flow
-2.1%
Cash-on-Cash Return
5.8%
Cap rate
0.7%
Rent to Value Ratio
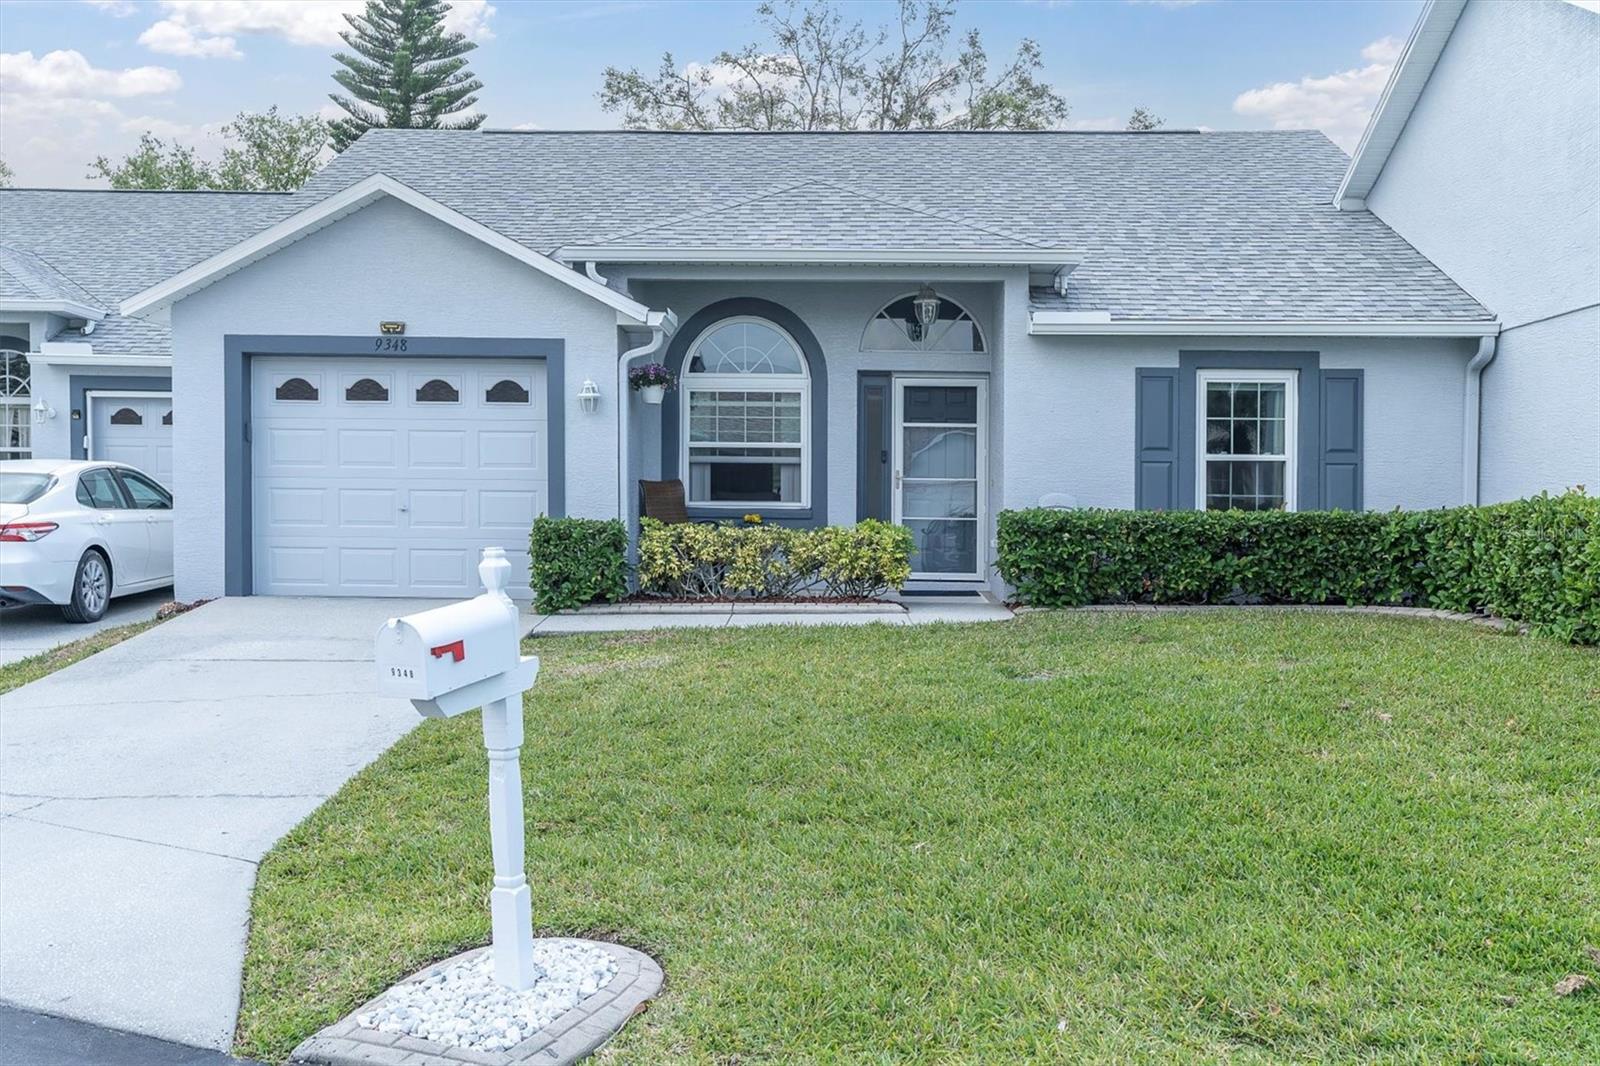
Active
$238,000
2
bds
|
2
ba
|
1,139
sqft
|
built
2005
9348 Villa Entrada, New Port Richey, FL 34655
$-523
Cash flow
-11.5%
Cash-on-Cash Return
3.6%
Cap rate
0.8%
Rent to Value Ratio
Active
$295,000
2
bds
|
3
ba
|
1,509
sqft
|
built
2018
5524 Yellowfin Ct, New Port Richey, FL 34652
$-489
Cash flow
-8.6%
Cash-on-Cash Return
4.3%
Cap rate
0.8%
Rent to Value Ratio
Active
$659,000
5
bds
|
5
ba
|
3,231
sqft
|
built
2022
8364 Capstone Ranch Dr, New Port Richey, FL 34655
$-1,245
Cash flow
-9.9%
Cash-on-Cash Return
4.0%
Cap rate
0.7%
Rent to Value Ratio
Active
$221,800
2
bds
|
1
ba
|
816
sqft
|
built
1959
7139 Adare Dr, New Port Richey, FL 34653
$-255
Cash flow
-6.0%
Cash-on-Cash Return
4.9%
Cap rate
0.6%
Rent to Value Ratio
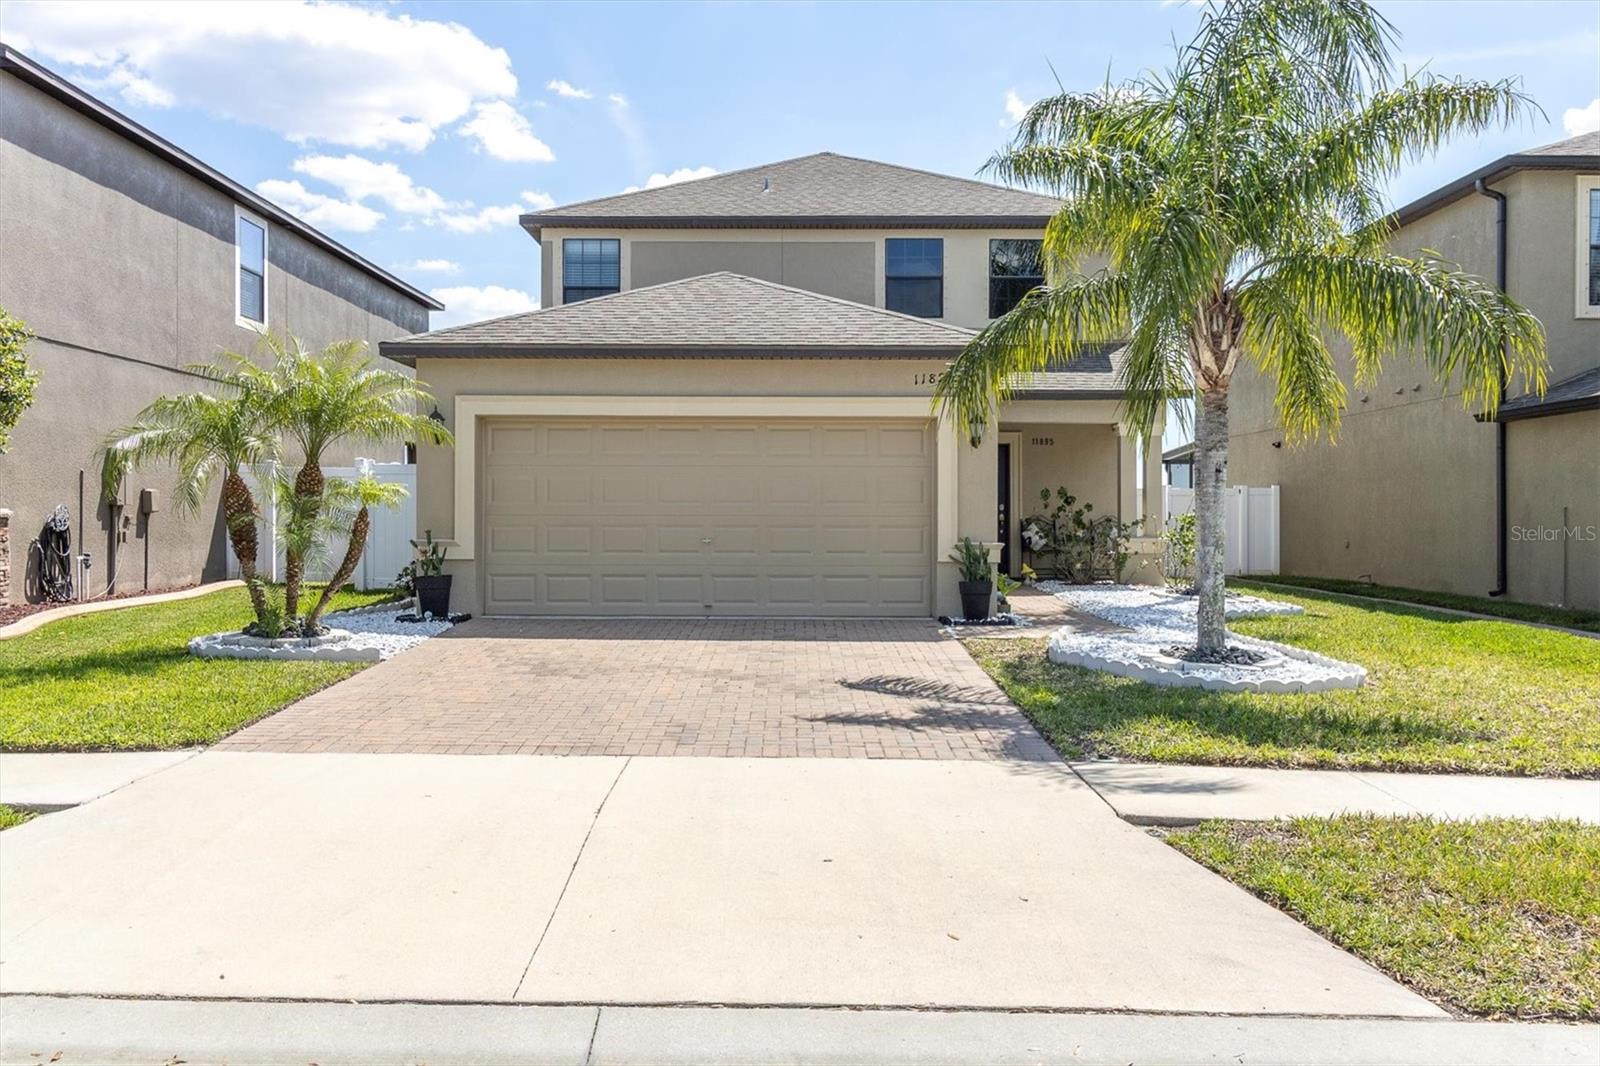
Active
$448,900
3
bds
|
3
ba
|
1,810
sqft
|
built
2015
11895 Crestridge Loop, New Port Richey, FL 34655
$-858
Cash flow
-10.0%
Cash-on-Cash Return
4.0%
Cap rate
0.6%
Rent to Value Ratio
Active
$145,500
1
bds
|
1
ba
|
715
sqft
|
built
1975
4939 Floramar Ter, New Port Richey, FL 34652
$37
Cash flow
1.3%
Cash-on-Cash Return
6.6%
Cap rate
1.0%
Rent to Value Ratio
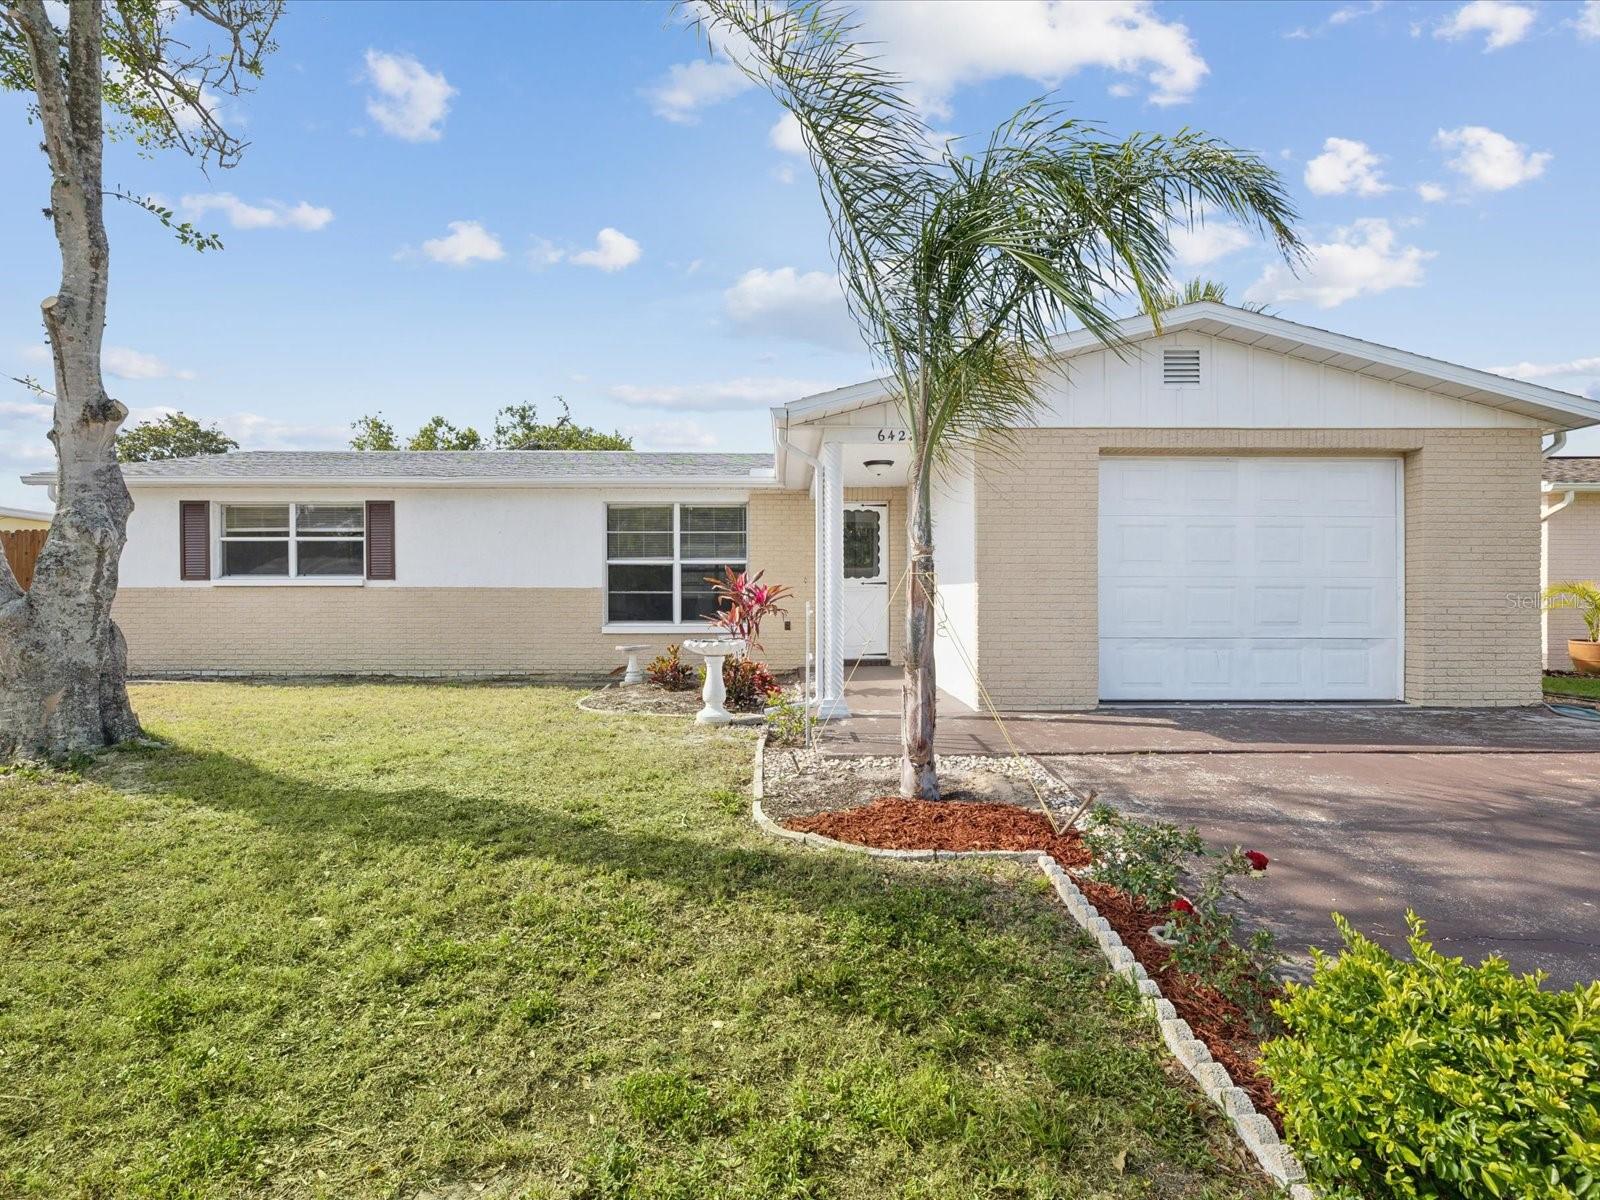
Active
$254,900
2
bds
|
2
ba
|
1,264
sqft
|
built
1974
6422 Tralee Ave, New Port Richey, FL 34653
$-338
Cash flow
-6.9%
Cash-on-Cash Return
4.7%
Cap rate
0.7%
Rent to Value Ratio
Active
$949,000
5
bds
|
3
ba
|
3,570
sqft
|
built
1986
6241 Bayside Dr, New Port Richey, FL 34652
$-1,751
Cash flow
-9.6%
Cash-on-Cash Return
4.1%
Cap rate
0.7%
Rent to Value Ratio
Active
$120,000
2
bds
|
1
ba
|
924
sqft
|
built
1958
7339 Royal Palm Dr, New Port Richey, FL 34652
$365
Cash flow
15.9%
Cash-on-Cash Return
9.9%
Cap rate
1.4%
Rent to Value Ratio
Active
$225,000
3
bds
|
2
ba
|
1,443
sqft
|
built
1967
4613 Irene Loop, New Port Richey, FL 34652
$-103
Cash flow
-2.4%
Cash-on-Cash Return
5.7%
Cap rate
0.7%
Rent to Value Ratio
Active
$224,900
2
bds
|
1
ba
|
1,068
sqft
|
built
1970
4107 Glissade Dr, New Port Richey, FL 34652
$-130
Cash flow
-3.0%
Cash-on-Cash Return
5.6%
Cap rate
0.8%
Rent to Value Ratio
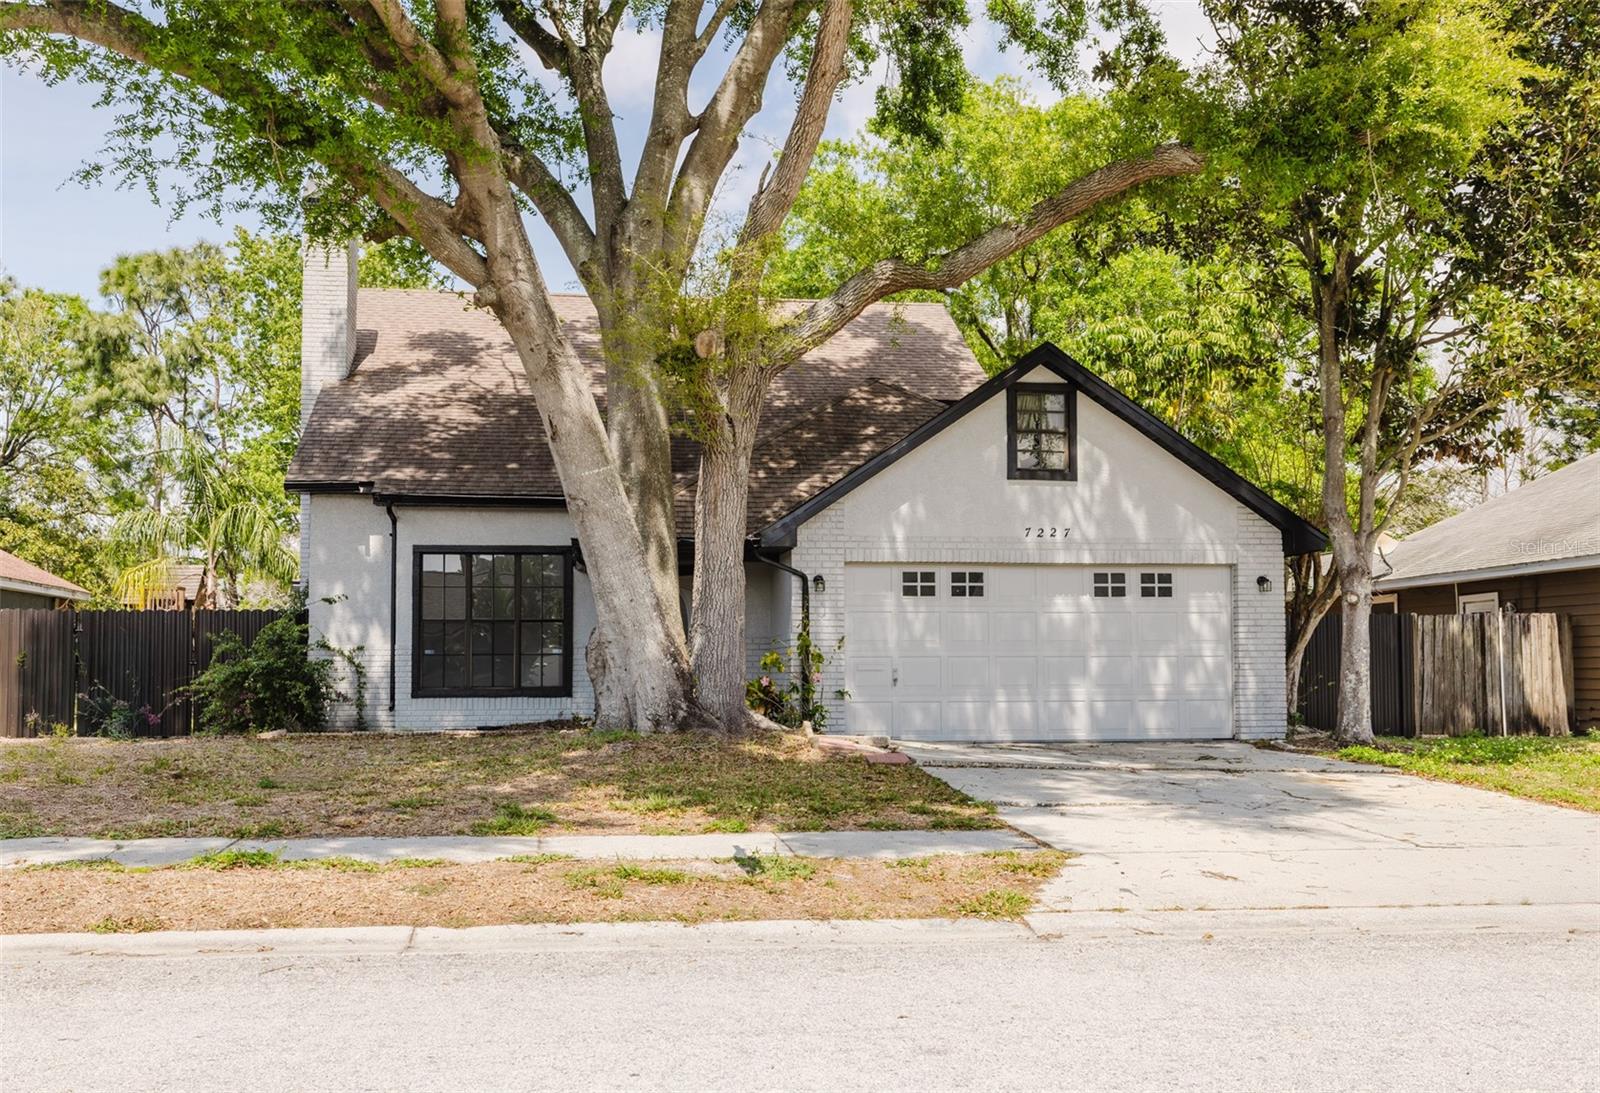
Active
$480,000
4
bds
|
3
ba
|
1,891
sqft
|
built
1988
7227 Otter Creek Dr, New Port Richey, FL 34655
$-1,466
Cash flow
-15.9%
Cash-on-Cash Return
2.6%
Cap rate
0.5%
Rent to Value Ratio
Active
$333,000
2
bds
|
2
ba
|
1,226
sqft
|
built
1977
7336 Ivory Ter, New Port Richey, FL 34655
$-558
Cash flow
-8.7%
Cash-on-Cash Return
4.3%
Cap rate
0.5%
Rent to Value Ratio
Active
$119,000
2
bds
|
2
ba
|
1,088
sqft
|
built
1974
4557 Garnet Dr, New Port Richey, FL 34652
$367
Cash flow
16.1%
Cash-on-Cash Return
10.0%
Cap rate
1.4%
Rent to Value Ratio
Active
$469,000
3
bds
|
2
ba
|
1,896
sqft
|
built
1990
5343 Sagamore Ct, New Port Richey, FL 34655
$-1,041
Cash flow
-11.6%
Cash-on-Cash Return
3.6%
Cap rate
0.6%
Rent to Value Ratio
Active
$244,500
2
bds
|
2
ba
|
907
sqft
|
built
1988
7827 Crosier Ct, New Port Richey, FL 34653
$-263
Cash flow
-5.6%
Cash-on-Cash Return
5.0%
Cap rate
0.7%
Rent to Value Ratio
Active
$345,000
4
bds
|
2
ba
|
1,920
sqft
|
built
1977
7240 Creek Dr, New Port Richey, FL 34655
$-554
Cash flow
-8.4%
Cash-on-Cash Return
4.4%
Cap rate
0.6%
Rent to Value Ratio
Active
$670,000
4
bds
|
3
ba
|
2,708
sqft
|
built
1997
7345 Brightwaters Ct, New Port Richey, FL 34652
$-811
Cash flow
-6.3%
Cash-on-Cash Return
4.8%
Cap rate
0.6%
Rent to Value Ratio
Active
$244,900
2
bds
|
2
ba
|
1,608
sqft
|
built
1979
3252 Scorecard Dr, New Port Richey, FL 34655
$344
Cash flow
7.3%
Cash-on-Cash Return
8.0%
Cap rate
1.0%
Rent to Value Ratio
Active
$1,106,000
5
bds
|
3
ba
|
3,109
sqft
|
built
1986
6311 Bayside Dr, New Port Richey, FL 34652
$-2,761
Cash flow
-13.0%
Cash-on-Cash Return
3.3%
Cap rate
0.5%
Rent to Value Ratio
Active
$368,000
3
bds
|
2
ba
|
1,924
sqft
|
built
1981
5471 Nimitz Rd, New Port Richey, FL 34652
$-514
Cash flow
-7.3%
Cash-on-Cash Return
4.6%
Cap rate
0.7%
Rent to Value Ratio
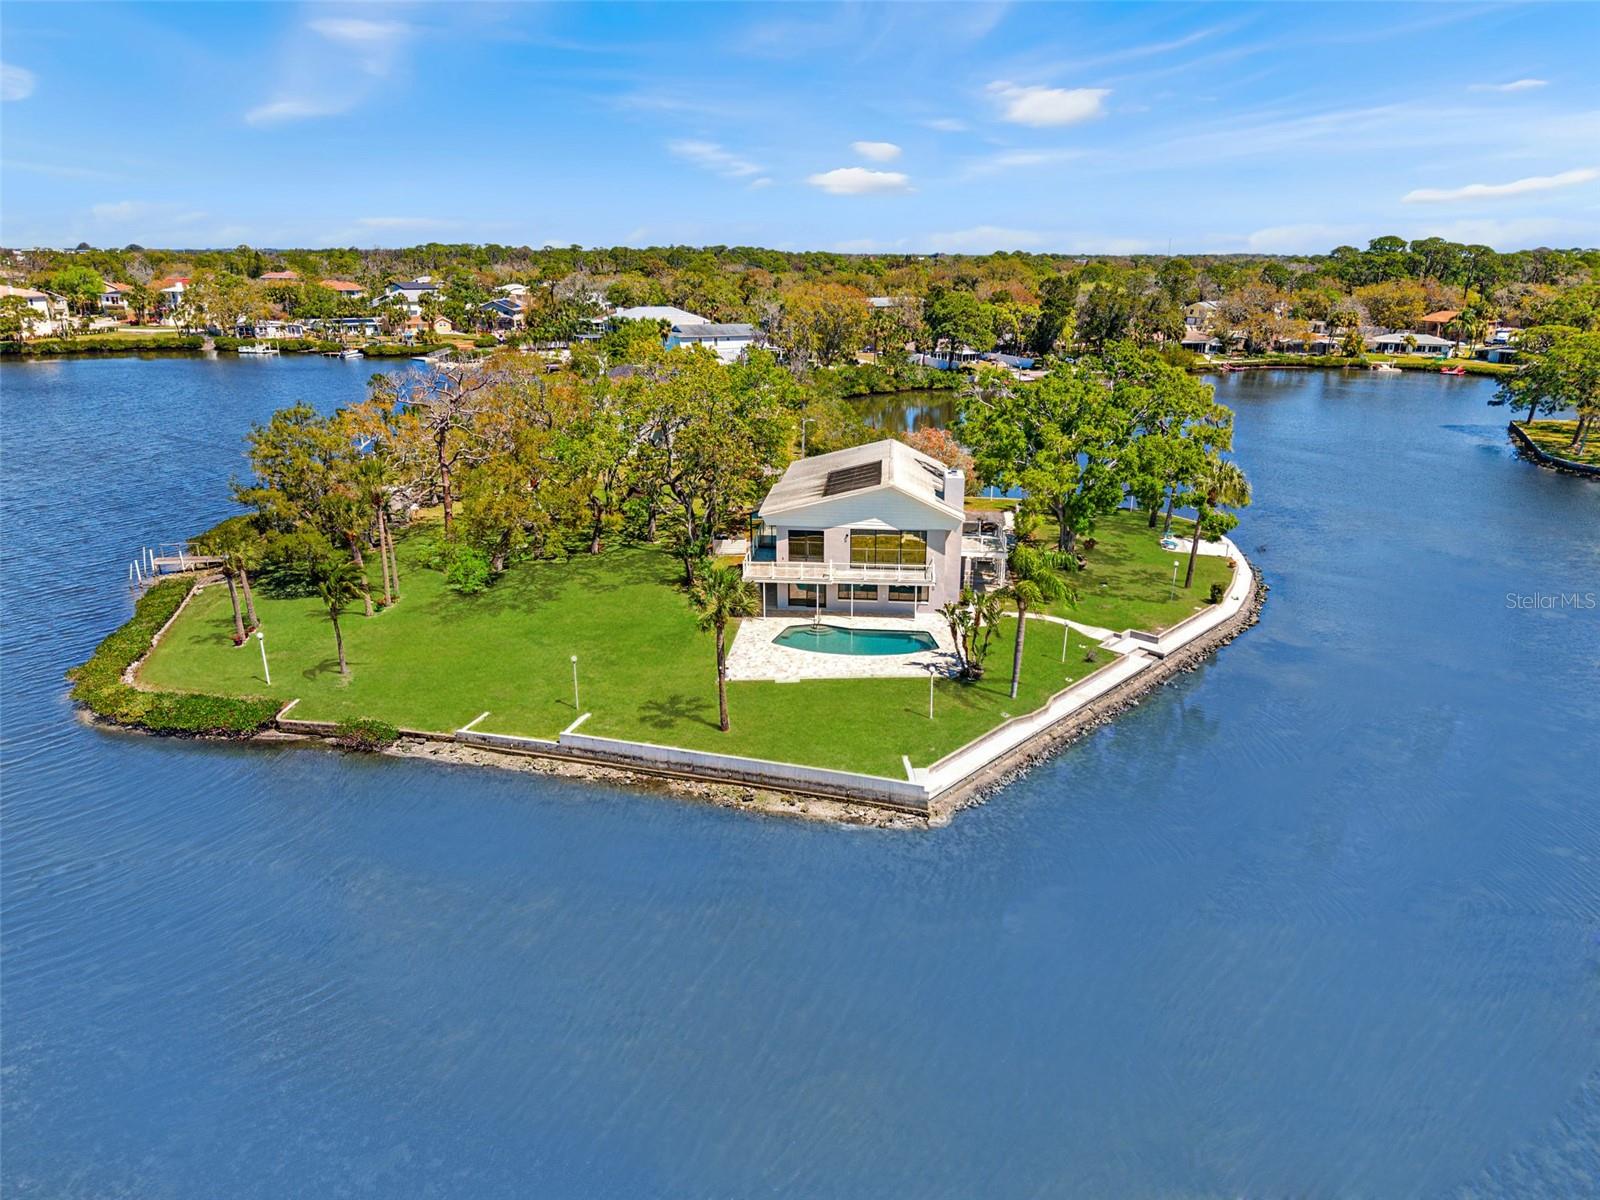
Active
$1,250,000
bds
|
0
ba
|
3,372
sqft
|
built
1979
7049 Peninsular Dr, New Port Richey, FL 34652
$-4,966
Cash flow
-20.7%
Cash-on-Cash Return
1.5%
Cap rate
0.2%
Rent to Value Ratio
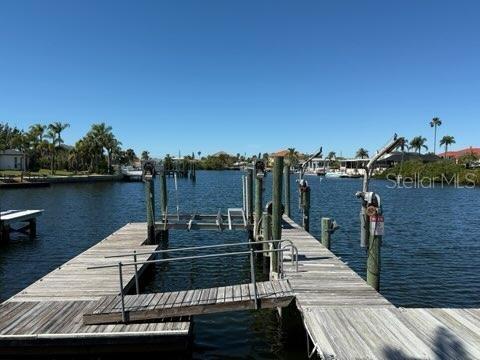
Active
$725,000
3
bds
|
3
ba
|
1,598
sqft
|
built
1962
3747 Floramar Ter, New Port Richey, FL 34652
$-2,007
Cash flow
-14.4%
Cash-on-Cash Return
3.0%
Cap rate
0.5%
Rent to Value Ratio