Norcross, GA Investment Properties for Sale
Browse homes for sale and investment properties in Norcross, GA. Refine your search by price, property type, or more.
Best cash flowing properties in Norcross, GA
Active
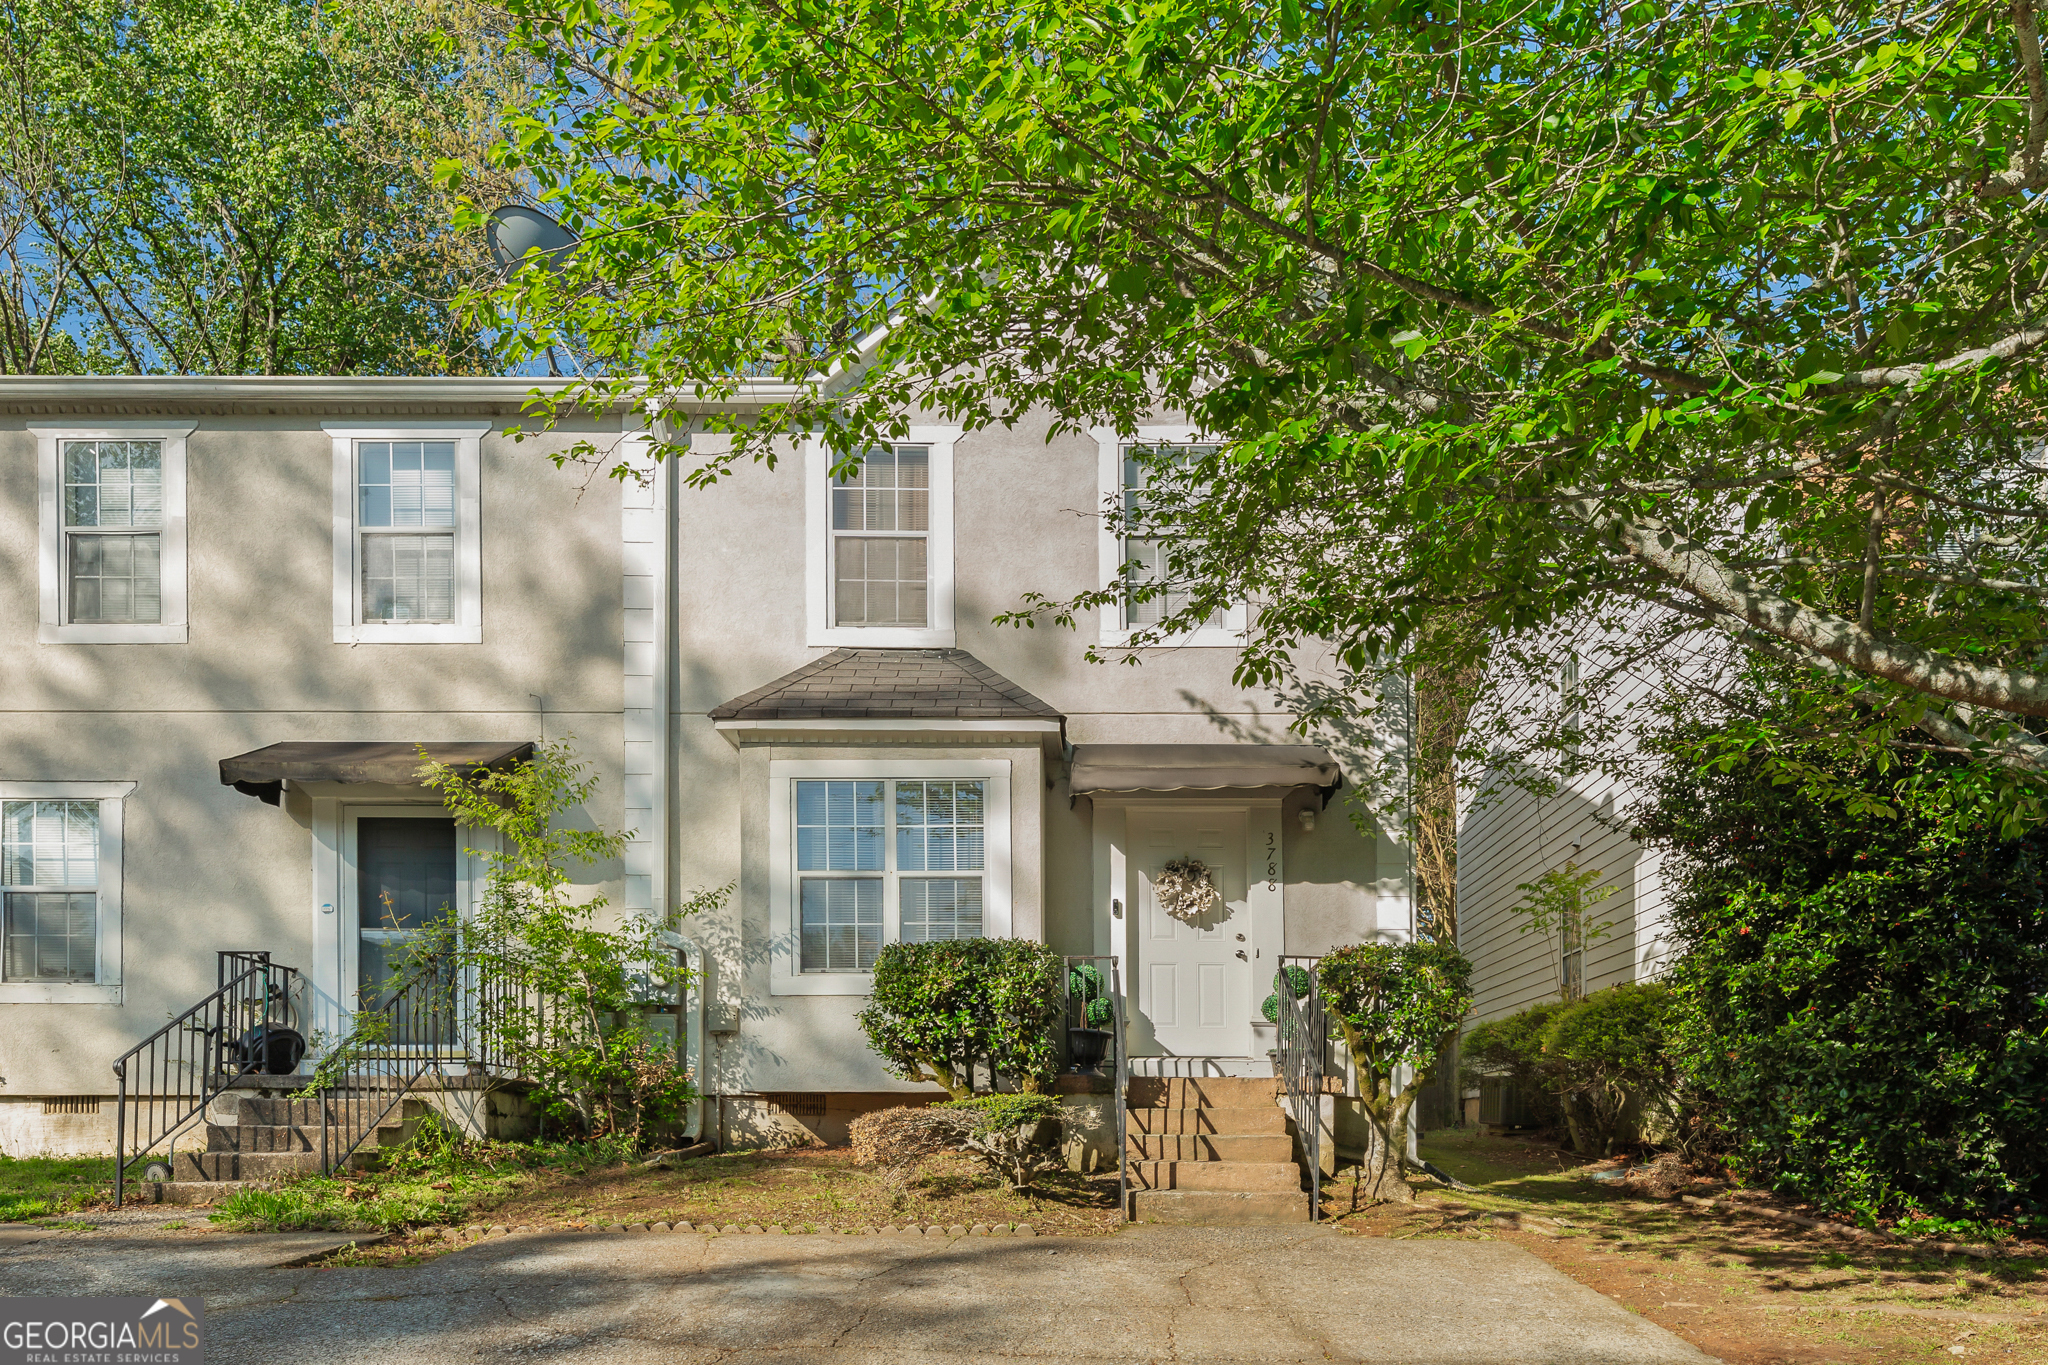
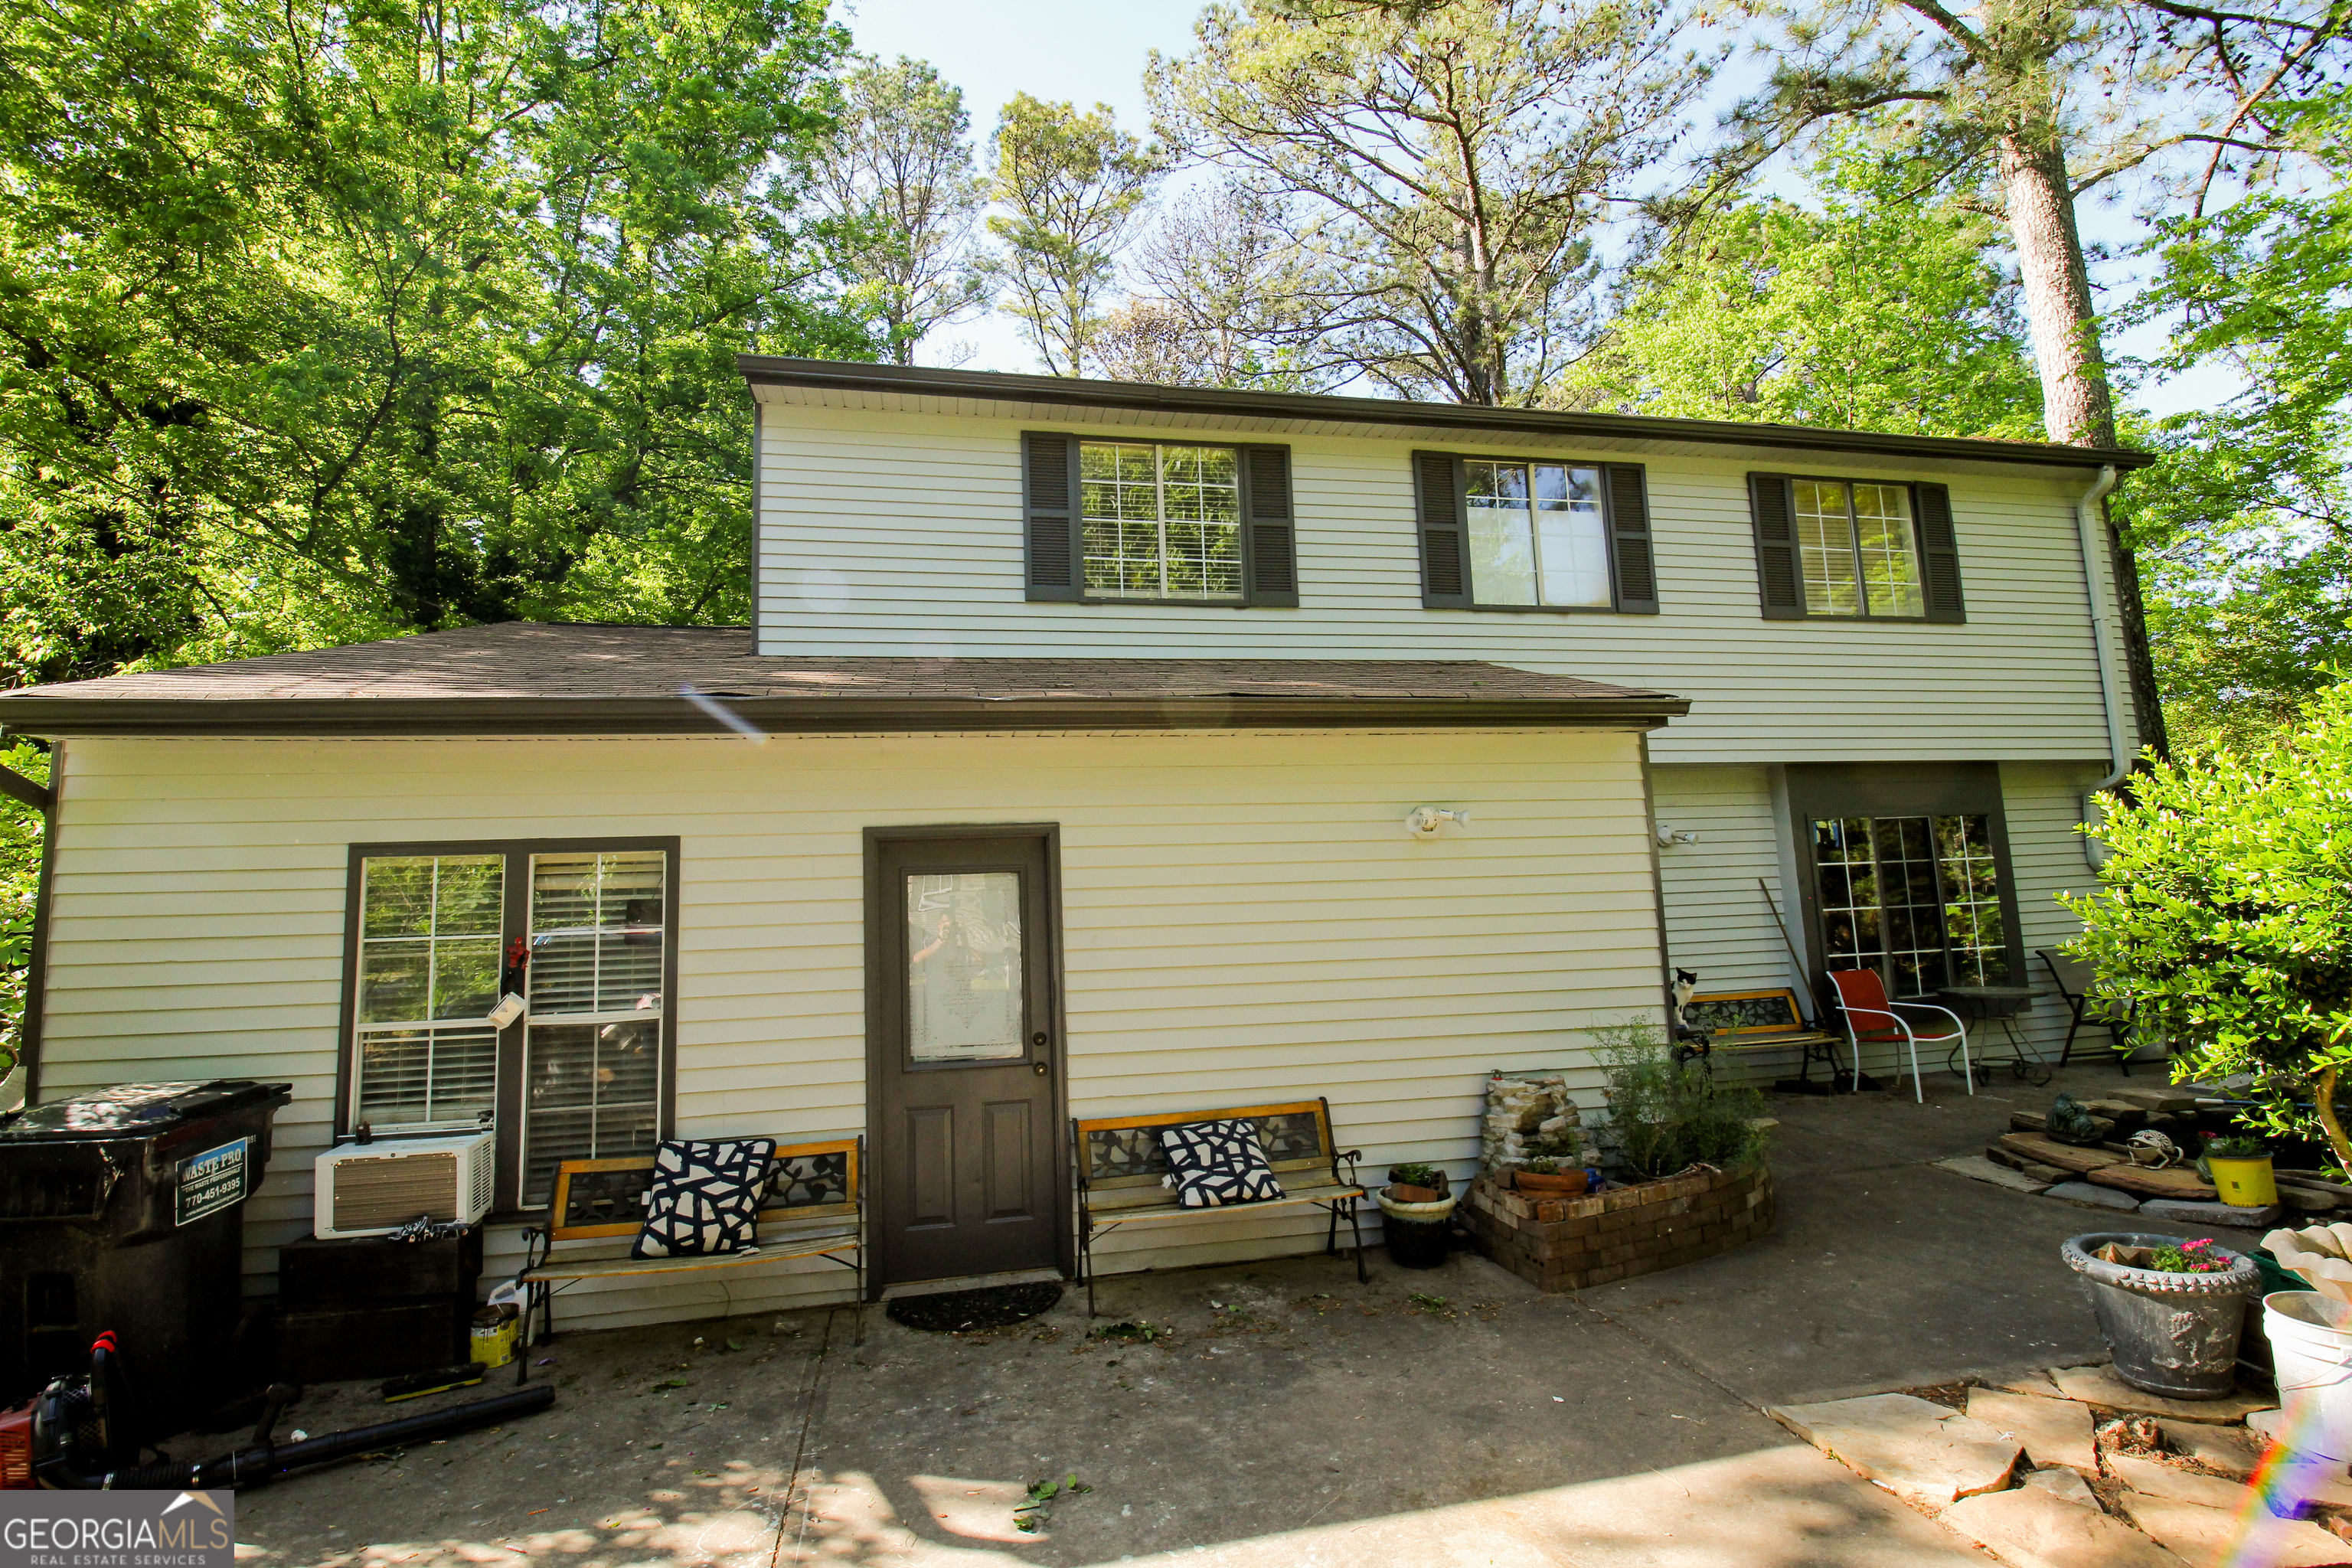
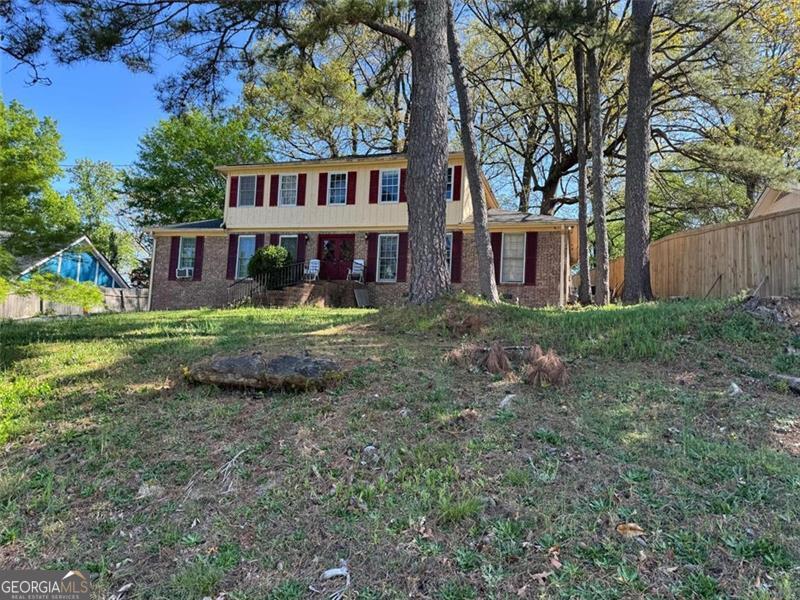
$249,000
2
bds
|
0
ba
|
0
sqft
|
built
1991
3788 Meadow Creek Dr, Norcross, GA 30092
$-247
Cash flow
-5.2%
Cash-on-Cash Return
5.0%
Cap rate
0.8%
Rent to Value Ratio
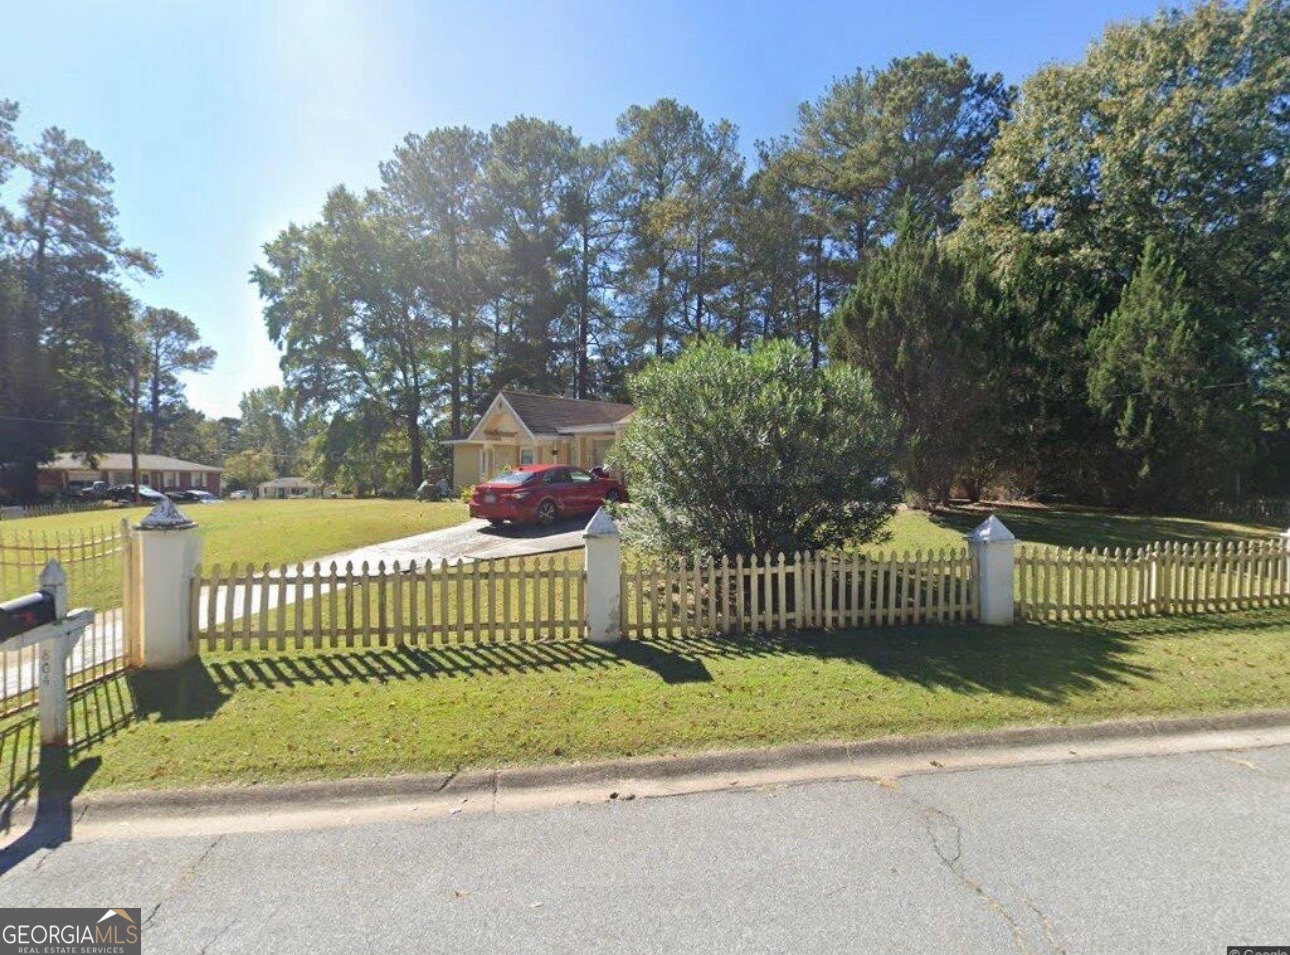
Active
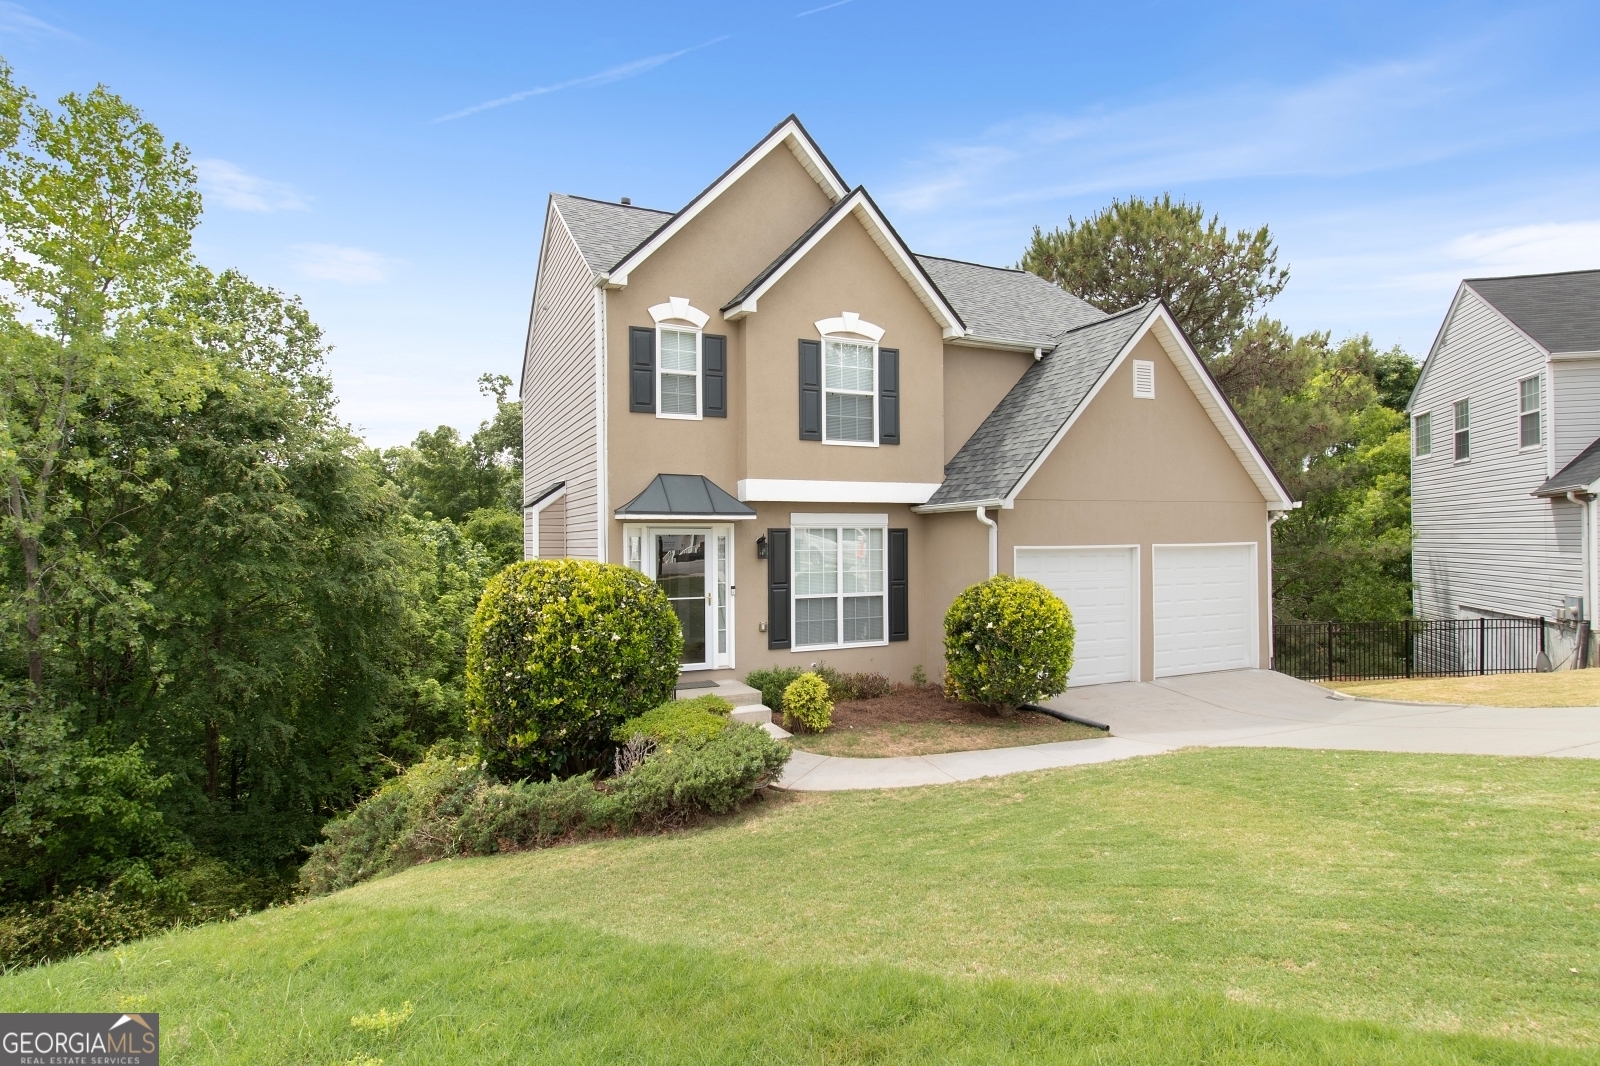
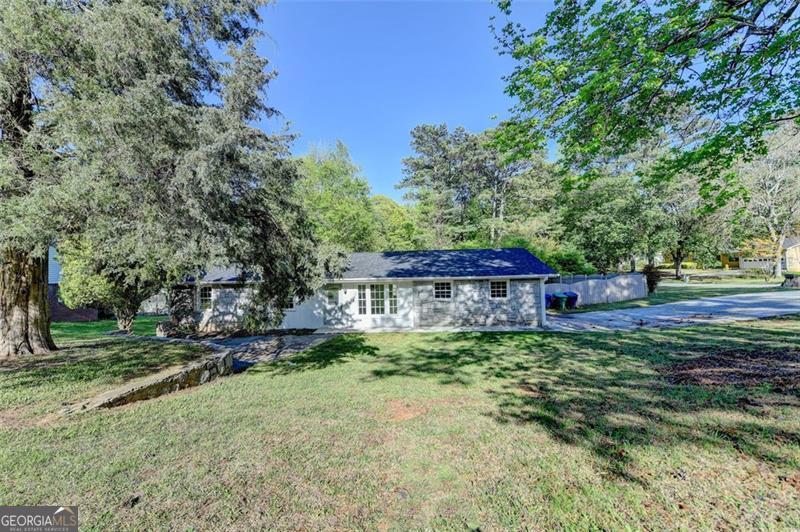
$340,000
4
bds
|
0
ba
|
1,326
sqft
|
built
1967
804 E Glochester Pl, Norcross, GA 30071
$-405
Cash flow
-6.2%
Cash-on-Cash Return
4.7%
Cap rate
0.6%
Rent to Value Ratio
84 out of 86 properties for sale in Norcross, GA
Limited Results Shown
Create a free account, or log in to reveal all property listings and enjoy the complete experience.

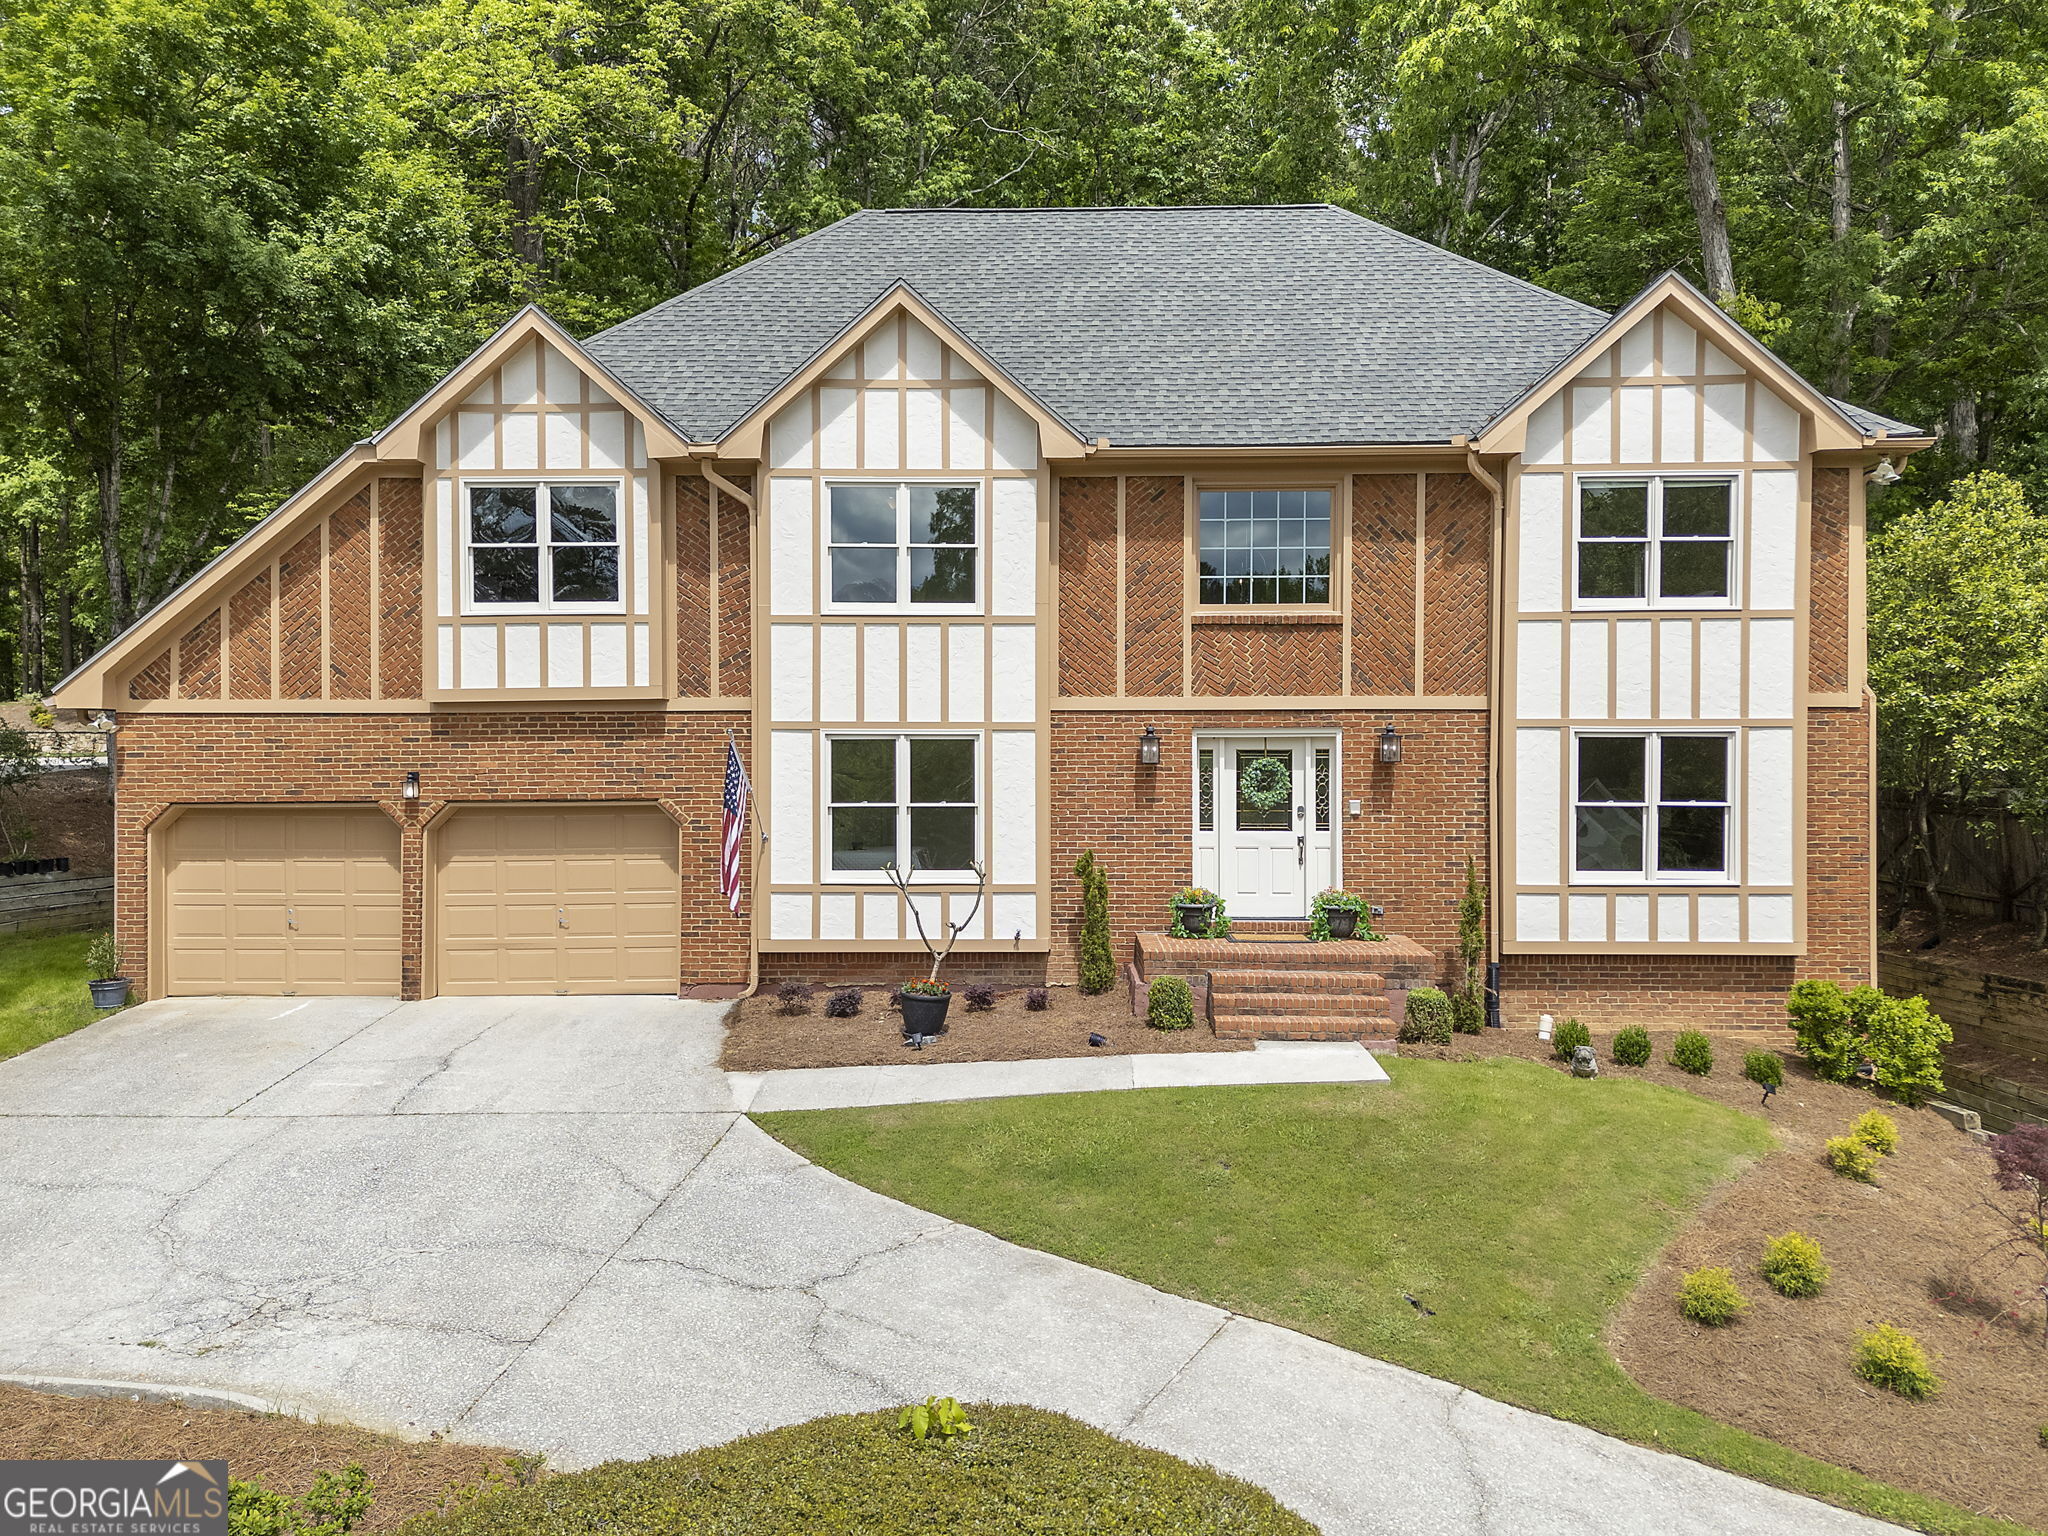
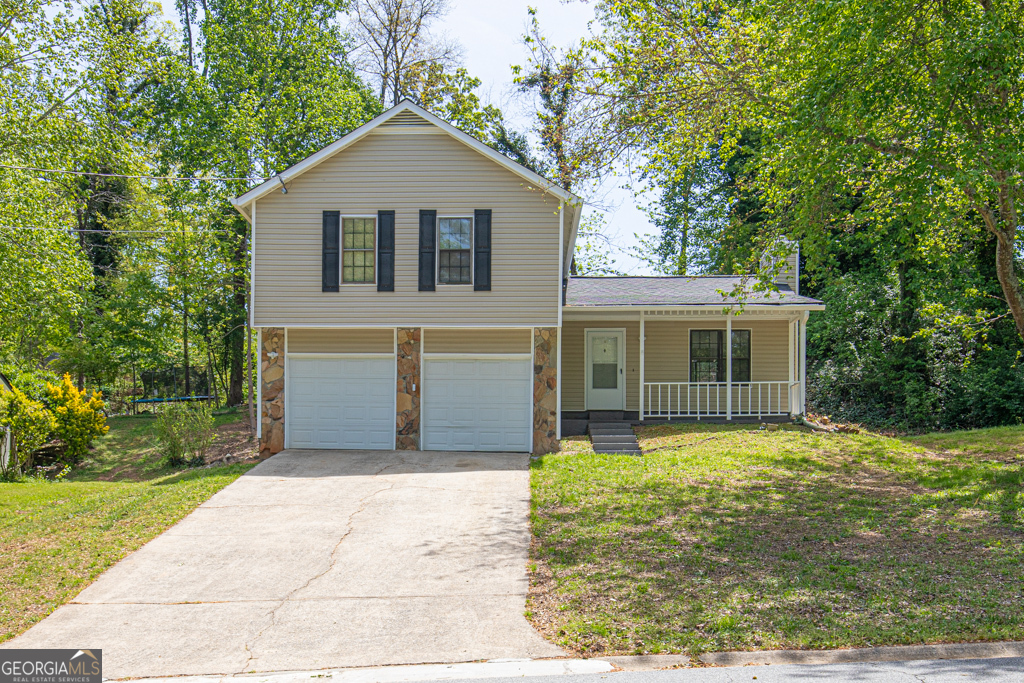
Active
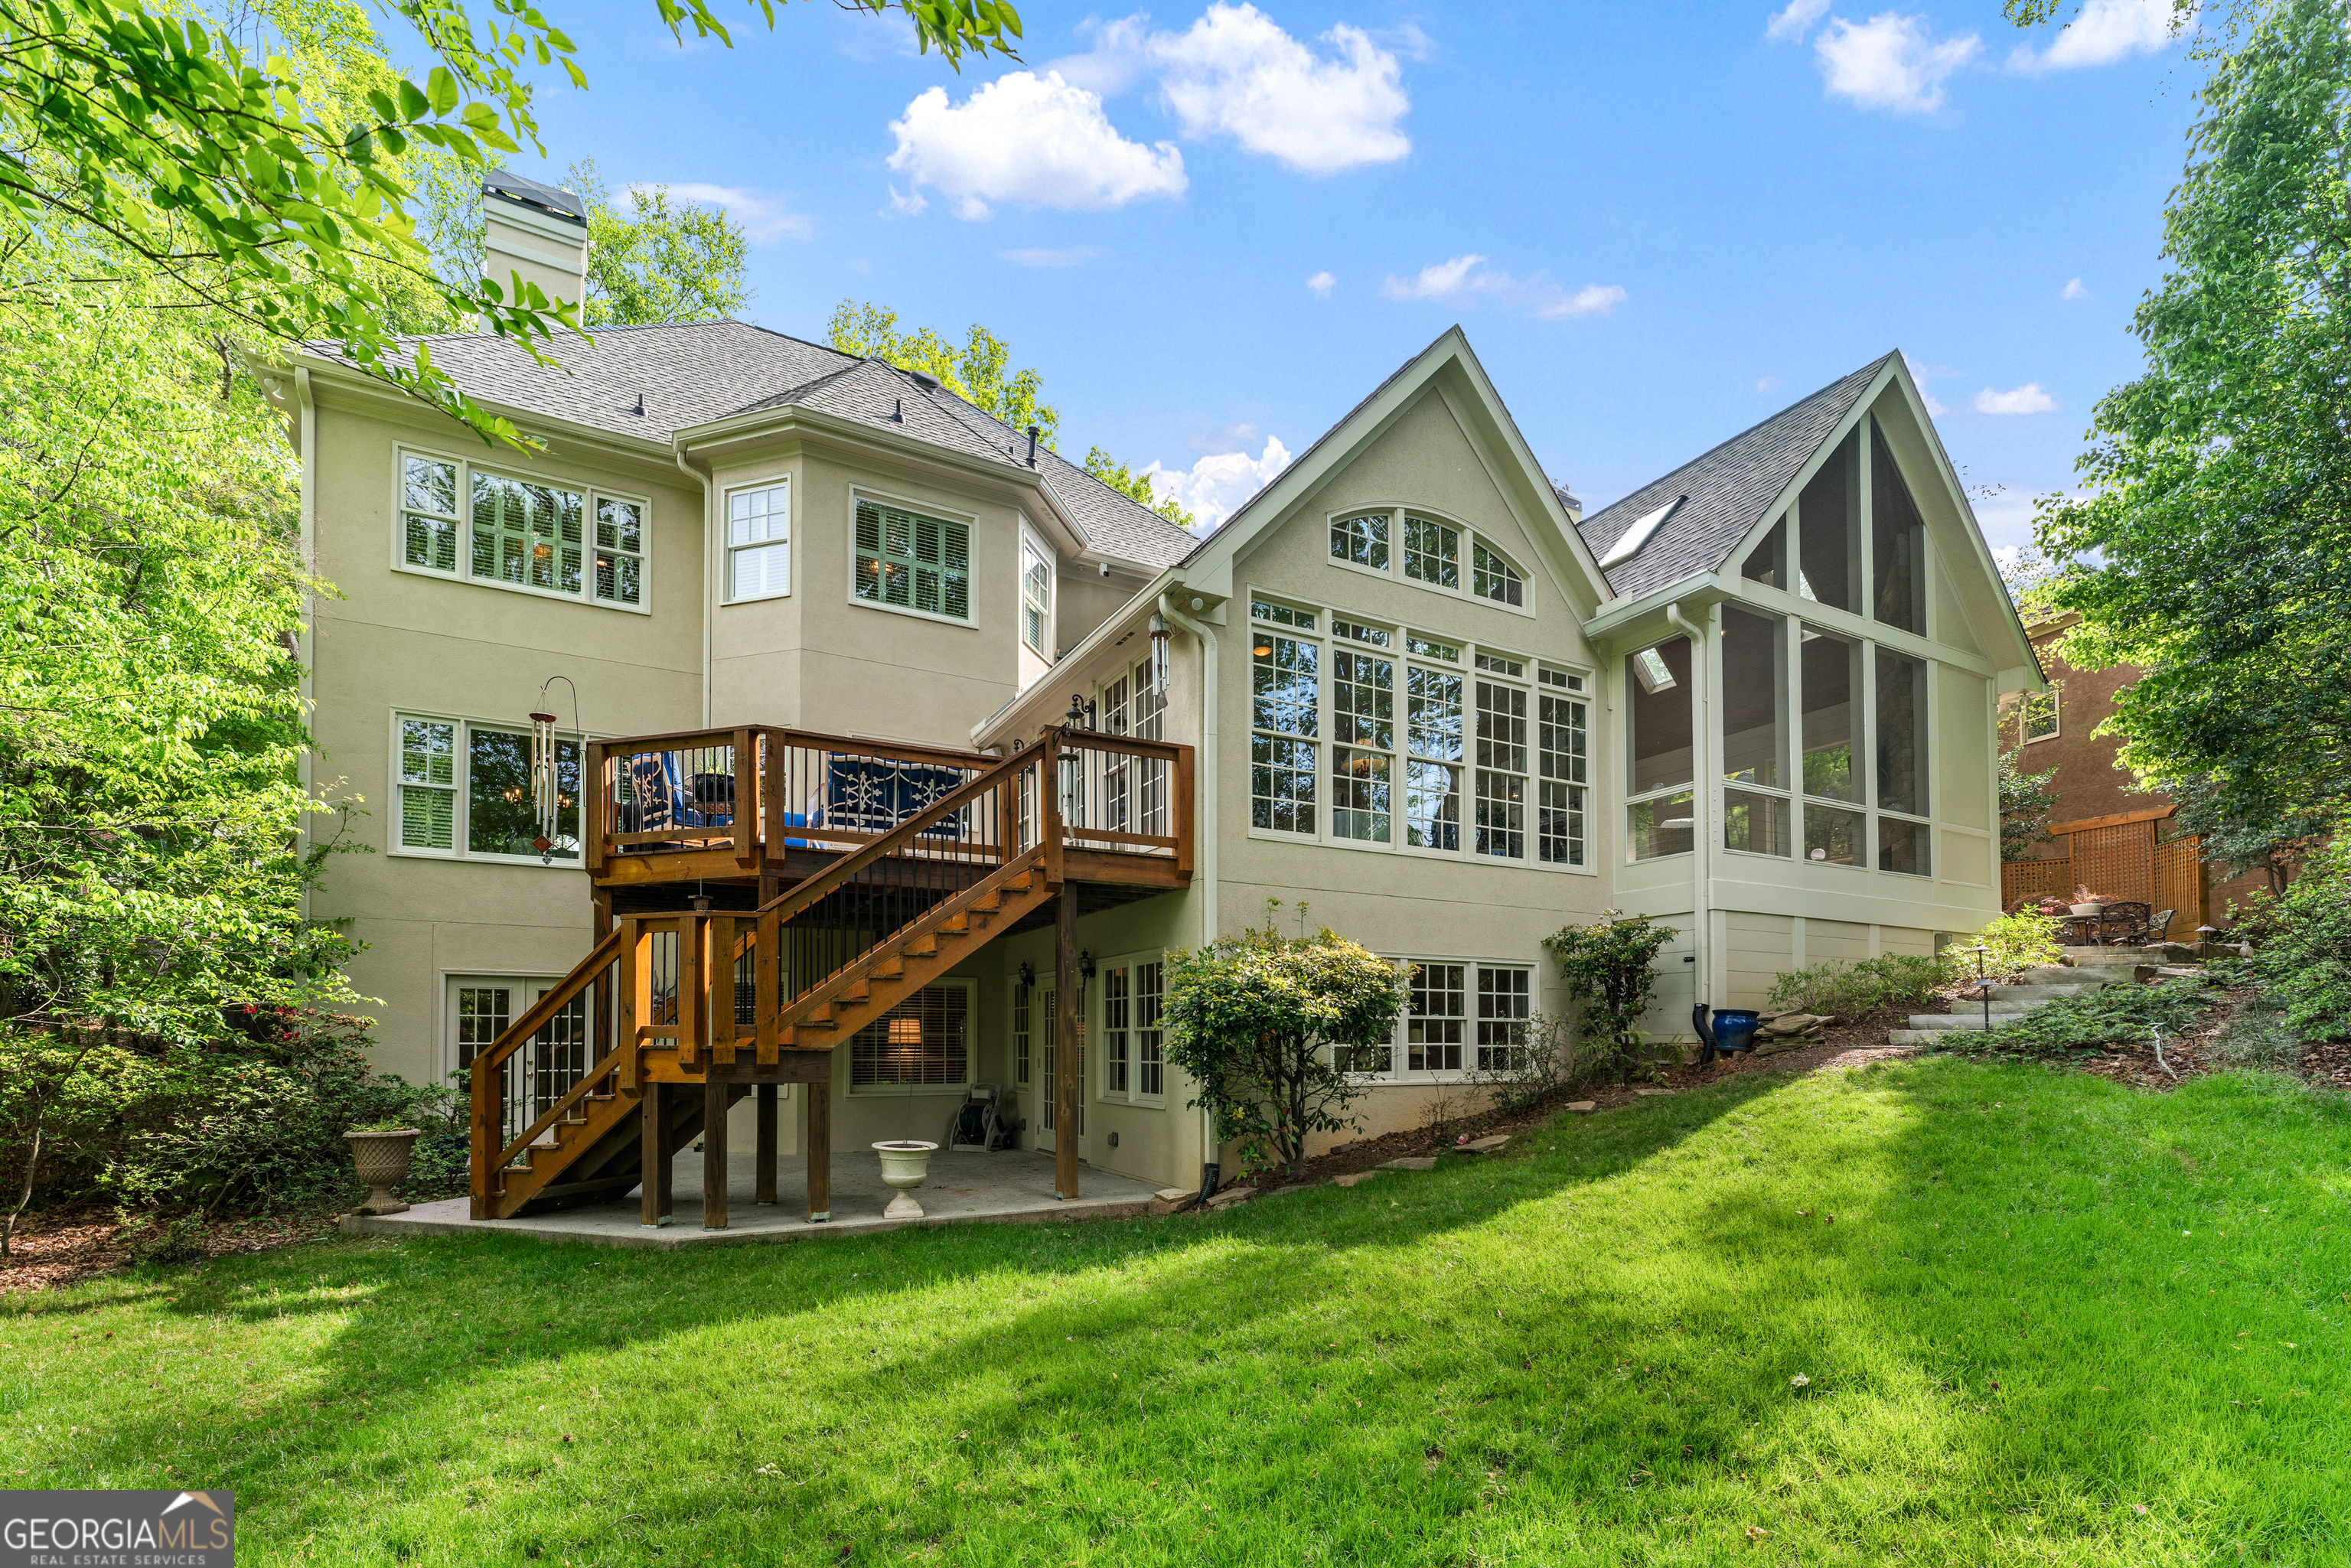
$380,000
2
bds
|
0
ba
|
1,120
sqft
|
built
1949
131 Lively St, Norcross, GA 30071
$-506
Cash flow
-6.9%
Cash-on-Cash Return
4.6%
Cap rate
0.7%
Rent to Value Ratio
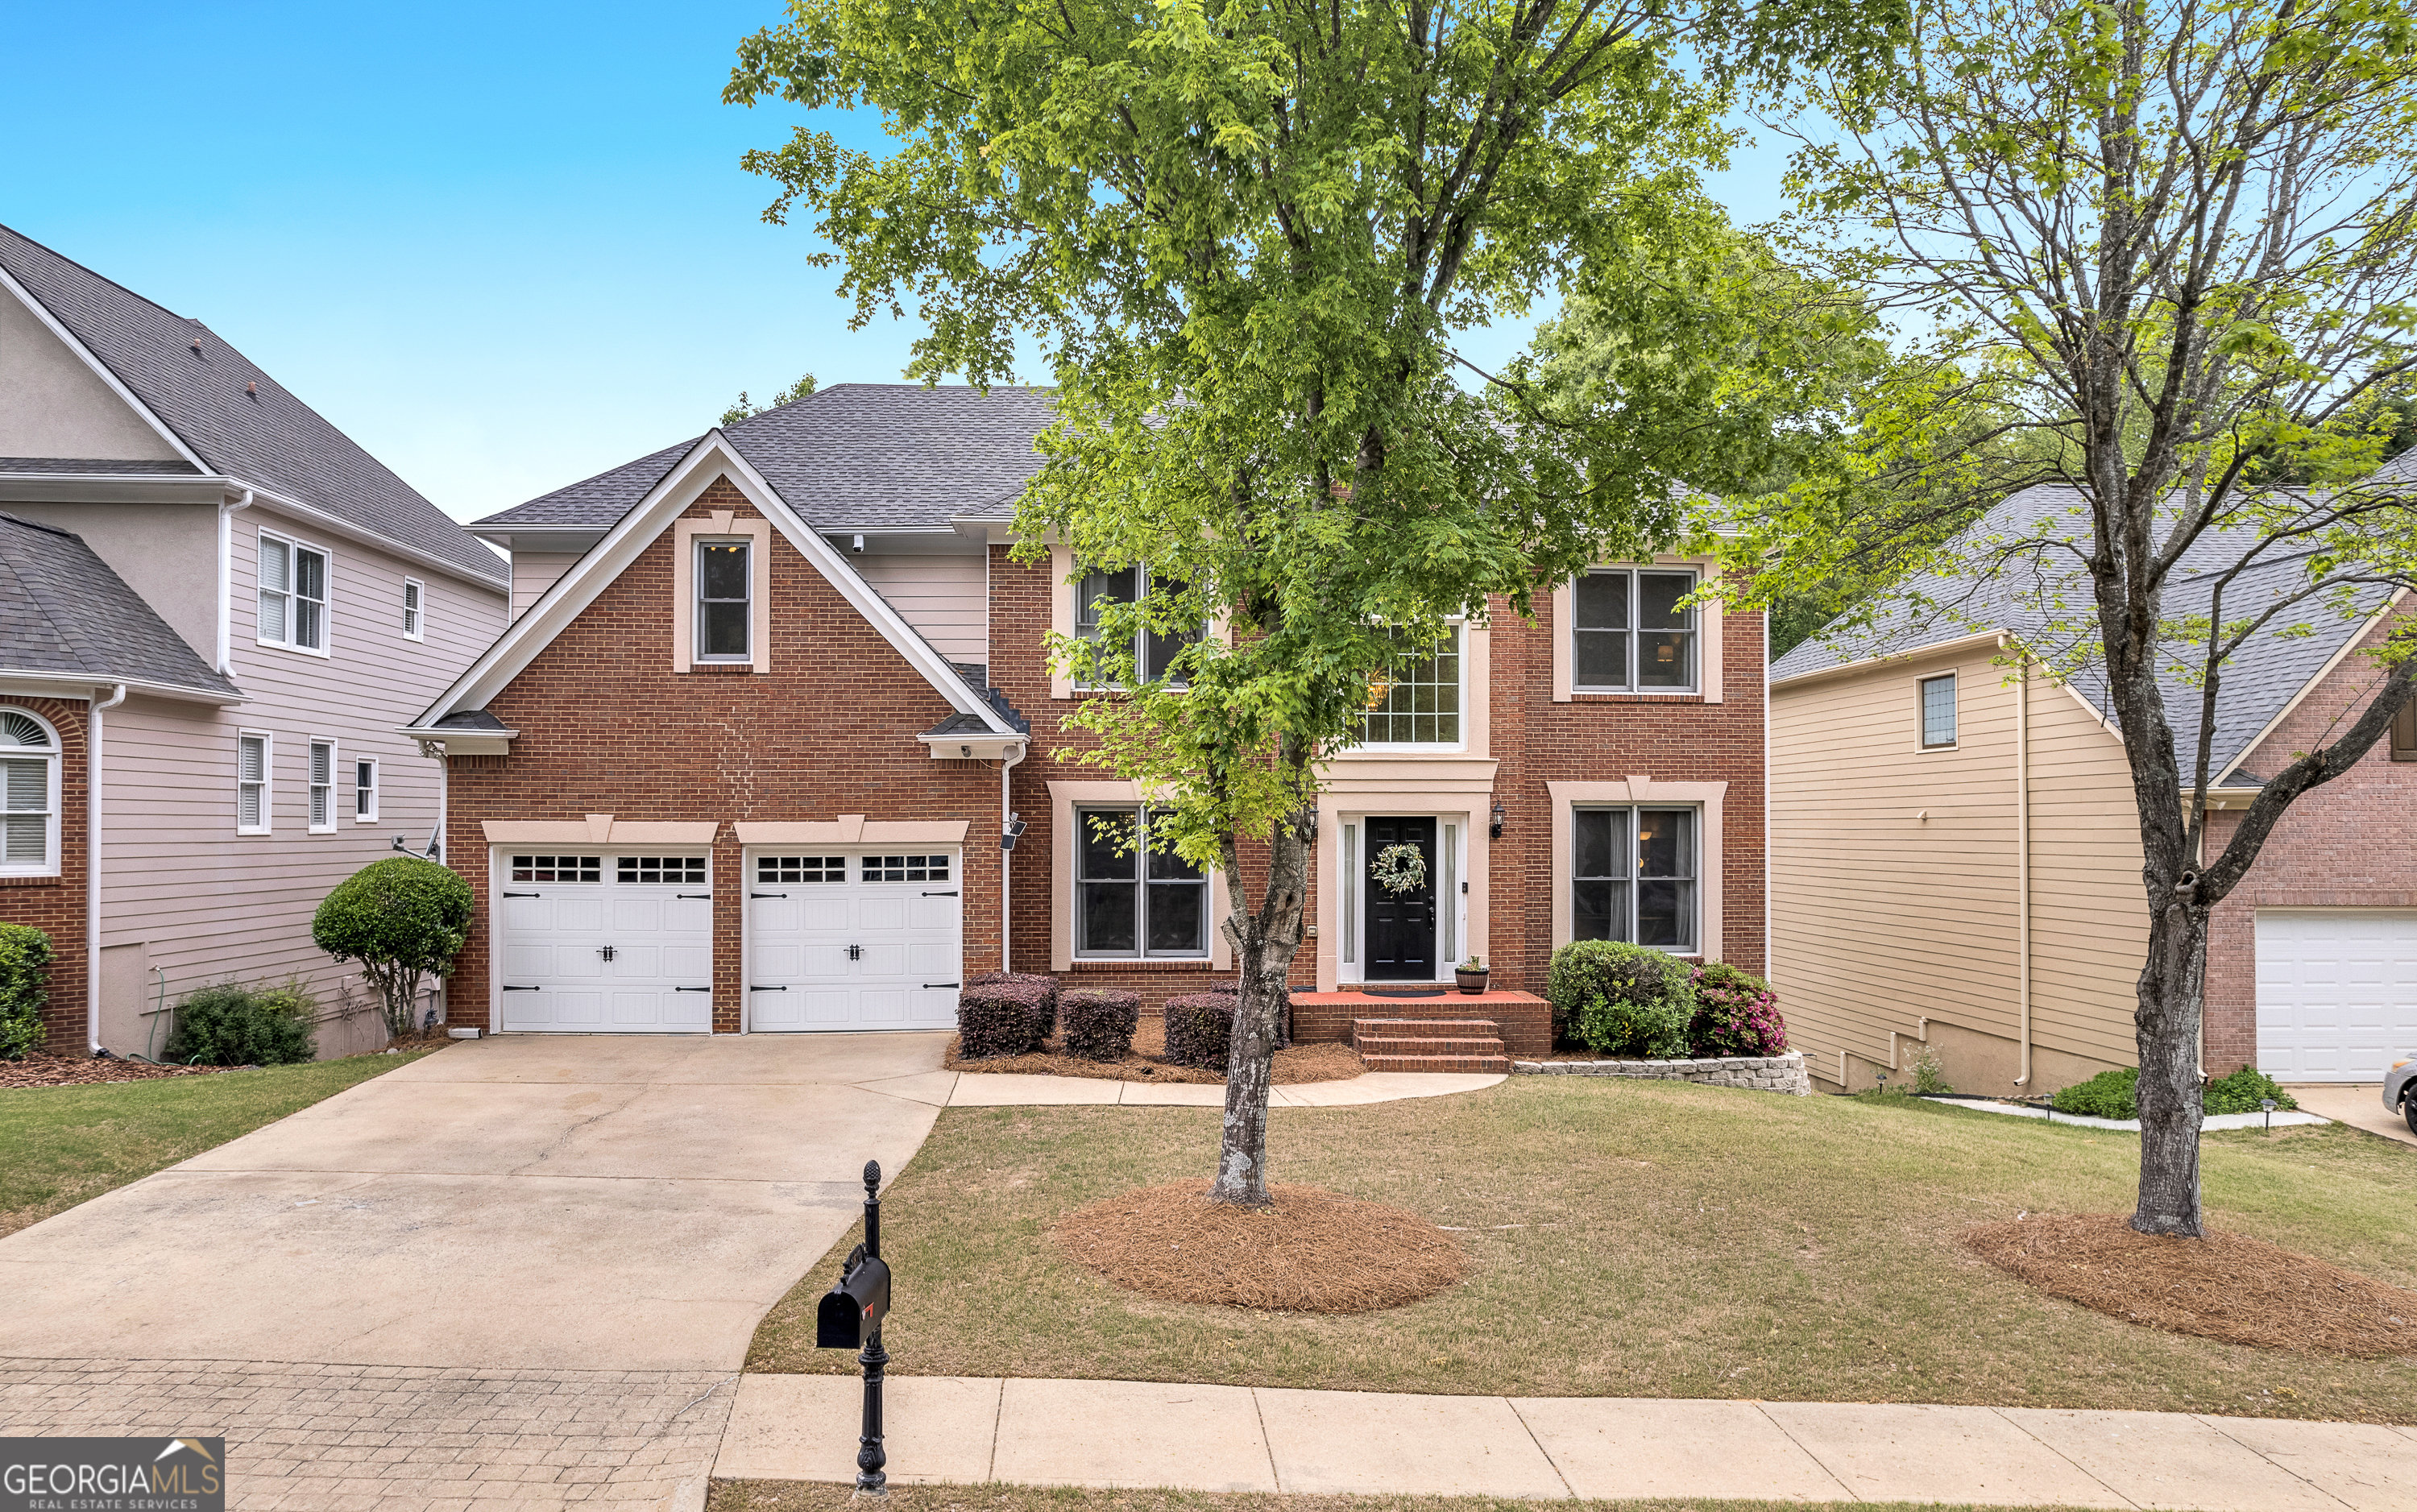
Active
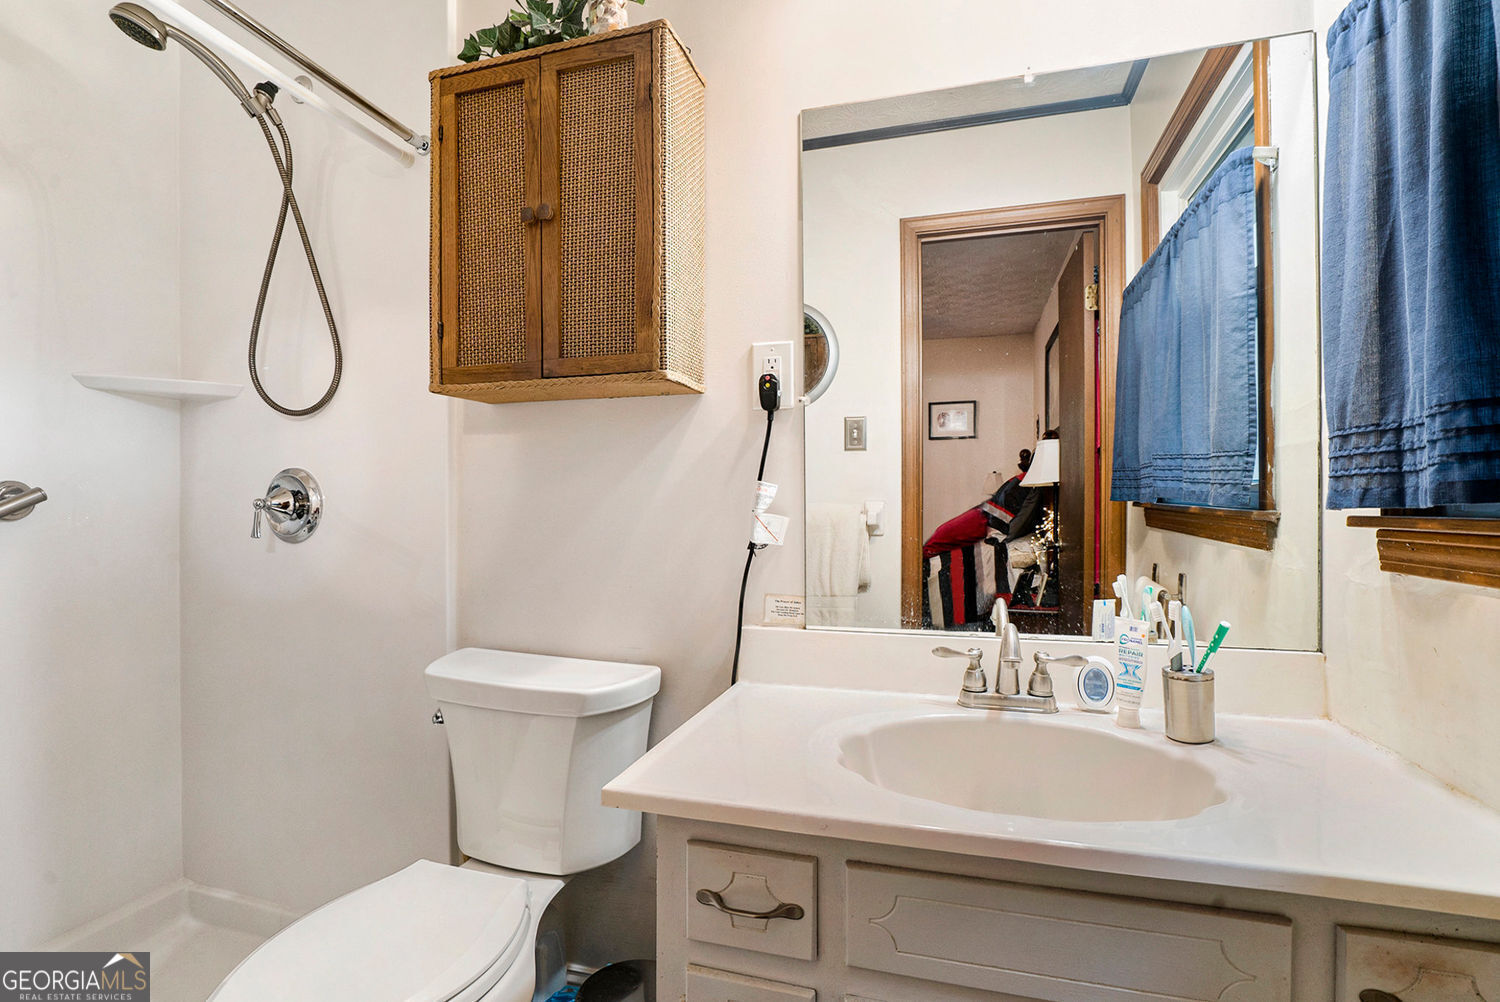
$750,000
5
bds
|
0
ba
|
5,752
sqft
|
built
1990
5830 Wilbanks Dr, Norcross, GA 30092
$-1,374
Cash flow
-9.6%
Cash-on-Cash Return
3.9%
Cap rate
0.5%
Rent to Value Ratio
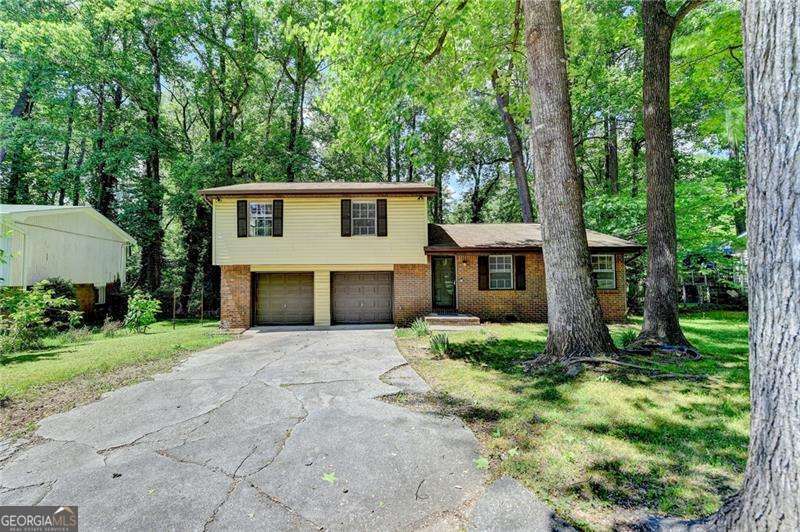
Active
$365,000
3
bds
|
0
ba
|
0
sqft
|
built
1970
6419 Danbury Ln, Norcross, GA 30093
$-711
Cash flow
-10.2%
Cash-on-Cash Return
3.8%
Cap rate
0.6%
Rent to Value Ratio
Active
$849,900
5
bds
|
0
ba
|
3,116
sqft
|
built
2018
435 Webb Dr, Norcross, GA 30071
$-1,336
Cash flow
-8.2%
Cash-on-Cash Return
4.3%
Cap rate
0.6%
Rent to Value Ratio
Active
$779,000
5
bds
|
5
ba
|
0
sqft
|
built
2000
3706 Village Walk Dr, Norcross, GA 30092
$-1,927
Cash flow
-12.9%
Cash-on-Cash Return
3.2%
Cap rate
0.4%
Rent to Value Ratio
Active
$439,000
5
bds
|
0
ba
|
2,850
sqft
|
built
1978
5444 Wylstream, Norcross, GA 30093
$-899
Cash flow
-10.7%
Cash-on-Cash Return
3.7%
Cap rate
0.6%
Rent to Value Ratio

Active
$399,999
4
bds
|
0
ba
|
0
sqft
|
built
1984
4608 Rosemear Ct, Norcross, GA 30093
$-495
Cash flow
-6.5%
Cash-on-Cash Return
4.7%
Cap rate
0.7%
Rent to Value Ratio
Active
$725,000
4
bds
|
0
ba
|
3,170
sqft
|
built
1982
4577 Stilson Cir, Norcross, GA 30092
$-1,871
Cash flow
-13.5%
Cash-on-Cash Return
3.1%
Cap rate
0.5%
Rent to Value Ratio
Active
$360,000
4
bds
|
0
ba
|
0
sqft
|
built
1977
5041 Rockborough Trl, Norcross, GA 30071
$-674
Cash flow
-9.8%
Cash-on-Cash Return
3.9%
Cap rate
0.6%
Rent to Value Ratio

Active
$559,900
4
bds
|
0
ba
|
0
sqft
|
built
1994
3965 Ancroft Cir, Norcross, GA 30092
$-1,317
Cash flow
-12.3%
Cash-on-Cash Return
3.3%
Cap rate
0.6%
Rent to Value Ratio
Active
$425,000
4
bds
|
0
ba
|
1,860
sqft
|
built
1997
7040 Magnolia Park Ln, Norcross, GA 30093
$-898
Cash flow
-11.0%
Cash-on-Cash Return
3.6%
Cap rate
0.5%
Rent to Value Ratio
Active
$379,900
3
bds
|
0
ba
|
0
sqft
|
built
1984
1147 Williamsburg Ln, Norcross, GA 30093
$-777
Cash flow
-10.7%
Cash-on-Cash Return
3.7%
Cap rate
0.6%
Rent to Value Ratio

Active
$435,000
5
bds
|
0
ba
|
2,300
sqft
|
built
1972
1563 Greenwood Dr, Norcross, GA 30093
$-995
Cash flow
-11.9%
Cash-on-Cash Return
3.4%
Cap rate
0.5%
Rent to Value Ratio

Active
$875,000
4
bds
|
0
ba
|
4,400
sqft
|
built
1984
4614 Capers Xing W, Norcross, GA 30092
$-2,777
Cash flow
-16.6%
Cash-on-Cash Return
2.3%
Cap rate
0.4%
Rent to Value Ratio

Active
$335,000
3
bds
|
0
ba
|
1,408
sqft
|
built
1981
1030 Brockdell Ct, Norcross, GA 30093
$-697
Cash flow
-10.9%
Cash-on-Cash Return
3.7%
Cap rate
0.6%
Rent to Value Ratio
Active
$650,000
6
bds
|
0
ba
|
3,772
sqft
|
built
1999
2810 Olde Town Park Dr, Norcross, GA 30071
$-1,653
Cash flow
-13.3%
Cash-on-Cash Return
3.1%
Cap rate
0.5%
Rent to Value Ratio

Active
$560,000
5
bds
|
0
ba
|
3,134
sqft
|
built
1979
3757 Peachtree Corners Cir, Norcross, GA 30092
$-1,429
Cash flow
-13.3%
Cash-on-Cash Return
3.1%
Cap rate
0.5%
Rent to Value Ratio

Active
$900,000
5
bds
|
0
ba
|
0
sqft
|
built
1986
6040 Neely Farm Dr, Norcross, GA 30092
$-2,941
Cash flow
-17.0%
Cash-on-Cash Return
2.2%
Cap rate
0.4%
Rent to Value Ratio

Active
$350,000
3
bds
|
0
ba
|
0
sqft
|
built
1968
4416 Arcadia Dr, Norcross, GA 30093
$-733
Cash flow
-10.9%
Cash-on-Cash Return
3.6%
Cap rate
0.6%
Rent to Value Ratio

Active
$399,999
3
bds
|
0
ba
|
0
sqft
|
built
1970
724 Camelot Way, Norcross, GA 30071
$-866
Cash flow
-11.3%
Cash-on-Cash Return
3.5%
Cap rate
0.6%
Rent to Value Ratio
Active
$249,000
2
bds
|
0
ba
|
0
sqft
|
built
1991
3788 Meadow Creek Dr, Norcross, GA 30092
$-247
Cash flow
-5.2%
Cash-on-Cash Return
5.0%
Cap rate
0.8%
Rent to Value Ratio

Active
$374,900
3
bds
|
0
ba
|
0
sqft
|
built
1978
1462 Country Downs Dr, Norcross, GA 30093
$-815
Cash flow
-11.3%
Cash-on-Cash Return
3.5%
Cap rate
0.6%
Rent to Value Ratio
Active
$320,000
4
bds
|
0
ba
|
2,058
sqft
|
built
1973
1174 Pirkle Rd, Norcross, GA 30093
$-419
Cash flow
-6.8%
Cash-on-Cash Return
4.6%
Cap rate
0.7%
Rent to Value Ratio
Active
$395,000
4
bds
|
0
ba
|
0
sqft
|
built
1971
952 Star Ct, Norcross, GA 30093
$-1,010
Cash flow
-13.3%
Cash-on-Cash Return
3.1%
Cap rate
0.5%
Rent to Value Ratio
Active
$1,125,000
6
bds
|
0
ba
|
5,833
sqft
|
built
1989
6140 Rachel Rdg, Norcross, GA 30092
$-3,367
Cash flow
-15.6%
Cash-on-Cash Return
2.6%
Cap rate
0.3%
Rent to Value Ratio
Active
$379,000
3
bds
|
0
ba
|
3,114
sqft
|
built
1976
1292 Marcelle Heights Pl, Norcross, GA 30093
$-723
Cash flow
-10.0%
Cash-on-Cash Return
3.9%
Cap rate
0.6%
Rent to Value Ratio
Active
$320,000
3
bds
|
0
ba
|
9,894
sqft
|
built
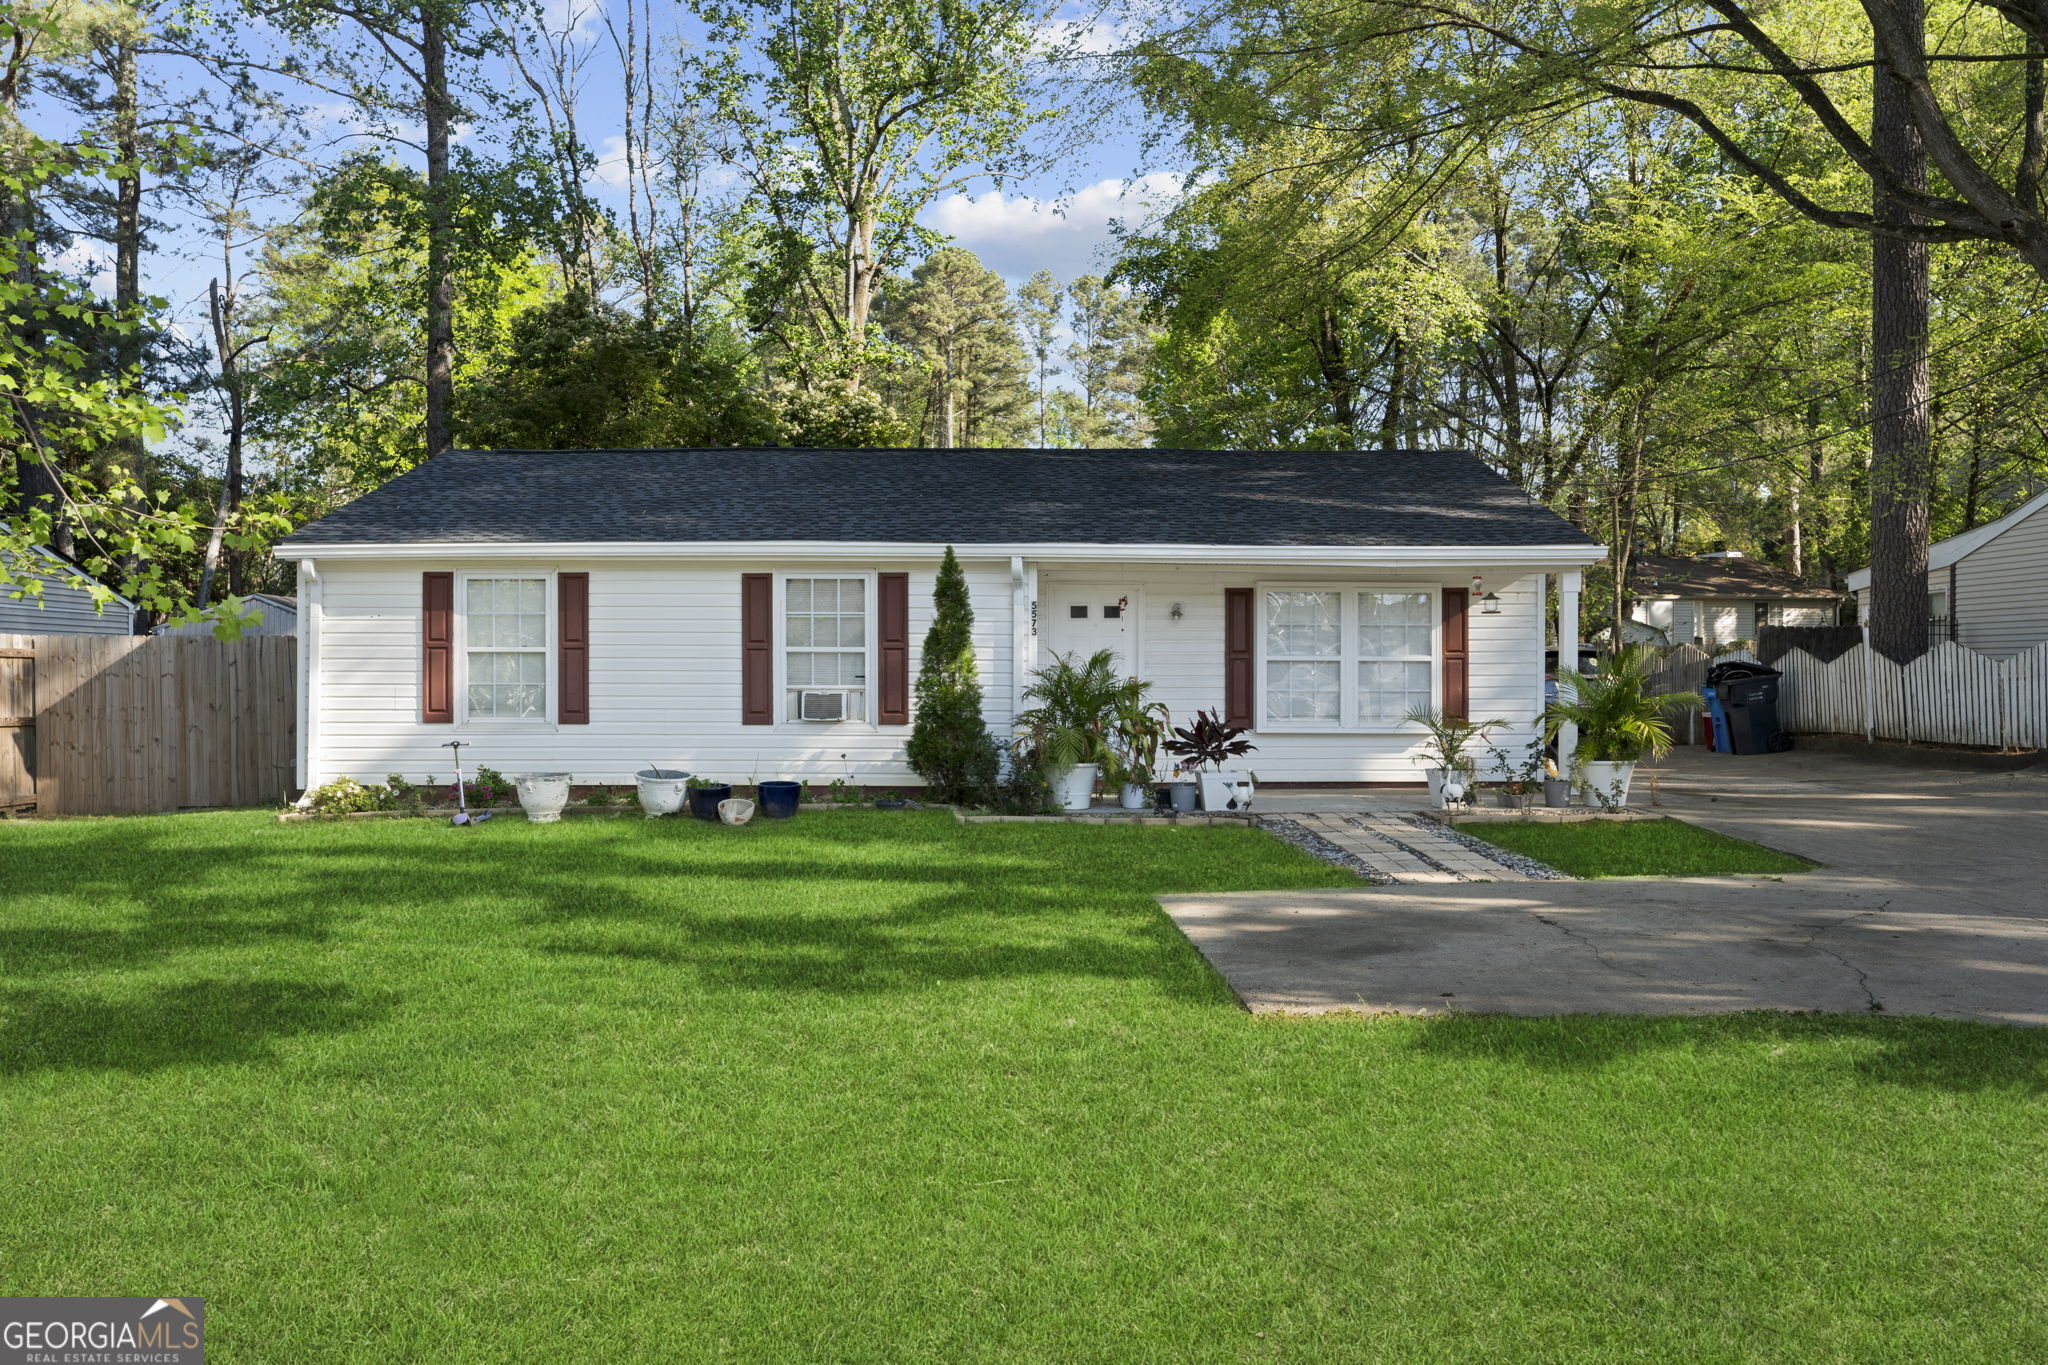
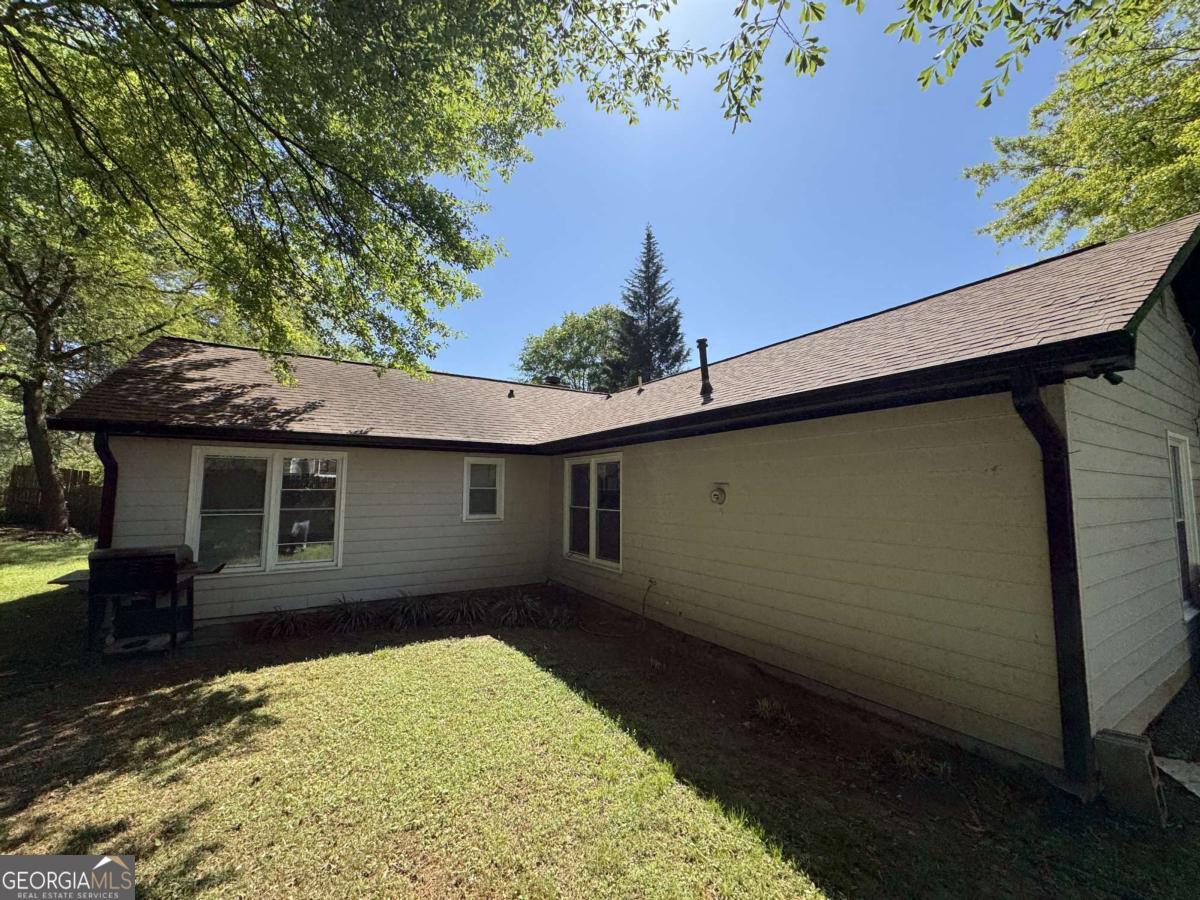
1982
5573 Singleton Rd, Norcross, GA 30093
$-511
Cash flow
-8.3%
Cash-on-Cash Return
4.2%
Cap rate
0.6%
Rent to Value Ratio
Active
$369,999
4
bds
|
0
ba
|
1,189
sqft
|
built
1984
5516 Westberry Ln, Norcross, GA 30071
$-862
Cash flow
-12.2%
Cash-on-Cash Return
3.4%
Cap rate
0.5%
Rent to Value Ratio
Active
$1,275,000
4
bds
|
0
ba
|
4,458
sqft
|
built
1988
4341 Quail Ridge Way, Norcross, GA 30092
$-579
Cash flow
-2.4%
Cash-on-Cash Return
5.6%
Cap rate
0.8%
Rent to Value Ratio
Active
$1,250,000
4
bds
|
0
ba
|
5,462
sqft
|
built
1990
6201 Neely Farm Dr, Norcross, GA 30092
$-2,476
Cash flow
-10.3%
Cash-on-Cash Return
3.8%
Cap rate
0.6%
Rent to Value Ratio
Active
$319,900
3
bds
|
2
ba
|
0
sqft
|
built
1984
4247 Windward Ln, Norcross, GA 30093
$-483
Cash flow
-7.9%
Cash-on-Cash Return
4.3%
Cap rate
0.6%
Rent to Value Ratio
Active
$599,900
4
bds
|
0
ba
|
2,323
sqft
|
built
1984
746 Oak Ter, Norcross, GA 30071
$-1,406
Cash flow
-12.2%
Cash-on-Cash Return
3.3%
Cap rate
0.4%
Rent to Value Ratio
Active
$379,900
4
bds
|
0
ba
|
1,520
sqft
|
built
1984
2199 Summertown Dr, Norcross, GA 30071
$-857
Cash flow
-11.8%
Cash-on-Cash Return
3.4%
Cap rate
0.5%
Rent to Value Ratio
Active
$839,900
6
bds
|
0
ba
|
5,162
sqft
|
built
2015
5930 Brundage Ln, Norcross, GA 30071
$-1,850
Cash flow
-11.5%
Cash-on-Cash Return
3.5%
Cap rate
0.5%
Rent to Value Ratio
Active
$439,900
4
bds
|
0
ba
|
2,340
sqft
|
built
1966
1743 Jennings Way, Norcross, GA 30093
$-976
Cash flow
-11.6%
Cash-on-Cash Return
3.5%
Cap rate
0.6%
Rent to Value Ratio
Active
$340,000
4
bds
|
0
ba
|
1,326
sqft
|
built
1967
804 E Glochester Pl, Norcross, GA 30071
$-405
Cash flow
-6.2%
Cash-on-Cash Return
4.7%
Cap rate
0.6%
Rent to Value Ratio
Active
$405,000
4
bds
|
0
ba
|
0
sqft
|
built
1987
1922 Marshes Glenn Dr, Norcross, GA 30071
$-602
Cash flow
-7.8%
Cash-on-Cash Return
4.4%
Cap rate
0.6%
Rent to Value Ratio
Active
$365,000
4
bds
|
0
ba
|
2,000
sqft
|
built
1977
1291 Marcelle Heights Pl, Norcross, GA 30093
$-502
Cash flow
-7.2%
Cash-on-Cash Return
4.5%
Cap rate
0.7%
Rent to Value Ratio
Active
$870,450
6
bds
|
0
ba
|
6,000
sqft
|
built
1997
5501 Edgerton Dr, Norcross, GA 30092
$-2,888
Cash flow
-17.3%
Cash-on-Cash Return
2.2%
Cap rate
0.4%
Rent to Value Ratio
Active
$449,999
5
bds
|
0
ba
|
0
sqft
|
built
1994
6922 Magnolia Park Dr, Norcross, GA 30093
$-649
Cash flow
-7.5%
Cash-on-Cash Return
4.4%
Cap rate
0.6%
Rent to Value Ratio