North Las Vegas, NV Investment Properties for Sale
Browse homes for sale and investment properties in North Las Vegas, NV. Refine your search by price, property type, or more.
Best cash flowing properties in North Las Vegas, NV

Active
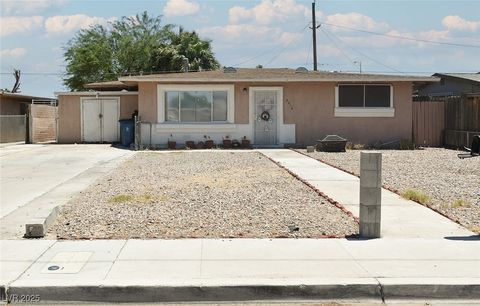
$210,000
2
bds
|
2
ba
|
968
sqft
|
built
1999
1881 W Alexander Rd, North Las Vegas, NV 89032
$-323
Cash flow
-8.0%
Cash-on-Cash Return
4.4%
Cap rate
0.8%
Rent to Value Ratio

Active
$340,000
3
bds
|
2
ba
|
1,789
sqft
|
built
1964
408 Rossmoyne Ave, North Las Vegas, NV 89030
$-433
Cash flow
-6.6%
Cash-on-Cash Return
4.7%
Cap rate
0.6%
Rent to Value Ratio
660 out of 679 properties for sale in North Las Vegas, NV
Limited Results Shown
Create a free account, or log in to reveal all property listings and enjoy the complete experience.

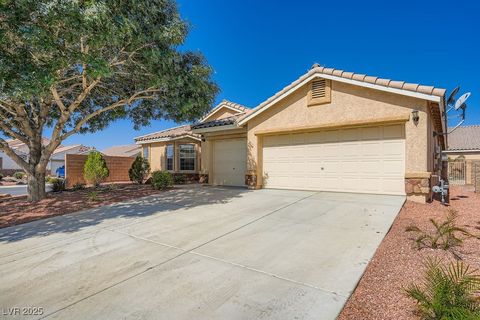
Active
$574,900
3
bds
|
3
ba
|
2,942
sqft
|
built
2022
4630 Summer Azure St, North Las Vegas, NV 89031
$-1,764
Cash flow
-16.0%
Cash-on-Cash Return
2.6%
Cap rate
0.4%
Rent to Value Ratio
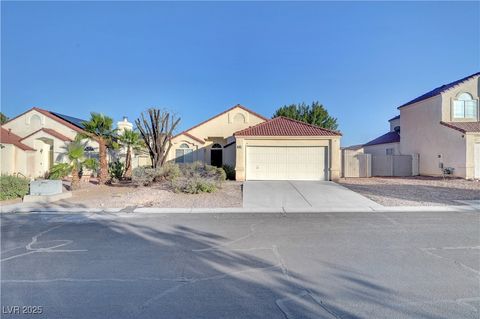
Active
$484,900
4
bds
|
3
ba
|
2,102
sqft
|
built
2005
1212 E Rome Blvd, North Las Vegas, NV 89086
$-1,130
Cash flow
-12.2%
Cash-on-Cash Return
3.5%
Cap rate
0.5%
Rent to Value Ratio
Active
$210,000
2
bds
|
2
ba
|
968
sqft
|
built
1999
1881 W Alexander Rd, North Las Vegas, NV 89032
$-323
Cash flow
-8.0%
Cash-on-Cash Return
4.4%
Cap rate
0.8%
Rent to Value Ratio
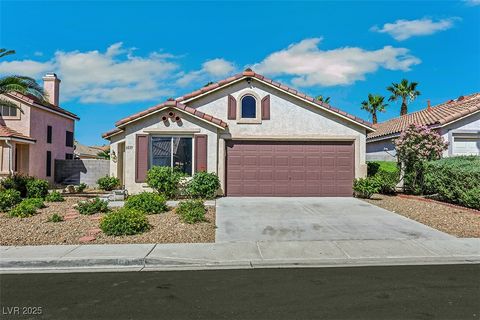
Active
$360,000
3
bds
|
2
ba
|
1,373
sqft
|
built
2021
6819 Sage Gold Ct, North Las Vegas, NV 89086
$-1,116
Cash flow
-16.2%
Cash-on-Cash Return
2.5%
Cap rate
0.5%
Rent to Value Ratio

Active
$446,000
4
bds
|
3
ba
|
2,128
sqft
|
built
2015
1413 Miller Ridge Ave, North Las Vegas, NV 89031
$-1,200
Cash flow
-14.0%
Cash-on-Cash Return
3.0%
Cap rate
0.5%
Rent to Value Ratio
Active
$415,000
3
bds
|
2
ba
|
1,458
sqft
|
built
2001
1106 Emerald Stone Ave, North Las Vegas, NV 89081
$-1,075
Cash flow
-13.5%
Cash-on-Cash Return
3.2%
Cap rate
0.4%
Rent to Value Ratio

Active
$398,000
3
bds
|
2
ba
|
1,501
sqft
|
built
2000
635 Dry Valley Ave, North Las Vegas, NV 89031
$-977
Cash flow
-12.8%
Cash-on-Cash Return
3.3%
Cap rate
0.5%
Rent to Value Ratio

Active
$380,000
3
bds
|
3
ba
|
1,665
sqft
|
built
2023
2901 Bahama Yellow Ave, North Las Vegas, NV 89086
$-1,087
Cash flow
-14.9%
Cash-on-Cash Return
2.8%
Cap rate
0.5%
Rent to Value Ratio

Active
$674,900
5
bds
|
4
ba
|
3,790
sqft
|
built
2005
3217 Palladio Ave, North Las Vegas, NV 89031
$-1,660
Cash flow
-12.8%
Cash-on-Cash Return
3.3%
Cap rate
0.5%
Rent to Value Ratio
Active
$449,900
3
bds
|
2
ba
|
1,846
sqft
|
built
2005
6032 Red Glitter St, North Las Vegas, NV 89031
$-1,051
Cash flow
-12.2%
Cash-on-Cash Return
3.5%
Cap rate
0.5%
Rent to Value Ratio
Active
$535,000
4
bds
|
3
ba
|
2,017
sqft
|
built
2007
6009 Arbor Crest St, North Las Vegas, NV 89081
$-1,355
Cash flow
-13.2%
Cash-on-Cash Return
3.2%
Cap rate
0.5%
Rent to Value Ratio
Active
$445,000
4
bds
|
3
ba
|
2,119
sqft
|
built
2021
4641 Fragrant St, North Las Vegas, NV 89031
$-1,336
Cash flow
-15.7%
Cash-on-Cash Return
2.7%
Cap rate
0.4%
Rent to Value Ratio
Active
$493,000
4
bds
|
3
ba
|
2,361
sqft
|
built
2006
1504 Andrew David Ave, North Las Vegas, NV 89086
$-1,250
Cash flow
-13.2%
Cash-on-Cash Return
3.2%
Cap rate
0.5%
Rent to Value Ratio
Active
$430,000
4
bds
|
2
ba
|
1,560
sqft
|
built
2000
3109 W Colton Ave, North Las Vegas, NV 89032
$-985
Cash flow
-12.0%
Cash-on-Cash Return
3.5%
Cap rate
0.5%
Rent to Value Ratio
Active
$299,990
3
bds
|
1
ba
|
1,016
sqft
|
built
1954
2616 Spear St, North Las Vegas, NV 89030
$-497
Cash flow
-8.6%
Cash-on-Cash Return
4.3%
Cap rate
0.5%
Rent to Value Ratio
Active
$520,000
4
bds
|
2
ba
|
2,164
sqft
|
built
2009
5817 Pirate Ship Dr, North Las Vegas, NV 89031
$-1,284
Cash flow
-12.9%
Cash-on-Cash Return
3.3%
Cap rate
0.5%
Rent to Value Ratio
Active
$395,000
3
bds
|
2
ba
|
1,459
sqft
|
built
1999
641 Bay Bridge Dr, North Las Vegas, NV 89032
$-818
Cash flow
-10.8%
Cash-on-Cash Return
3.2%
Cap rate
0.5%
Rent to Value Ratio
Active
$428,000
4
bds
|
2
ba
|
1,752
sqft
|
built
2001
6035 Shadow Oak Dr, North Las Vegas, NV 89031
$-870
Cash flow
-10.6%
Cash-on-Cash Return
3.8%
Cap rate
0.5%
Rent to Value Ratio
Active
$415,000
4
bds
|
2
ba
|
1,616
sqft
|
built
2005
6656 Arctic Breeze St, North Las Vegas, NV 89084
$-845
Cash flow
-10.6%
Cash-on-Cash Return
3.2%
Cap rate
0.5%
Rent to Value Ratio

Active
$368,000
4
bds
|
2
ba
|
1,693
sqft
|
built
1963
1313 E Cartier Ave, North Las Vegas, NV 89030
$-736
Cash flow
-10.4%
Cash-on-Cash Return
3.9%
Cap rate
0.5%
Rent to Value Ratio

Active
$527,000
4
bds
|
3
ba
|
2,703
sqft
|
built
2021
1114 Junipine Ave, North Las Vegas, NV 89081
$-1,367
Cash flow
-13.5%
Cash-on-Cash Return
3.2%
Cap rate
0.5%
Rent to Value Ratio
Active
$585,000
5
bds
|
3
ba
|
3,177
sqft
|
built
2008
3624 Pelican Brief Ln, North Las Vegas, NV 89084
$-1,449
Cash flow
-12.9%
Cash-on-Cash Return
3.3%
Cap rate
0.5%
Rent to Value Ratio

Active
$515,000
5
bds
|
3
ba
|
2,859
sqft
|
built
2008
4027 Blueberry Peak Ln, North Las Vegas, NV 89032
$-1,194
Cash flow
-12.1%
Cash-on-Cash Return
3.5%
Cap rate
0.5%
Rent to Value Ratio

Active
$419,900
4
bds
|
3
ba
|
1,976
sqft
|
built
2003
6525 Bismark Hills St, North Las Vegas, NV 89084
$-919
Cash flow
-11.4%
Cash-on-Cash Return
3.6%
Cap rate
0.5%
Rent to Value Ratio

Active
$499,900
5
bds
|
3
ba
|
2,040
sqft
|
built
2003
5229 Giallo Vista Ct, North Las Vegas, NV 89031
$-1,267
Cash flow
-13.2%
Cash-on-Cash Return
3.2%
Cap rate
0.4%
Rent to Value Ratio
Active
$340,000
3
bds
|
2
ba
|
1,789
sqft
|
built
1964
408 Rossmoyne Ave, North Las Vegas, NV 89030
$-433
Cash flow
-6.6%
Cash-on-Cash Return
4.7%
Cap rate
0.6%
Rent to Value Ratio

Active
$360,000
3
bds
|
3
ba
|
1,273
sqft
|
built
1998
4820 Integrity St, North Las Vegas, NV 89031
$-904
Cash flow
-13.1%
Cash-on-Cash Return
3.3%
Cap rate
0.5%
Rent to Value Ratio

Active
$380,000
3
bds
|
3
ba
|
1,827
sqft
|
built
2020
6425 Classic Ridge St, North Las Vegas, NV 89086
$-1,064
Cash flow
-14.6%
Cash-on-Cash Return
2.9%
Cap rate
0.5%
Rent to Value Ratio
Active
$579,000
3
bds
|
3
ba
|
2,166
sqft
|
built
2019
1438 Dire Wolf Ave, North Las Vegas, NV 89084
$-1,846
Cash flow
-16.6%
Cash-on-Cash Return
2.4%
Cap rate
0.4%
Rent to Value Ratio

Active
$330,000
3
bds
|
2
ba
|
1,326
sqft
|
built
2000
2242 Glastonbury Thorn St, North Las Vegas, NV 89032
$-639
Cash flow
-10.1%
Cash-on-Cash Return
3.9%
Cap rate
0.5%
Rent to Value Ratio

Active
$429,900
3
bds
|
3
ba
|
1,517
sqft
|
built
2004
4456 Acropolis Ave, North Las Vegas, NV 89031
$-1,360
Cash flow
-16.5%
Cash-on-Cash Return
2.5%
Cap rate
0.4%
Rent to Value Ratio
Active
$439,900
4
bds
|
2
ba
|
1,647
sqft
|
built
2007
5116 Blue Rose St, North Las Vegas, NV 89081
$-1,271
Cash flow
-15.1%
Cash-on-Cash Return
2.8%
Cap rate
0.4%
Rent to Value Ratio

Active
$384,500
3
bds
|
2
ba
|
1,467
sqft
|
built
1991
5638 Morning Song Cir, North Las Vegas, NV 89031
$-762
Cash flow
-10.3%
Cash-on-Cash Return
3.9%
Cap rate
0.5%
Rent to Value Ratio

Active
$779,000
5
bds
|
4
ba
|
3,732
sqft
|
built
2007
7416 Redhead Dr, North Las Vegas, NV 89084
$-2,279
Cash flow
-15.3%
Cash-on-Cash Return
2.8%
Cap rate
0.5%
Rent to Value Ratio

Active
$442,000
3
bds
|
2
ba
|
1,742
sqft
|
built
2019
138 Scarlett View Ave, North Las Vegas, NV 89031
$-1,121
Cash flow
-13.2%
Cash-on-Cash Return
3.2%
Cap rate
0.5%
Rent to Value Ratio

Active
$455,000
4
bds
|
3
ba
|
2,114
sqft
|
built
2021
1606 Wild Grain Ave, North Las Vegas, NV 89086
$-1,232
Cash flow
-14.1%
Cash-on-Cash Return
3.0%
Cap rate
0.5%
Rent to Value Ratio

Active
$460,000
4
bds
|
3
ba
|
2,354
sqft
|
built
2012
2117 Leatherbridge Ct, North Las Vegas, NV 89081
$-1,251
Cash flow
-14.2%
Cash-on-Cash Return
3.0%
Cap rate
0.5%
Rent to Value Ratio

Active
$349,000
3
bds
|
2
ba
|
1,042
sqft
|
built
1954
813 E Bartlett Ave, North Las Vegas, NV 89030
$-756
Cash flow
-11.3%
Cash-on-Cash Return
3.7%
Cap rate
0.5%
Rent to Value Ratio

Active
$429,900
3
bds
|
2
ba
|
1,876
sqft
|
built
1998
4331 Golden Palomino Ln, North Las Vegas, NV 89032
$-886
Cash flow
-10.8%
Cash-on-Cash Return
3.8%
Cap rate
0.5%
Rent to Value Ratio
Active
$584,900
4
bds
|
3
ba
|
2,792
sqft
|
built
2006
2265 Stone Breeze Ave, North Las Vegas, NV 89031
$-1,566
Cash flow
-14.0%
Cash-on-Cash Return
3.1%
Cap rate
0.4%
Rent to Value Ratio