North Las Vegas, NV Investment Properties for Sale
Browse homes for sale and investment properties in North Las Vegas, NV. Refine your search by price, property type, or more.
Best cash flowing properties in North Las Vegas, NV

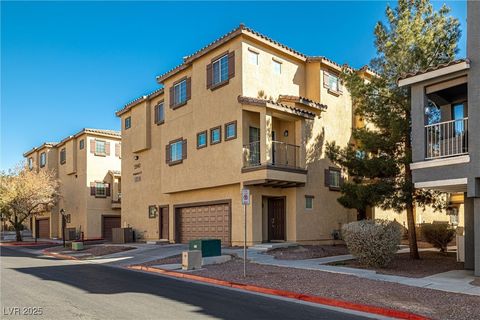
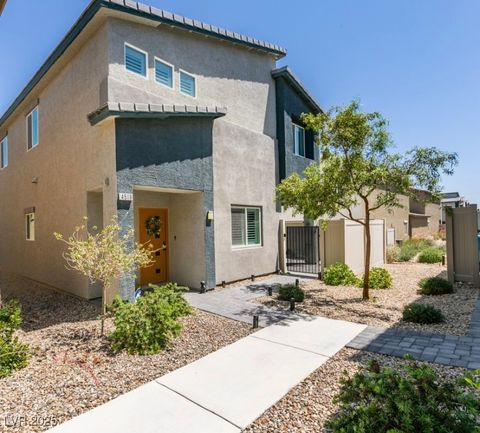
Active
$380,000
3
bds
|
2
ba
|
1,283
sqft
|
built
1949
1608 E Mc Donald Ave, North Las Vegas, NV 89030
$-326
Cash flow
-4.5%
Cash-on-Cash Return
5.2%
Cap rate
0.7%
Rent to Value Ratio
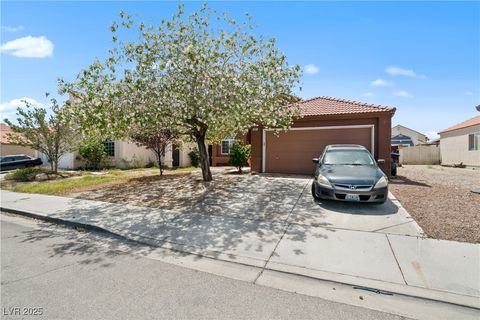
Active
$300,000
4
bds
|
3
ba
|
2,454
sqft
|
built
2021
7457 Onyx Star St, North Las Vegas, NV 89084
$-343
Cash flow
-6.0%
Cash-on-Cash Return
4.9%
Cap rate
0.8%
Rent to Value Ratio
568 out of 697 properties for sale in North Las Vegas, NV
Limited Results Shown
Create a free account, or log in to reveal all property listings and enjoy the complete experience.

Active
$315,000
3
bds
|
2
ba
|
1,161
sqft
|
built
1960
1901 Belmont St, North Las Vegas, NV 89030
$-595
Cash flow
-9.9%
Cash-on-Cash Return
4.0%
Cap rate
0.5%
Rent to Value Ratio

Active
$295,000
3
bds
|
2
ba
|
1,487
sqft
|
built
2004
5855 Valley Dr, North Las Vegas, NV 89031
$-590
Cash flow
-10.4%
Cash-on-Cash Return
3.9%
Cap rate
0.6%
Rent to Value Ratio
Active
$664,900
6
bds
|
4
ba
|
3,939
sqft
|
built
2013
6656 Fort William St, North Las Vegas, NV 89084
$-1,819
Cash flow
-14.3%
Cash-on-Cash Return
3.0%
Cap rate
0.5%
Rent to Value Ratio
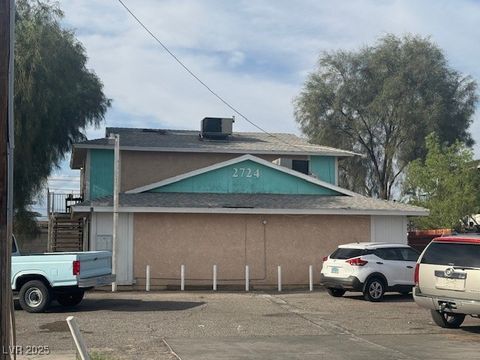
Active
$580,000
8
bds
|
0
ba
|
2,244
sqft
|
built
1982
2724 Haddock Ave, North Las Vegas, NV 89030
$-2,142
Cash flow
-19.3%
Cash-on-Cash Return
1.8%
Cap rate
0.2%
Rent to Value Ratio
Active
$400,000
3
bds
|
3
ba
|
1,947
sqft
|
built
2021
6850 Crimson Shadow St, North Las Vegas, NV 89086
$-1,120
Cash flow
-14.6%
Cash-on-Cash Return
2.9%
Cap rate
0.5%
Rent to Value Ratio
Active
$344,900
3
bds
|
3
ba
|
1,672
sqft
|
built
2005
5940 Palmilla St, North Las Vegas, NV 89031
$-789
Cash flow
-11.9%
Cash-on-Cash Return
3.5%
Cap rate
0.6%
Rent to Value Ratio

Active
$625,000
4
bds
|
3
ba
|
2,260
sqft
|
built
2021
7616 Mojave Evening St, North Las Vegas, NV 89084
$-1,992
Cash flow
-16.6%
Cash-on-Cash Return
2.4%
Cap rate
0.4%
Rent to Value Ratio
Active
$349,999
3
bds
|
2
ba
|
1,444
sqft
|
built
2021
4371 Fire Glow Ave, North Las Vegas, NV 89084
$-949
Cash flow
-14.1%
Cash-on-Cash Return
3.0%
Cap rate
0.5%
Rent to Value Ratio
Active
$529,999
4
bds
|
3
ba
|
2,415
sqft
|
built
2020
4503 Meteora Ledge Ave, North Las Vegas, NV 89084
$-1,495
Cash flow
-14.7%
Cash-on-Cash Return
2.9%
Cap rate
0.5%
Rent to Value Ratio

Active
$400,000
3
bds
|
3
ba
|
1,657
sqft
|
built
2020
6626 Evander St, North Las Vegas, NV 89086
$-717
Cash flow
-9.4%
Cash-on-Cash Return
4.1%
Cap rate
0.6%
Rent to Value Ratio

Active
$549,990
4
bds
|
3
ba
|
2,694
sqft
|
built
2021
4148 Campriani Ave, North Las Vegas, NV 89084
$-1,527
Cash flow
-14.5%
Cash-on-Cash Return
2.9%
Cap rate
0.5%
Rent to Value Ratio

Active
$522,499
4
bds
|
3
ba
|
2,739
sqft
|
built
2021
2918 Woodbourne Ave, North Las Vegas, NV 89031
$-1,551
Cash flow
-15.5%
Cash-on-Cash Return
2.7%
Cap rate
0.5%
Rent to Value Ratio
Active
$279,998
3
bds
|
2
ba
|
1,084
sqft
|
built
2005
5915 Nuevo Leon St, North Las Vegas, NV 89031
$-775
Cash flow
-14.4%
Cash-on-Cash Return
2.9%
Cap rate
0.5%
Rent to Value Ratio

Active
$474,999
3
bds
|
2
ba
|
1,470
sqft
|
built
2001
6022 Highland Gardens Dr, North Las Vegas, NV 89031
$-1,524
Cash flow
-16.7%
Cash-on-Cash Return
2.4%
Cap rate
0.4%
Rent to Value Ratio

Active
$499,900
3
bds
|
3
ba
|
2,206
sqft
|
built
2006
3237 Perching Bird Ln, North Las Vegas, NV 89084
$-1,484
Cash flow
-15.5%
Cash-on-Cash Return
2.7%
Cap rate
0.4%
Rent to Value Ratio
Active
$389,000
4
bds
|
3
ba
|
1,788
sqft
|
built
2005
3040 Balcones Fault Ave, North Las Vegas, NV 89081
$-873
Cash flow
-11.7%
Cash-on-Cash Return
3.6%
Cap rate
0.5%
Rent to Value Ratio
Active
$300,000
4
bds
|
3
ba
|
2,454
sqft
|
built
2021
7457 Onyx Star St, North Las Vegas, NV 89084
$-343
Cash flow
-6.0%
Cash-on-Cash Return
4.9%
Cap rate
0.8%
Rent to Value Ratio
Active
$380,000
3
bds
|
2
ba
|
1,283
sqft
|
built
1949
1608 E Mc Donald Ave, North Las Vegas, NV 89030
$-326
Cash flow
-4.5%
Cash-on-Cash Return
5.2%
Cap rate
0.7%
Rent to Value Ratio
Active
$375,000
3
bds
|
3
ba
|
1,517
sqft
|
built
2022
4537 Queens Hill St, North Las Vegas, NV 89031
$-881
Cash flow
-12.3%
Cash-on-Cash Return
3.4%
Cap rate
0.6%
Rent to Value Ratio

Active
$429,900
3
bds
|
3
ba
|
1,740
sqft
|
built
2022
4719 Transcendental St, North Las Vegas, NV 89031
$-1,286
Cash flow
-15.6%
Cash-on-Cash Return
2.7%
Cap rate
0.5%
Rent to Value Ratio

Active
$380,000
3
bds
|
2
ba
|
1,061
sqft
|
built
2000
5730 Coleman St, North Las Vegas, NV 89031
$-870
Cash flow
-11.9%
Cash-on-Cash Return
3.5%
Cap rate
0.5%
Rent to Value Ratio
Active
$520,000
6
bds
|
3
ba
|
2,072
sqft
|
built
2018
1317 Hopespring Loop Ave, North Las Vegas, NV 89084
$-1,238
Cash flow
-12.4%
Cash-on-Cash Return
3.4%
Cap rate
0.6%
Rent to Value Ratio
Active
$534,999
4
bds
|
3
ba
|
2,482
sqft
|
built
2019
7246 Dazzle Point St, North Las Vegas, NV 89084
$-1,610
Cash flow
-15.7%
Cash-on-Cash Return
2.7%
Cap rate
0.5%
Rent to Value Ratio
Active
$459,999
4
bds
|
3
ba
|
2,454
sqft
|
built
2020
4519 Sapphire Moon Ave, North Las Vegas, NV 89084
$-1,281
Cash flow
-14.5%
Cash-on-Cash Return
2.9%
Cap rate
0.5%
Rent to Value Ratio
Active
$378,000
3
bds
|
2
ba
|
1,459
sqft
|
built
1998
619 Zalataia Way, North Las Vegas, NV 89031
$-772
Cash flow
-10.7%
Cash-on-Cash Return
3.8%
Cap rate
0.5%
Rent to Value Ratio
Active
$493,000
3
bds
|
3
ba
|
1,783
sqft
|
built
2021
415 Carsin Wayne Ct, North Las Vegas, NV 89031
$-1,396
Cash flow
-14.8%
Cash-on-Cash Return
2.9%
Cap rate
0.5%
Rent to Value Ratio

Active
$499,900
5
bds
|
3
ba
|
2,305
sqft
|
built
2006
5940 Tamarack Lodge Ln, North Las Vegas, NV 89081
$-1,369
Cash flow
-14.3%
Cash-on-Cash Return
3.0%
Cap rate
0.4%
Rent to Value Ratio
Active
$530,000
4
bds
|
4
ba
|
2,520
sqft
|
built
2023
4364 Contour Bend Ave, North Las Vegas, NV 89084
$-1,647
Cash flow
-16.2%
Cash-on-Cash Return
2.5%
Cap rate
0.5%
Rent to Value Ratio

Active
$539,900
3
bds
|
2
ba
|
1,939
sqft
|
built
2023
104 Barton Bay Ave, North Las Vegas, NV 89031
$-1,523
Cash flow
-14.7%
Cash-on-Cash Return
2.9%
Cap rate
0.5%
Rent to Value Ratio
Active
$487,000
5
bds
|
3
ba
|
2,907
sqft
|
built
2012
351 Caneflower Ct, North Las Vegas, NV 89031
$-1,282
Cash flow
-13.7%
Cash-on-Cash Return
3.1%
Cap rate
0.5%
Rent to Value Ratio
Active
$398,888
3
bds
|
3
ba
|
1,689
sqft
|
built
2005
3412 Catherine Mermet Ave, North Las Vegas, NV 89081
$-877
Cash flow
-11.5%
Cash-on-Cash Return
3.6%
Cap rate
0.5%
Rent to Value Ratio

Active
$375,000
2
bds
|
3
ba
|
1,563
sqft
|
built
2020
1027 Brilliant Meadow Ave, North Las Vegas, NV 89086
$-981
Cash flow
-13.6%
Cash-on-Cash Return
3.1%
Cap rate
0.5%
Rent to Value Ratio

Active
$475,000
4
bds
|
3
ba
|
2,129
sqft
|
built
2021
1054 Twincrest Ave, North Las Vegas, NV 89032
$-1,187
Cash flow
-13.0%
Cash-on-Cash Return
3.3%
Cap rate
0.5%
Rent to Value Ratio

Active
$440,002
4
bds
|
3
ba
|
2,321
sqft
|
built
2005
2929 Salado Creek Ave, North Las Vegas, NV 89081
$-848
Cash flow
-10.1%
Cash-on-Cash Return
4.0%
Cap rate
0.6%
Rent to Value Ratio
Active
$679,999
4
bds
|
2
ba
|
2,710
sqft
|
built
1989
4745 Gunlock Cir, North Las Vegas, NV 89031
$-1,884
Cash flow
-14.5%
Cash-on-Cash Return
2.9%
Cap rate
0.4%
Rent to Value Ratio
Active
$489,000
4
bds
|
3
ba
|
2,271
sqft
|
built
1995
3704 Blairmoor St, North Las Vegas, NV 89032
$-1,098
Cash flow
-11.7%
Cash-on-Cash Return
3.6%
Cap rate
0.5%
Rent to Value Ratio

Active
$419,500
3
bds
|
3
ba
|
1,532
sqft
|
built
2023
4128 Golden Sol St, North Las Vegas, NV 89032
$-1,002
Cash flow
-12.5%
Cash-on-Cash Return
3.4%
Cap rate
0.5%
Rent to Value Ratio
Active
$390,000
3
bds
|
2
ba
|
1,599
sqft
|
built
2003
5240 Adorato Dr, North Las Vegas, NV 89031
$-808
Cash flow
-10.8%
Cash-on-Cash Return
3.8%
Cap rate
0.5%
Rent to Value Ratio
Active
$454,900
3
bds
|
2
ba
|
1,506
sqft
|
built
1997
608 Blooming View Ave, North Las Vegas, NV 89032
$-1,121
Cash flow
-12.9%
Cash-on-Cash Return
3.3%
Cap rate
0.4%
Rent to Value Ratio
Active
$394,900
5
bds
|
2
ba
|
1,461
sqft
|
built
1964
1936 Lawry Ave, North Las Vegas, NV 89032
$-1,145
Cash flow
-15.1%
Cash-on-Cash Return
2.8%
Cap rate
0.4%
Rent to Value Ratio