North Las Vegas, NV Investment Properties for Sale
Browse homes for sale and investment properties in North Las Vegas, NV. Refine your search by price, property type, or more.
Best cash flowing properties in North Las Vegas, NV
Active
$140,000
1
bds
|
1
ba
|
736
sqft
|
built
1982
3008 Saint George St, North Las Vegas, NV 89030
$-170
Cash flow
-6.3%
Cash-on-Cash Return
4.8%
Cap rate
0.8%
Rent to Value Ratio

Active
$187,900
2
bds
|
2
ba
|
1,088
sqft
|
built
1981
3405 Civic Center Dr, North Las Vegas, NV 89030
$-197
Cash flow
-5.5%
Cash-on-Cash Return
5.0%
Cap rate
0.7%
Rent to Value Ratio
610 out of 631 properties for sale in North Las Vegas, NV
Limited Results Shown
Create a free account, or log in to reveal all property listings and enjoy the complete experience.
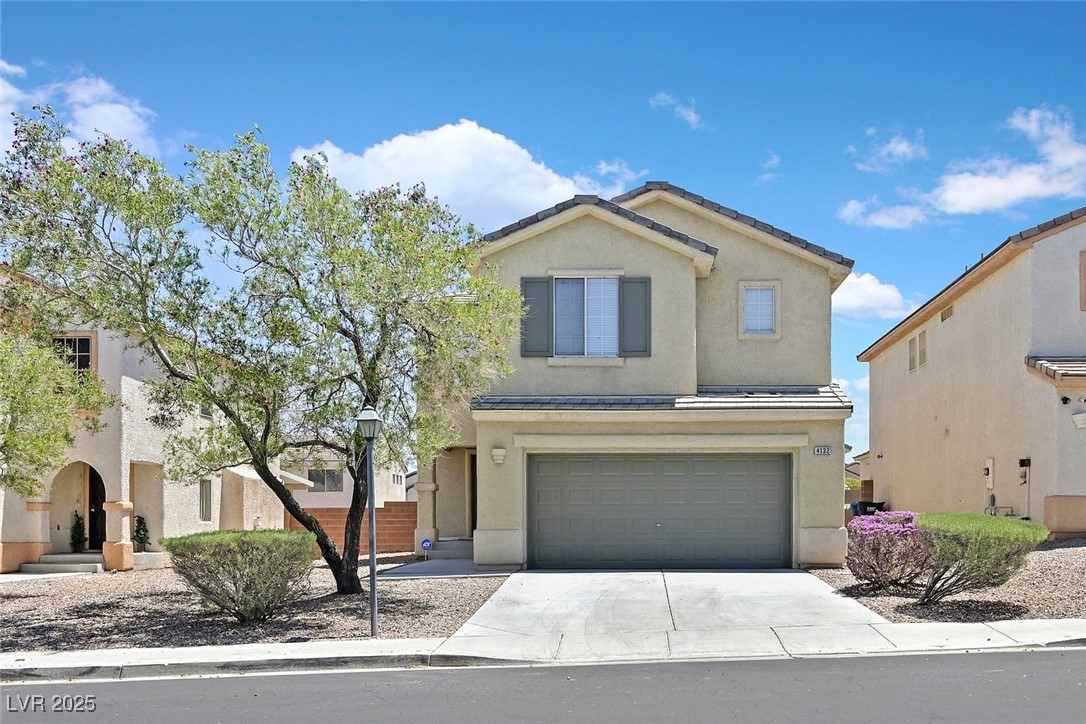
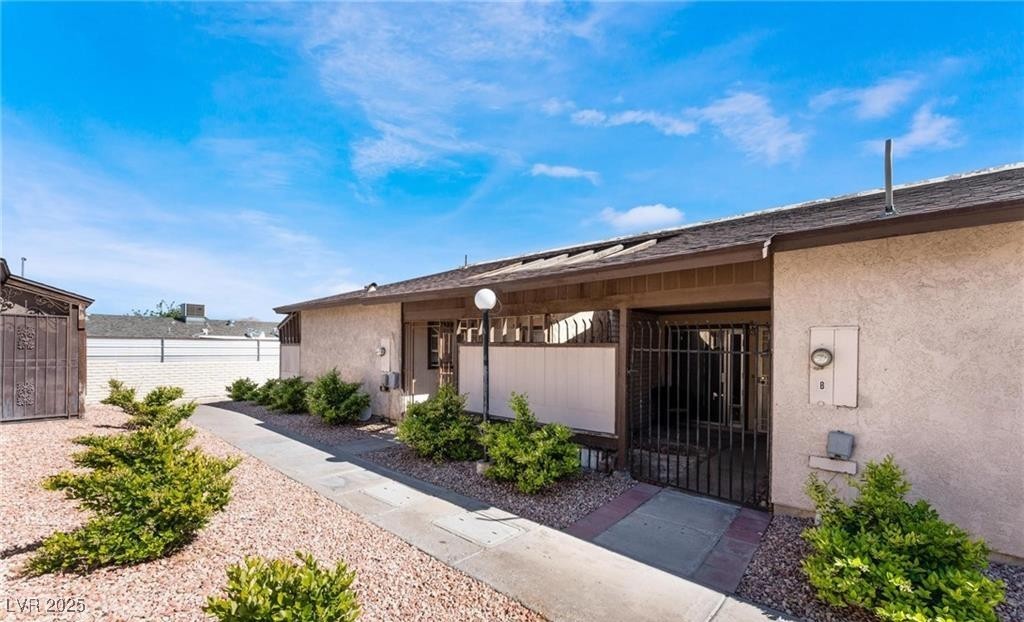
Active
$399,900
3
bds
|
3
ba
|
1,535
sqft
|
built
2002
4132 Joyous St, North Las Vegas, NV 89032
$-937
Cash flow
-12.2%
Cash-on-Cash Return
3.5%
Cap rate
0.5%
Rent to Value Ratio
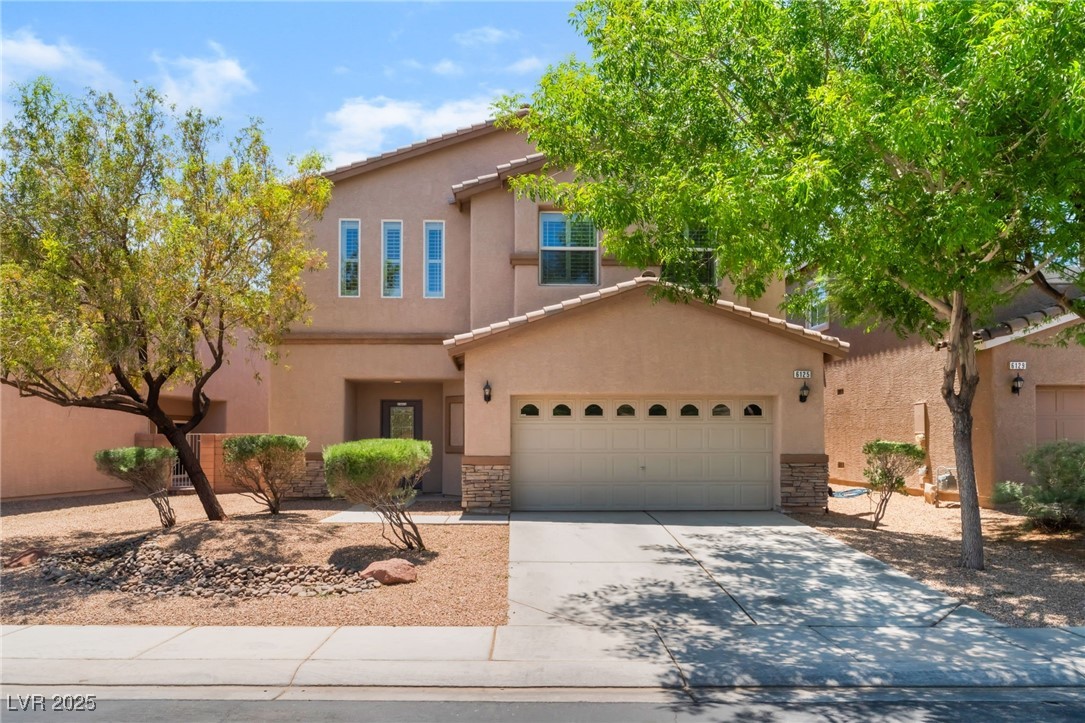
Active
$569,900
5
bds
|
3
ba
|
2,961
sqft
|
built
2012
6125 Paddleboat St, North Las Vegas, NV 89031
$-1,657
Cash flow
-15.2%
Cash-on-Cash Return
2.8%
Cap rate
0.5%
Rent to Value Ratio
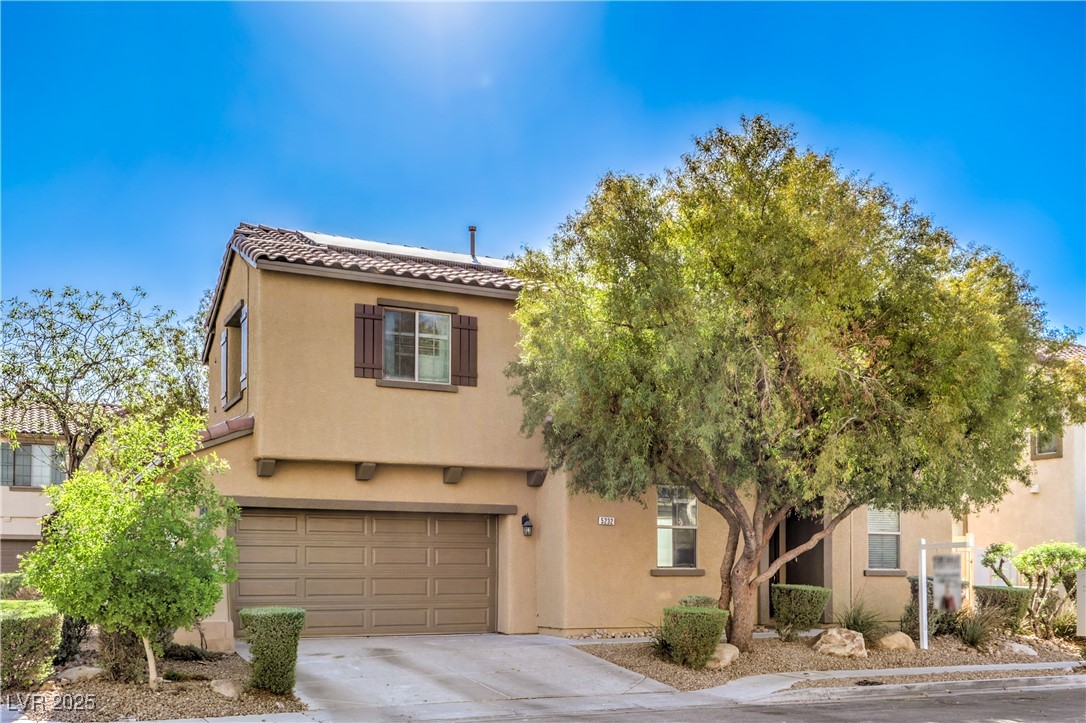
Active
$400,000
3
bds
|
3
ba
|
1,771
sqft
|
built
2007
5232 Pendergrass St, North Las Vegas, NV 89081
$-1,003
Cash flow
-13.1%
Cash-on-Cash Return
3.3%
Cap rate
0.5%
Rent to Value Ratio
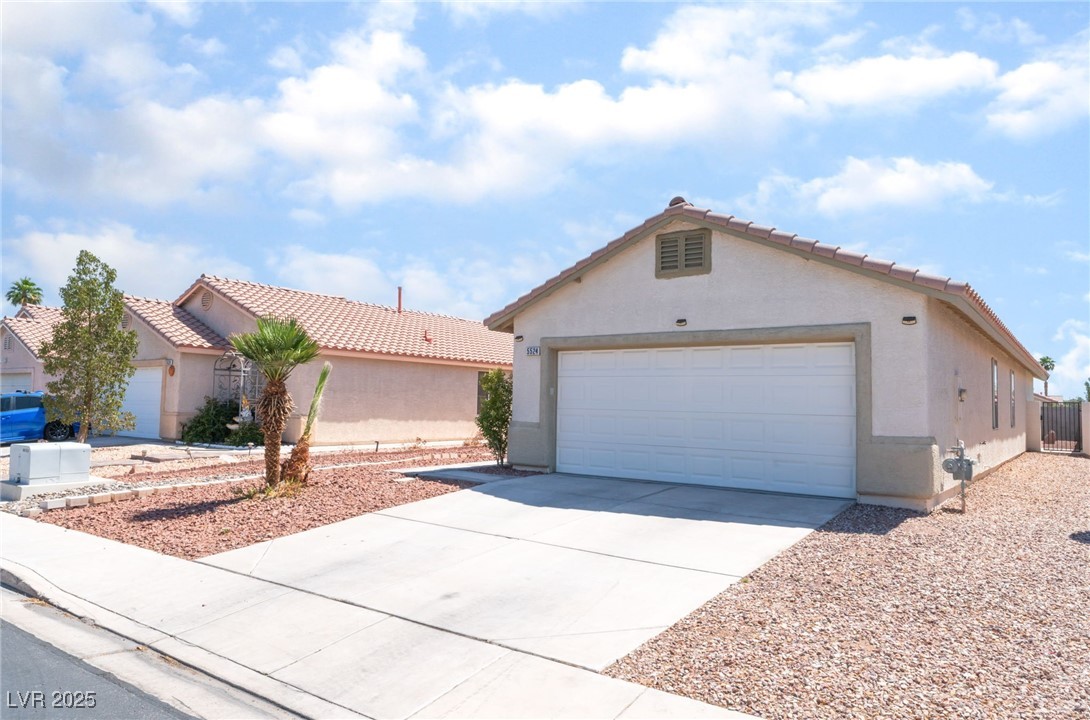
Active
$377,000
3
bds
|
2
ba
|
1,205
sqft
|
built
1999
5524 La Pelusa St, North Las Vegas, NV 89031
$-900
Cash flow
-12.5%
Cash-on-Cash Return
3.4%
Cap rate
0.5%
Rent to Value Ratio
Active
$575,000
5
bds
|
4
ba
|
2,972
sqft
|
built
2006
8224 Fowler Falls Ct, North Las Vegas, NV 89085
$-1,447
Cash flow
-13.1%
Cash-on-Cash Return
3.3%
Cap rate
0.5%
Rent to Value Ratio
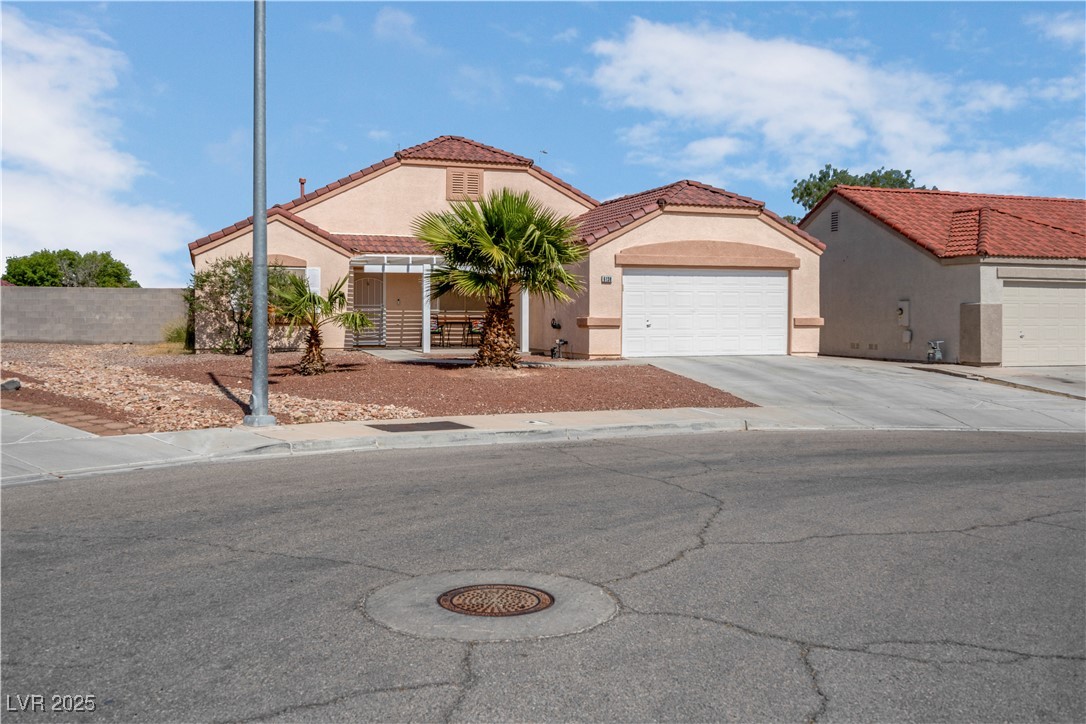
Active
$479,900
3
bds
|
2
ba
|
1,208
sqft
|
built
1995
3505 Benson Ln, North Las Vegas, NV 89032
$-1,358
Cash flow
-14.8%
Cash-on-Cash Return
2.9%
Cap rate
0.4%
Rent to Value Ratio
Active under contract
$325,000
3
bds
|
2
ba
|
1,582
sqft
|
built
1992
1230 Pagentry Dr, North Las Vegas, NV 89031
$-487
Cash flow
-7.8%
Cash-on-Cash Return
4.5%
Cap rate
0.6%
Rent to Value Ratio
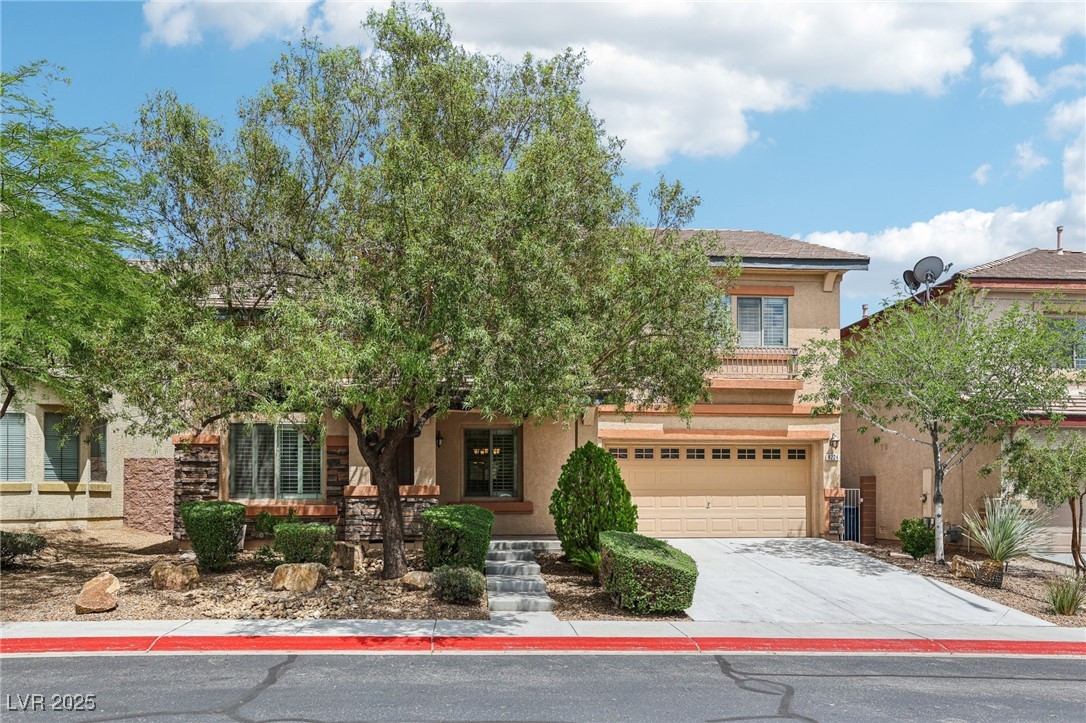
Active
$385,000
3
bds
|
2
ba
|
1,401
sqft
|
built
1999
6138 Crystal Flower Way, North Las Vegas, NV 89031
$-744
Cash flow
-10.1%
Cash-on-Cash Return
4.0%
Cap rate
0.5%
Rent to Value Ratio
Active
$535,000
4
bds
|
3
ba
|
3,023
sqft
|
built
2005
2261 Dalton Ridge Ct, North Las Vegas, NV 89031
$-1,163
Cash flow
-11.3%
Cash-on-Cash Return
3.7%
Cap rate
0.5%
Rent to Value Ratio
Active
$565,000
4
bds
|
3
ba
|
2,148
sqft
|
built
2023
129 Barton Bay Ave, North Las Vegas, NV 89031
$-1,638
Cash flow
-15.1%
Cash-on-Cash Return
2.8%
Cap rate
0.5%
Rent to Value Ratio
Active
$248,000
3
bds
|
2
ba
|
1,235
sqft
|
built
1971
3505 Mercury St, North Las Vegas, NV 89030
$-351
Cash flow
-7.4%
Cash-on-Cash Return
4.6%
Cap rate
0.6%
Rent to Value Ratio
Active
$140,000
1
bds
|
1
ba
|
736
sqft
|
built
1982
3008 Saint George St, North Las Vegas, NV 89030
$-170
Cash flow
-6.3%
Cash-on-Cash Return
4.8%
Cap rate
0.8%
Rent to Value Ratio
Active
$187,900
2
bds
|
2
ba
|
1,088
sqft
|
built
1981
3405 Civic Center Dr, North Las Vegas, NV 89030
$-197
Cash flow
-5.5%
Cash-on-Cash Return
5.0%
Cap rate
0.7%
Rent to Value Ratio
Active
$859,000
4
bds
|
4
ba
|
3,540
sqft
|
built
2005
3910 Internet Ave, North Las Vegas, NV 89031
$-2,456
Cash flow
-14.9%
Cash-on-Cash Return
2.9%
Cap rate
0.4%
Rent to Value Ratio
Active
$429,900
3
bds
|
3
ba
|
1,517
sqft
|
built
2004
4456 Acropolis Ave, North Las Vegas, NV 89031
$-1,367
Cash flow
-16.6%
Cash-on-Cash Return
2.5%
Cap rate
0.4%
Rent to Value Ratio
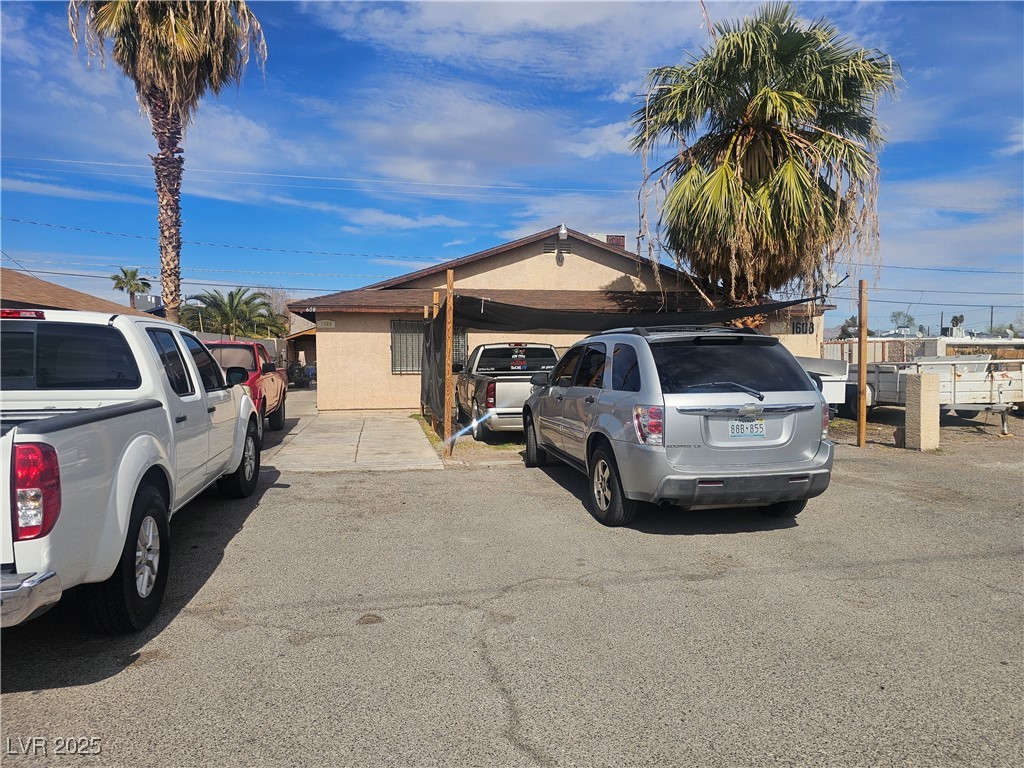
Active
$410,000
5
bds
|
0
ba
|
1,908
sqft
|
built
1981
1608 Putnam Ave, North Las Vegas, NV 89030
$-1,332
Cash flow
-17.0%
Cash-on-Cash Return
2.4%
Cap rate
0.3%
Rent to Value Ratio

Active
$779,000
5
bds
|
4
ba
|
3,732
sqft
|
built
2007
7416 Redhead Dr, North Las Vegas, NV 89084
$-2,291
Cash flow
-15.3%
Cash-on-Cash Return
2.8%
Cap rate
0.5%
Rent to Value Ratio
Active
$579,000
3
bds
|
3
ba
|
2,166
sqft
|
built
2019
1438 Dire Wolf Ave, North Las Vegas, NV 89084
$-1,855
Cash flow
-16.7%
Cash-on-Cash Return
2.4%
Cap rate
0.4%
Rent to Value Ratio

Active
$349,900
3
bds
|
3
ba
|
1,373
sqft
|
built
2022
2657 Fawn Beige Ct, North Las Vegas, NV 89086
$-1,096
Cash flow
-16.3%
Cash-on-Cash Return
2.5%
Cap rate
0.5%
Rent to Value Ratio

Active
$270,000
2
bds
|
2
ba
|
1,220
sqft
|
built
2006
4305 Morgan Manor St, North Las Vegas, NV 89032
$-735
Cash flow
-14.2%
Cash-on-Cash Return
3.0%
Cap rate
0.6%
Rent to Value Ratio
Active
$499,000
5
bds
|
3
ba
|
2,528
sqft
|
built
2006
1020 High Altitude Ave, North Las Vegas, NV 89032
$-1,245
Cash flow
-13.0%
Cash-on-Cash Return
3.3%
Cap rate
0.5%
Rent to Value Ratio
Active
$384,500
3
bds
|
2
ba
|
1,467
sqft
|
built
1991
5638 Morning Song Cir, North Las Vegas, NV 89031
$-769
Cash flow
-10.4%
Cash-on-Cash Return
3.9%
Cap rate
0.5%
Rent to Value Ratio

Active
$584,900
4
bds
|
3
ba
|
2,792
sqft
|
built
2006
2265 Stone Breeze Ave, North Las Vegas, NV 89031
$-1,575
Cash flow
-14.0%
Cash-on-Cash Return
3.1%
Cap rate
0.4%
Rent to Value Ratio
Active under contract
$280,000
2
bds
|
2
ba
|
1,073
sqft
|
built
2006
5855 Valley Dr, North Las Vegas, NV 89031
$-650
Cash flow
-12.1%
Cash-on-Cash Return
3.5%
Cap rate
0.6%
Rent to Value Ratio
Active
$340,000
3
bds
|
2
ba
|
1,789
sqft
|
built
1964
408 Rossmoyne Ave, North Las Vegas, NV 89030
$-438
Cash flow
-6.7%
Cash-on-Cash Return
4.7%
Cap rate
0.6%
Rent to Value Ratio

Active under contract
$440,000
4
bds
|
3
ba
|
2,046
sqft
|
built
2017
5648 Alitak Bay St, North Las Vegas, NV 89081
$-993
Cash flow
-11.8%
Cash-on-Cash Return
3.6%
Cap rate
0.6%
Rent to Value Ratio

Active
$330,000
3
bds
|
2
ba
|
1,326
sqft
|
built
2000
2242 Glastonbury Thorn St, North Las Vegas, NV 89032
$-644
Cash flow
-10.2%
Cash-on-Cash Return
3.9%
Cap rate
0.5%
Rent to Value Ratio
Active
$449,900
3
bds
|
2
ba
|
1,987
sqft
|
built
2016
3708 Fuselier Dr, North Las Vegas, NV 89032
$-928
Cash flow
-10.8%
Cash-on-Cash Return
3.8%
Cap rate
0.6%
Rent to Value Ratio
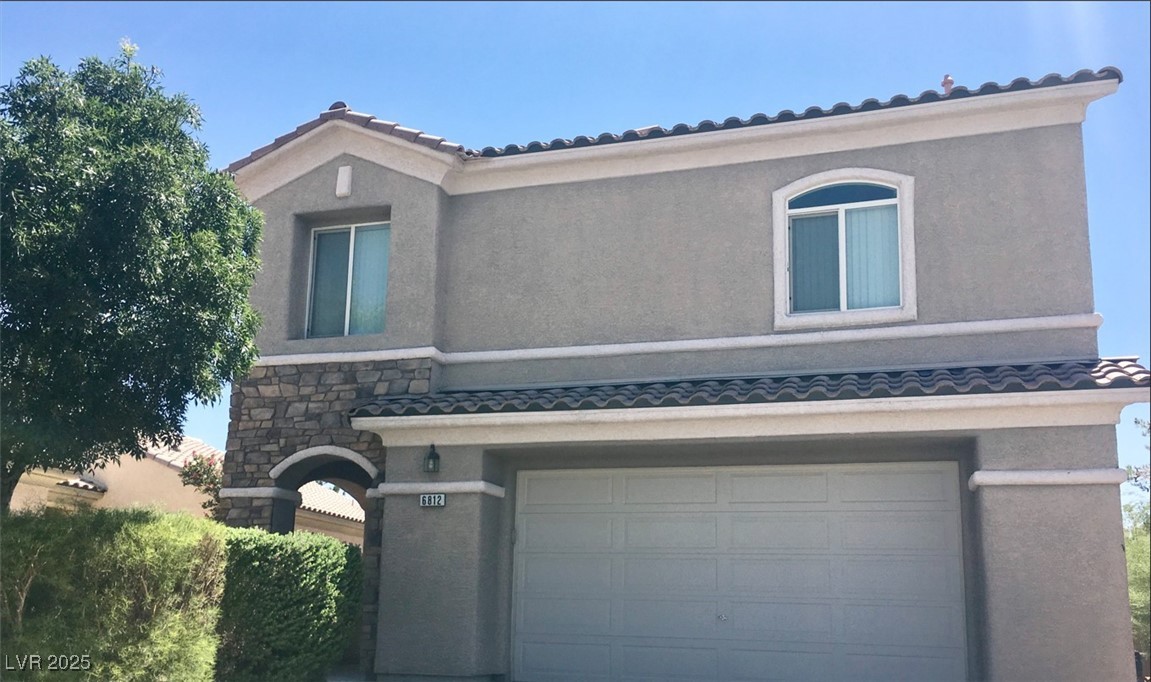
Active
$434,500
3
bds
|
3
ba
|
1,918
sqft
|
built
2003
6812 Dipper Ave, North Las Vegas, NV 89084
$-990
Cash flow
-11.9%
Cash-on-Cash Return
3.5%
Cap rate
0.5%
Rent to Value Ratio
Active
$410,000
3
bds
|
3
ba
|
1,557
sqft
|
built
2005
3844 Hollycroft Dr, North Las Vegas, NV 89081
$-965
Cash flow
-12.3%
Cash-on-Cash Return
3.5%
Cap rate
0.5%
Rent to Value Ratio
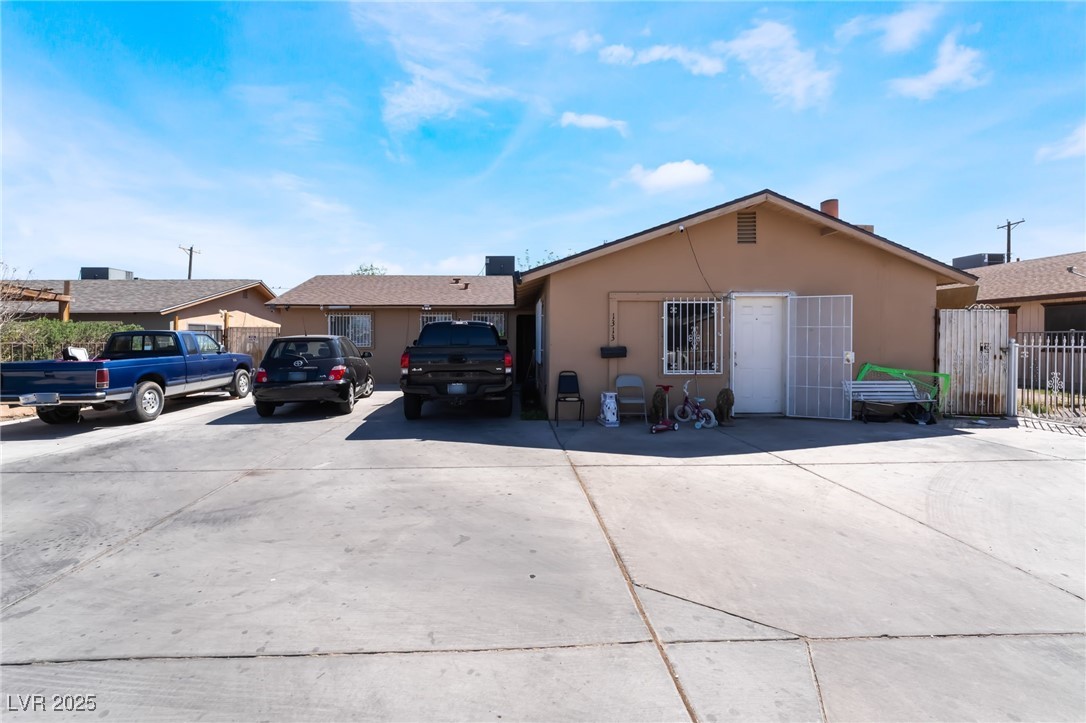
Active
$368,000
4
bds
|
2
ba
|
1,693
sqft
|
built
1963
1313 E Cartier Ave, North Las Vegas, NV 89030
$-742
Cash flow
-10.5%
Cash-on-Cash Return
3.9%
Cap rate
0.5%
Rent to Value Ratio
Active
$420,000
3
bds
|
3
ba
|
1,878
sqft
|
built
2019
6308 Gulf Waters St, North Las Vegas, NV 89081
$-1,181
Cash flow
-14.7%
Cash-on-Cash Return
2.9%
Cap rate
0.5%
Rent to Value Ratio
Active
$580,000
3
bds
|
2
ba
|
1,741
sqft
|
built
2023
71 Gosia Grove Ave, North Las Vegas, NV 89031
$-1,995
Cash flow
-17.9%
Cash-on-Cash Return
2.2%
Cap rate
0.4%
Rent to Value Ratio

Active
$442,000
3
bds
|
2
ba
|
1,742
sqft
|
built
2019
138 Scarlett View Ave, North Las Vegas, NV 89031
$-1,128
Cash flow
-13.3%
Cash-on-Cash Return
3.2%
Cap rate
0.5%
Rent to Value Ratio
Active
$384,900
4
bds
|
3
ba
|
2,527
sqft
|
built
1995
529 Rancho Del Mar Way, North Las Vegas, NV 89031
$-825
Cash flow
-11.2%
Cash-on-Cash Return
3.7%
Cap rate
0.5%
Rent to Value Ratio

Active
$599,900
5
bds
|
3
ba
|
2,977
sqft
|
built
2017
2409 W Gilmore Ave, North Las Vegas, NV 89032
$-1,604
Cash flow
-14.0%
Cash-on-Cash Return
3.1%
Cap rate
0.5%
Rent to Value Ratio
Active
$248,999
2
bds
|
2
ba
|
1,151
sqft
|
built
1999
1881 W Alexander Rd, North Las Vegas, NV 89032
$-657
Cash flow
-13.8%
Cash-on-Cash Return
3.1%
Cap rate
0.6%
Rent to Value Ratio
Active
$419,900
4
bds
|
3
ba
|
1,976
sqft
|
built
2003
6525 Bismark Hills St, North Las Vegas, NV 89084
$-926
Cash flow
-11.5%
Cash-on-Cash Return
3.6%
Cap rate
0.5%
Rent to Value Ratio
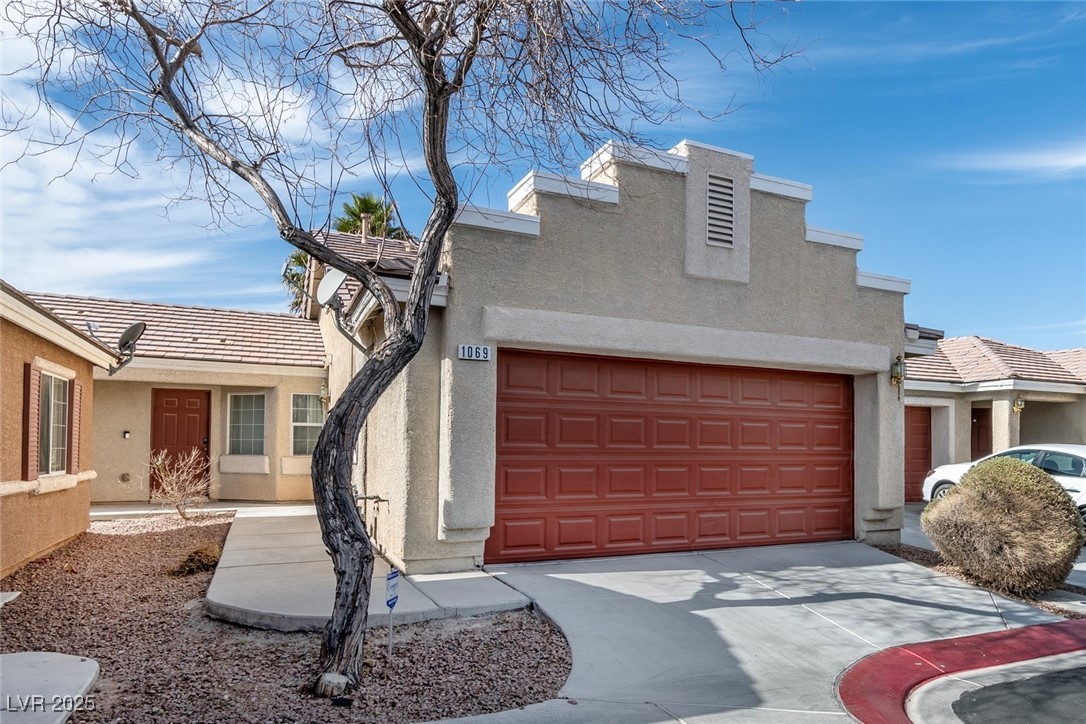
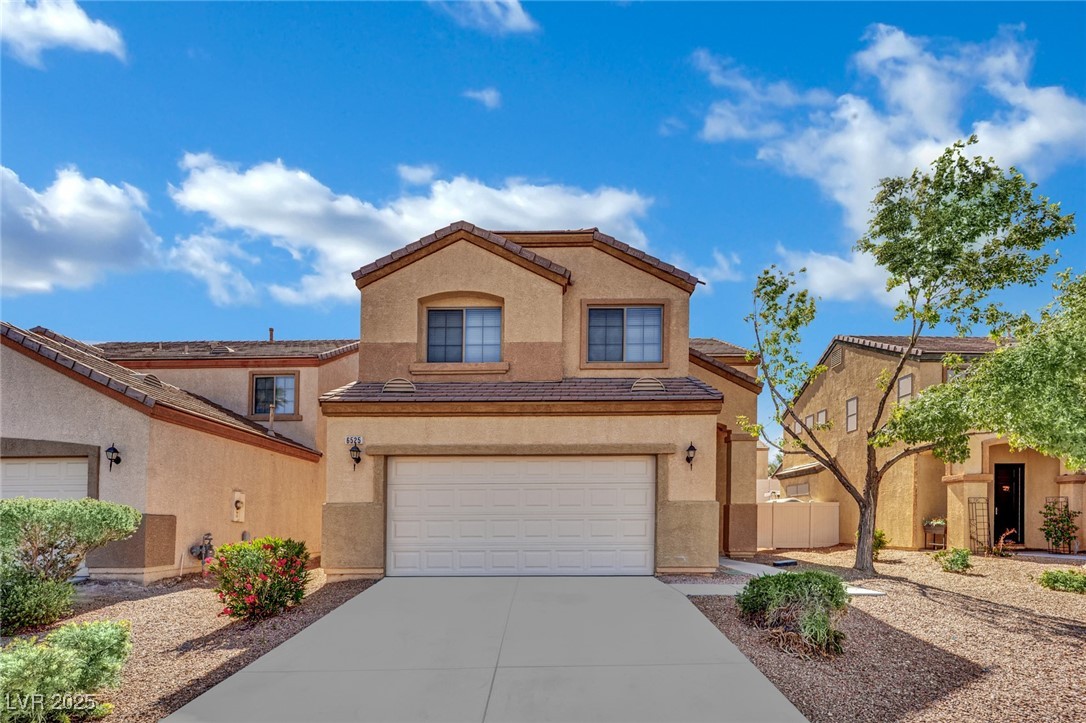
Active
$355,000
3
bds
|
2
ba
|
1,421
sqft
|
built
2006
1069 Appleblossom Time Ave, North Las Vegas, NV 89031
$-865
Cash flow
-12.7%
Cash-on-Cash Return
3.4%
Cap rate
0.5%
Rent to Value Ratio
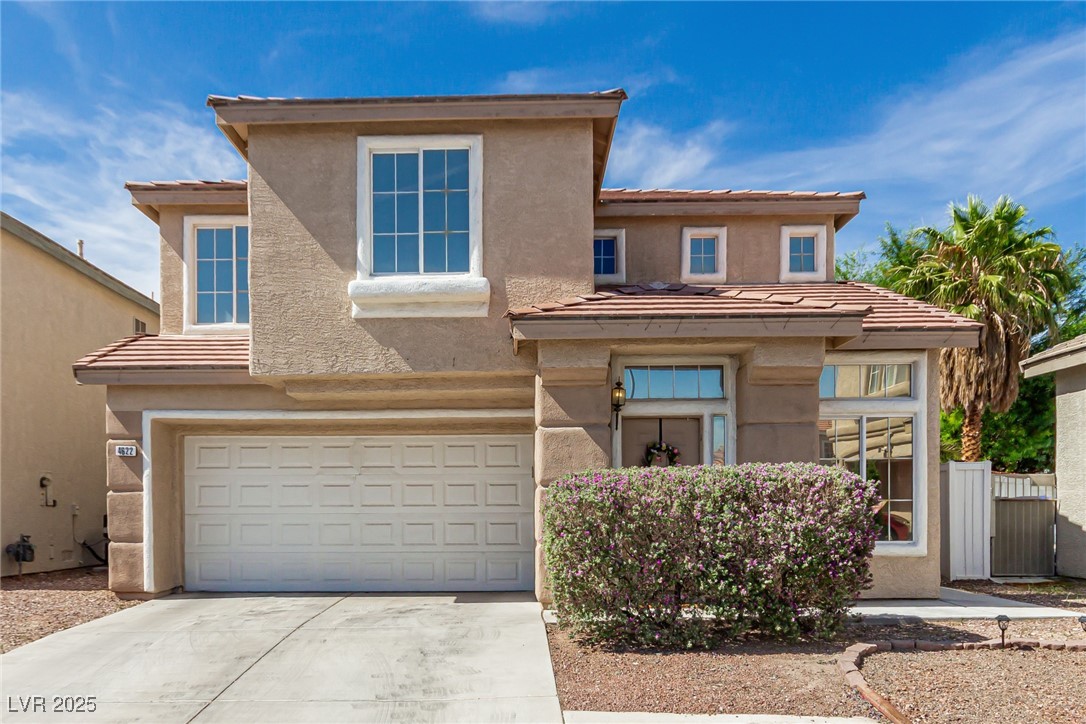
Active
$414,900
4
bds
|
3
ba
|
1,838
sqft
|
built
2001
4622 English Lavender Ave, North Las Vegas, NV 89031
$-868
Cash flow
-10.9%
Cash-on-Cash Return
3.8%
Cap rate
0.5%
Rent to Value Ratio