North Lauderdale, FL Investment Properties for Sale
Browse homes for sale and investment properties in North Lauderdale, FL. Refine your search by price, property type, or more.
Best cash flowing properties in North Lauderdale, FL
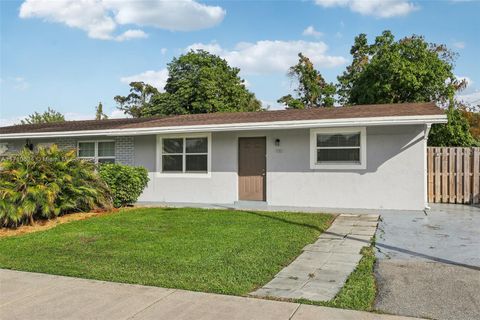
Pending
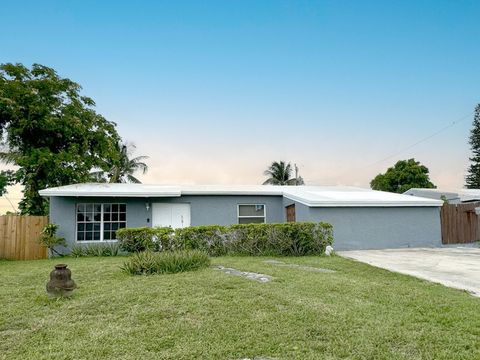
$289,900
2
bds
|
1
ba
|
775
sqft
|
built
1968
1932 SW 69th Ave, North Lauderdale, FL 33068
$33
Cash flow
0.6%
Cash-on-Cash Return
6.3%
Cap rate
0.8%
Rent to Value Ratio
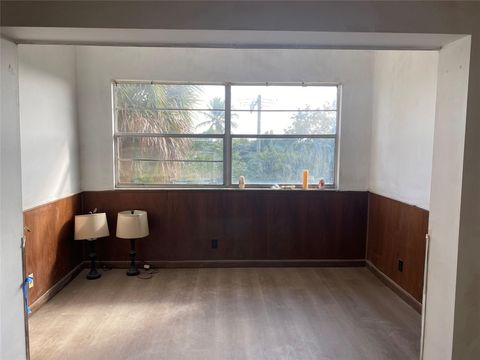
Active
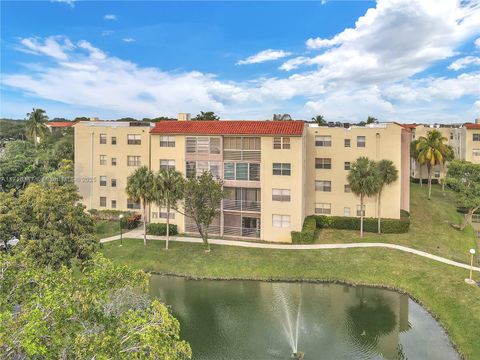
$129,000
1
bds
|
2
ba
|
823
sqft
|
built
1979
1891 N Lauderdale Ave, North Lauderdale, FL 33068
$-138
Cash flow
-5.6%
Cash-on-Cash Return
4.9%
Cap rate
1.2%
Rent to Value Ratio
119 out of 137 properties for sale in North Lauderdale, FL
Limited Results Shown
Create a free account, or log in to reveal all property listings and enjoy the complete experience.
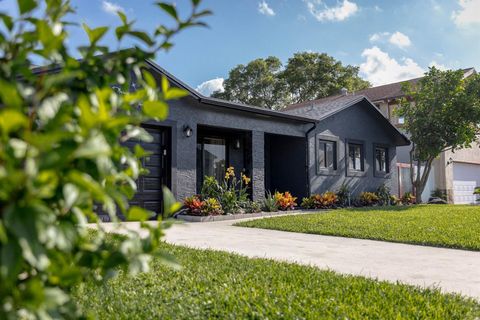
Active
$509,000
4
bds
|
2
ba
|
1,727
sqft
|
built
1979
8310 SW 20th St, North Lauderdale, FL 33068
$-814
Cash flow
-8.3%
Cash-on-Cash Return
4.2%
Cap rate
0.6%
Rent to Value Ratio
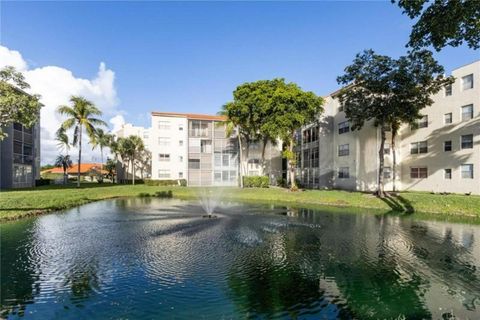
Active
$179,000
2
bds
|
2
ba
|
1,000
sqft
|
built
1979
1820 N Lauderdale Ave, North Lauderdale, FL 33068
$-572
Cash flow
-16.7%
Cash-on-Cash Return
2.3%
Cap rate
1.1%
Rent to Value Ratio

Active
$190,000
2
bds
|
2
ba
|
1,350
sqft
|
built
1984
8030 Hampton Blvd, North Lauderdale, FL 33068
$-397
Cash flow
-10.9%
Cash-on-Cash Return
3.6%
Cap rate
1.2%
Rent to Value Ratio
Active
$145,000
1
bds
|
2
ba
|
830
sqft
|
built
1979
1810 N Lauderdale Ave, North Lauderdale, FL 33068
$-532
Cash flow
-19.1%
Cash-on-Cash Return
1.7%
Cap rate
1.1%
Rent to Value Ratio

Active
$299,000
3
bds
|
3
ba
|
1,403
sqft
|
built
1984
129 San Remo Blvd, North Lauderdale, FL 33068
$-376
Cash flow
-6.6%
Cash-on-Cash Return
4.6%
Cap rate
0.9%
Rent to Value Ratio
Active
$199,500
2
bds
|
2
ba
|
1,108
sqft
|
built
1975
7904 Kimberly Blvd, North Lauderdale, FL 33068
$-409
Cash flow
-10.7%
Cash-on-Cash Return
3.7%
Cap rate
1.0%
Rent to Value Ratio
Active
$350,000
2
bds
|
2
ba
|
1,186
sqft
|
built
1985
1832 Runners Way, North Lauderdale, FL 33068
$-603
Cash flow
-9.0%
Cash-on-Cash Return
4.1%
Cap rate
0.7%
Rent to Value Ratio
Active
$128,000
1
bds
|
2
ba
|
830
sqft
|
built
1980
1830 N Lauderdale Ave, North Lauderdale, FL 33068
$-446
Cash flow
-18.2%
Cash-on-Cash Return
2.0%
Cap rate
1.3%
Rent to Value Ratio
Active
$129,000
1
bds
|
2
ba
|
823
sqft
|
built
1979
1891 N Lauderdale Ave, North Lauderdale, FL 33068
$-138
Cash flow
-5.6%
Cash-on-Cash Return
4.9%
Cap rate
1.2%
Rent to Value Ratio

Active
$219,995
2
bds
|
3
ba
|
1,530
sqft
|
built
1980
8212 SW 23rd Ct, North Lauderdale, FL 33068
$-569
Cash flow
-13.5%
Cash-on-Cash Return
3.0%
Cap rate
1.0%
Rent to Value Ratio

Active
$345,000
3
bds
|
2
ba
|
1,612
sqft
|
built
1984
1233 Hampton Blvd, North Lauderdale, FL 33068
$-525
Cash flow
-7.9%
Cash-on-Cash Return
4.3%
Cap rate
0.8%
Rent to Value Ratio
Active
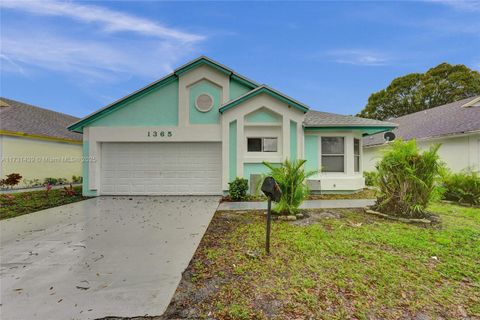
$444,999
3
bds
|
2
ba
|
1,470
sqft
|
built
1995
1365 W Glen Oak Rd, North Lauderdale, FL 33068
$-815
Cash flow
-9.6%
Cash-on-Cash Return
4.0%
Cap rate
0.7%
Rent to Value Ratio
Pending
$289,900
2
bds
|
1
ba
|
775
sqft
|
built
1968
1932 SW 69th Ave, North Lauderdale, FL 33068
$33
Cash flow
0.6%
Cash-on-Cash Return
6.3%
Cap rate
0.8%
Rent to Value Ratio
Active
$157,000
1
bds
|
2
ba
|
830
sqft
|
built
1979
1810 N Lauderdale Ave, North Lauderdale, FL 33068
$-622
Cash flow
-20.7%
Cash-on-Cash Return
1.4%
Cap rate
1.0%
Rent to Value Ratio
Active
$155,000
2
bds
|
2
ba
|
1,000
sqft
|
built
1976
1800 N Lauderdale Ave, North Lauderdale, FL 33068
$-490
Cash flow
-16.5%
Cash-on-Cash Return
2.4%
Cap rate
1.3%
Rent to Value Ratio
Active under contract
$125,000
2
bds
|
2
ba
|
1,000
sqft
|
built
1979
1810 N Lauderdale Ave, North Lauderdale, FL 33068
$-333
Cash flow
-13.9%
Cash-on-Cash Return
2.9%
Cap rate
1.6%
Rent to Value Ratio
Active
$115,000
2
bds
|
2
ba
|
1,000
sqft
|
built
1979
1830 N Lauderdale Ave, North Lauderdale, FL 33068
$-276
Cash flow
-12.5%
Cash-on-Cash Return
3.3%
Cap rate
1.7%
Rent to Value Ratio
Active
$425,000
2
bds
|
2
ba
|
1,753
sqft
|
built
1958
1510 SW 68th Ter, North Lauderdale, FL 33068
$-175
Cash flow
-2.1%
Cash-on-Cash Return
5.7%
Cap rate
0.7%
Rent to Value Ratio
Active
$450,000
3
bds
|
2
ba
|
1,470
sqft
|
built
1992
714 Holly St, North Lauderdale, FL 33068
$-682
Cash flow
-7.9%
Cash-on-Cash Return
4.3%
Cap rate
0.8%
Rent to Value Ratio
Active
$143,000
1
bds
|
2
ba
|
830
sqft
|
built
1979
1810 N Lauderdale Ave, North Lauderdale, FL 33068
$-541
Cash flow
-19.7%
Cash-on-Cash Return
1.6%
Cap rate
1.1%
Rent to Value Ratio
Active
$159,000
2
bds
|
2
ba
|
1,000
sqft
|
built
1980
1830 N Lauderdale Ave, North Lauderdale, FL 33068
$-533
Cash flow
-17.5%
Cash-on-Cash Return
2.1%
Cap rate
1.1%
Rent to Value Ratio
Active
$155,000
2
bds
|
2
ba
|
1,350
sqft
|
built
1984
8030 Hampton Blvd, North Lauderdale, FL 33068
$-214
Cash flow
-7.2%
Cash-on-Cash Return
4.5%
Cap rate
1.3%
Rent to Value Ratio
Active
$169,500
2
bds
|
2
ba
|
1,036
sqft
|
built
1975
726 SW 73rd Ave, North Lauderdale, FL 33068
$-200
Cash flow
-6.2%
Cash-on-Cash Return
4.7%
Cap rate
1.1%
Rent to Value Ratio
Active
$300,000
2
bds
|
2
ba
|
1,152
sqft
|
built
1974
620 SW 80th Ter, North Lauderdale, FL 33068
$-224
Cash flow
-3.9%
Cash-on-Cash Return
5.3%
Cap rate
0.8%
Rent to Value Ratio
Active
$220,000
3
bds
|
2
ba
|
1,480
sqft
|
built
1984
8010 Hampton Blvd, North Lauderdale, FL 33068
$-391
Cash flow
-9.3%
Cash-on-Cash Return
4.0%
Cap rate
1.1%
Rent to Value Ratio
Active
$228,000
2
bds
|
3
ba
|
1,530
sqft
|
built
1980
8209 SW 23rd Ct, North Lauderdale, FL 33068
$-451
Cash flow
-10.3%
Cash-on-Cash Return
3.8%
Cap rate
1.1%
Rent to Value Ratio
Active
$520,000
4
bds
|
3
ba
|
1,949
sqft
|
built
1971
1240 Stardust, North Lauderdale, FL 33068
$-415
Cash flow
-4.2%
Cash-on-Cash Return
5.2%
Cap rate
0.8%
Rent to Value Ratio
Active
$185,000
2
bds
|
2
ba
|
1,000
sqft
|
built
1980
1830 N Lauderdale Ave, North Lauderdale, FL 33068
$-734
Cash flow
-20.7%
Cash-on-Cash Return
1.4%
Cap rate
1.0%
Rent to Value Ratio

Active
$186,000
2
bds
|
2
ba
|
1,000
sqft
|
built
1979
1820 N Lauderdale Ave, North Lauderdale, FL 33068
$-608
Cash flow
-17.1%
Cash-on-Cash Return
2.2%
Cap rate
1.1%
Rent to Value Ratio

Active
$248,500
2
bds
|
2
ba
|
1,530
sqft
|
built
1980
8205 SW 23rd Ct, North Lauderdale, FL 33068
$-810
Cash flow
-17.0%
Cash-on-Cash Return
2.2%
Cap rate
0.9%
Rent to Value Ratio

Active
$245,000
2
bds
|
2
ba
|
1,530
sqft
|
built
1980
8203 SW 23rd Ct, North Lauderdale, FL 33068
$-654
Cash flow
-13.9%
Cash-on-Cash Return
2.9%
Cap rate
1.0%
Rent to Value Ratio
Active
$246,800
2
bds
|
2
ba
|
1,530
sqft
|
built
1980
8104 SW 23rd St, North Lauderdale, FL 33068
$-663
Cash flow
-14.0%
Cash-on-Cash Return
2.9%
Cap rate
1.0%
Rent to Value Ratio
Active
$314,000
3
bds
|
2
ba
|
1,186
sqft
|
built
1986
2035 Winners Cir, North Lauderdale, FL 33068
$-602
Cash flow
-10.0%
Cash-on-Cash Return
3.8%
Cap rate
0.7%
Rent to Value Ratio

Active
$150,000
1
bds
|
2
ba
|
830
sqft
|
built
1979
1800 N Lauderdale Ave, North Lauderdale, FL 33068
$-544
Cash flow
-18.9%
Cash-on-Cash Return
1.8%
Cap rate
1.1%
Rent to Value Ratio

Active
$159,000
1
bds
|
2
ba
|
830
sqft
|
built
1980
1830 N Lauderdale Ave, North Lauderdale, FL 33068
$-603
Cash flow
-19.8%
Cash-on-Cash Return
1.6%
Cap rate
1.0%
Rent to Value Ratio
Active
$400,000
3
bds
|
2
ba
|
1,170
sqft
|
built
1982
7808 SW 8th St, North Lauderdale, FL 33068
$-479
Cash flow
-6.2%
Cash-on-Cash Return
4.7%
Cap rate
0.8%
Rent to Value Ratio

Active
$215,000
2
bds
|
2
ba
|
1,102
sqft
|
built
1973
7501 Kimberly Blvd, North Lauderdale, FL 33068
$-297
Cash flow
-7.2%
Cash-on-Cash Return
4.5%
Cap rate
0.8%
Rent to Value Ratio

Active
$490,000
3
bds
|
2
ba
|
1,999
sqft
|
built
1977
8205 SW 12th Pl, North Lauderdale, FL 33068
$-582
Cash flow
-6.2%
Cash-on-Cash Return
4.7%
Cap rate
0.8%
Rent to Value Ratio
Active
$250,000
2
bds
|
2
ba
|
1,102
sqft
|
built
1974
7503 Kimberly Blvd, North Lauderdale, FL 33068
$-369
Cash flow
-7.7%
Cash-on-Cash Return
4.4%
Cap rate
0.8%
Rent to Value Ratio