North Miami, FL Investment Properties for Sale
Browse homes for sale and investment properties in North Miami, FL. Refine your search by price, property type, or more.
Best cash flowing properties in North Miami, FL
Active
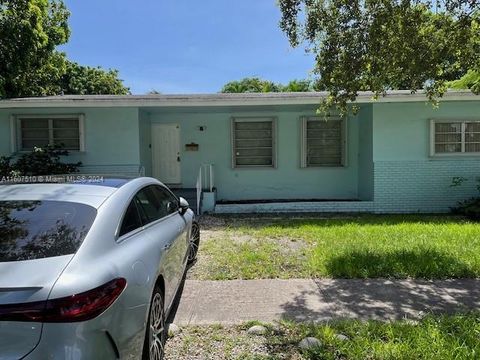
$340,000
2
bds
|
2
ba
|
1,146
sqft
|
built
1962
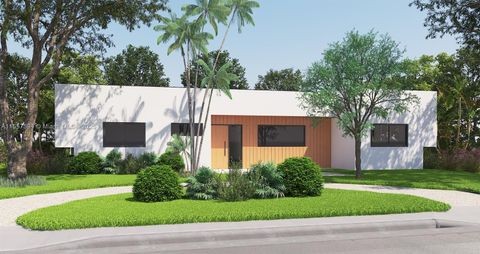
11930 NE 19th Dr, North Miami, FL 33181
$-186
Cash flow
-2.9%
Cash-on-Cash Return
5.6%
Cap rate
0.9%
Rent to Value Ratio
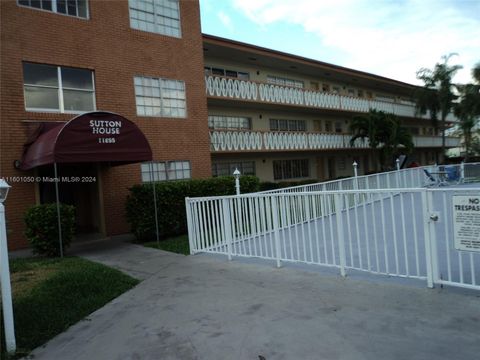
Active
$300,000
2
bds
|
2
ba
|
1,190
sqft
|
built
1972
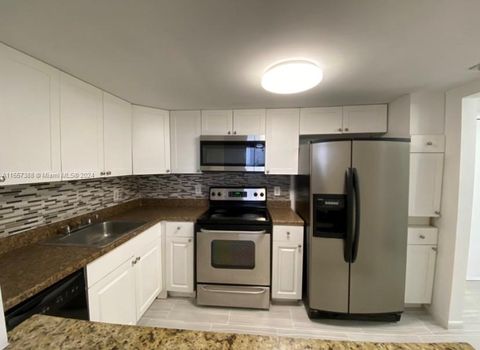
2450 NE 135th St, North Miami, FL 33181
$-199
Cash flow
-3.5%
Cash-on-Cash Return
5.5%
Cap rate
0.9%
Rent to Value Ratio
332 out of 352 properties for sale in North Miami, FL
Limited Results Shown
Create a free account, or log in to reveal all property listings and enjoy the complete experience.
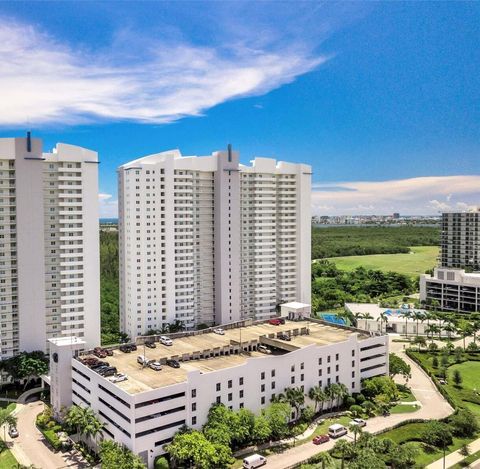
Active
$199,000
1
bds
|
2
ba
|
714
sqft
|
built
1971
1800 Sans Souci Blvd, North Miami, FL 33181
$-497
Cash flow
-13.0%
Cash-on-Cash Return
3.3%
Cap rate
0.9%
Rent to Value Ratio

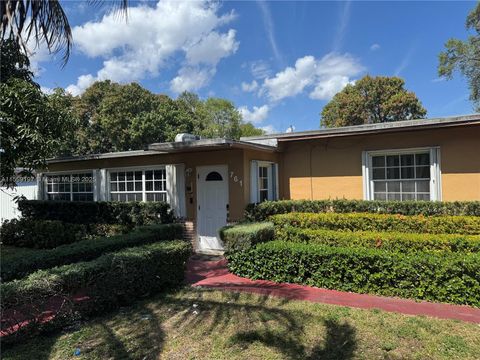
Active
$989,000
bds
|
0
ba
|
1,943
sqft
|
built
1953
540 NE 142nd St, North Miami, FL 33161
$-1,611
Cash flow
-8.5%
Cash-on-Cash Return
4.3%
Cap rate
0.6%
Rent to Value Ratio

Active
$1,475,000
4
bds
|
2
ba
|
2,028
sqft
|
built
1950
1910 N Hibiscus Dr, North Miami, FL 33181
$-3,709
Cash flow
-13.1%
Cash-on-Cash Return
3.2%
Cap rate
0.4%
Rent to Value Ratio

Active
$392,500
2
bds
|
2
ba
|
1,743
sqft
|
built
2007
14951 Royal Oaks Ln, North Miami, FL 33181
$-2,149
Cash flow
-28.6%
Cash-on-Cash Return
-0.3%
Cap rate
0.8%
Rent to Value Ratio

Pending
$299,000
2
bds
|
2
ba
|
1,148
sqft
|
built
1973
2500 NE 135th St, North Miami, FL 33181
$-900
Cash flow
-15.7%
Cash-on-Cash Return
2.7%
Cap rate
0.9%
Rent to Value Ratio
Active
$239,000
2
bds
|
2
ba
|
1,050
sqft
|
built
1973
13499 Biscayne Blvd, North Miami, FL 33181
$-777
Cash flow
-17.0%
Cash-on-Cash Return
2.4%
Cap rate
1.0%
Rent to Value Ratio

Active
$1,648,000
3
bds
|
3
ba
|
2,388
sqft
|
built
1963
11445 N Bayshore Dr, North Miami, FL 33181
$-3,174
Cash flow
-10.0%
Cash-on-Cash Return
4.0%
Cap rate
0.6%
Rent to Value Ratio
Active
$1,349,000
4
bds
|
2
ba
|
2,238
sqft
|
built
1952
2070 Alamanda Dr, North Miami, FL 33181
$-2,556
Cash flow
-9.9%
Cash-on-Cash Return
4.0%
Cap rate
0.5%
Rent to Value Ratio
Active
$239,000
2
bds
|
2
ba
|
900
sqft
|
built
1973
13499 Biscayne Blvd, North Miami, FL 33181
$-656
Cash flow
-14.3%
Cash-on-Cash Return
3.0%
Cap rate
1.0%
Rent to Value Ratio
Active
$239,000
2
bds
|
2
ba
|
1,050
sqft
|
built
1973
13499 Biscayne Blvd, North Miami, FL 33181
$-646
Cash flow
-14.1%
Cash-on-Cash Return
3.0%
Cap rate
1.0%
Rent to Value Ratio

Active
$239,000
2
bds
|
2
ba
|
1,050
sqft
|
built
1973
13499 Biscayne Blvd, North Miami, FL 33181
$-797
Cash flow
-17.4%
Cash-on-Cash Return
2.3%
Cap rate
1.0%
Rent to Value Ratio

Active
$100,000
1
bds
|
1
ba
|
878
sqft
|
built
1969
12590 NE 16th Ave, North Miami, FL 33161
$-1,263
Cash flow
-65.9%
Cash-on-Cash Return
-8.9%
Cap rate
1.7%
Rent to Value Ratio

Active
$500,000
2
bds
|
1
ba
|
1,084
sqft
|
built
1950
12365 NW 2nd Ave, North Miami, FL 33168
$-741
Cash flow
-7.7%
Cash-on-Cash Return
4.5%
Cap rate
0.6%
Rent to Value Ratio
Active
$429,000
2
bds
|
2
ba
|
1,304
sqft
|
built
1972
2150 Sans Souci Blvd, North Miami, FL 33181
$-1,341
Cash flow
-16.3%
Cash-on-Cash Return
2.5%
Cap rate
0.8%
Rent to Value Ratio
Active
$845,000
5
bds
|
2
ba
|
2,366
sqft
|
built
1963
12905 NE 4th Ave, North Miami, FL 33161
$-1,928
Cash flow
-11.9%
Cash-on-Cash Return
3.5%
Cap rate
0.4%
Rent to Value Ratio

Active
$137,000
1
bds
|
1
ba
|
0
sqft
|
built
1972
12500 NE 15th Ave, North Miami, FL 33161
$-231
Cash flow
-8.8%
Cash-on-Cash Return
4.2%
Cap rate
1.3%
Rent to Value Ratio

Active
$199,000
2
bds
|
2
ba
|
1,050
sqft
|
built
1973
13499 Biscayne Blvd, North Miami, FL 33181
$-1,180
Cash flow
-30.9%
Cash-on-Cash Return
-0.9%
Cap rate
1.0%
Rent to Value Ratio

Active
$210,000
1
bds
|
2
ba
|
673
sqft
|
built
1971
1805 Sans Souci Blvd, North Miami, FL 33181
$-681
Cash flow
-16.9%
Cash-on-Cash Return
2.4%
Cap rate
0.8%
Rent to Value Ratio

Active
$259,000
2
bds
|
2
ba
|
1,311
sqft
|
built
1963
11855 NE 19th Dr, North Miami, FL 33181
$-726
Cash flow
-14.6%
Cash-on-Cash Return
2.9%
Cap rate
0.9%
Rent to Value Ratio
Active
$279,000
2
bds
|
2
ba
|
1,287
sqft
|
built
1963
11855 NE 19th Dr, North Miami, FL 33181
$-816
Cash flow
-15.3%
Cash-on-Cash Return
2.8%
Cap rate
0.8%
Rent to Value Ratio
Active
$340,000
2
bds
|
2
ba
|
1,146
sqft
|
built
1962
11930 NE 19th Dr, North Miami, FL 33181
$-186
Cash flow
-2.9%
Cash-on-Cash Return
5.6%
Cap rate
0.9%
Rent to Value Ratio
Active
$395,900
2
bds
|
3
ba
|
1,603
sqft
|
built
2007
15051 Royal Oaks Ln, North Miami, FL 33181
$-2,357
Cash flow
-31.1%
Cash-on-Cash Return
-0.9%
Cap rate
0.7%
Rent to Value Ratio
Active
$698,900
5
bds
|
3
ba
|
2,460
sqft
|
built
1947
761 NE 139th St, North Miami, FL 33161
$-1,392
Cash flow
-10.4%
Cash-on-Cash Return
3.9%
Cap rate
0.6%
Rent to Value Ratio
Active
$119,900
1
bds
|
1
ba
|
878
sqft
|
built
1969
12590 NE 16th Ave, North Miami, FL 33161
$-1,016
Cash flow
-44.2%
Cash-on-Cash Return
-3.9%
Cap rate
1.5%
Rent to Value Ratio
Active
$119,900
1
bds
|
2
ba
|
882
sqft
|
built
1969
12590 NE 16th Ave, North Miami, FL 33161
$-940
Cash flow
-40.9%
Cash-on-Cash Return
-3.1%
Cap rate
1.3%
Rent to Value Ratio
Active
$119,900
1
bds
|
1
ba
|
882
sqft
|
built
1969
12590 NE 16th Ave, North Miami, FL 33161
$-1,047
Cash flow
-45.6%
Cash-on-Cash Return
-4.2%
Cap rate
1.3%
Rent to Value Ratio
Active
$259,000
1
bds
|
1
ba
|
666
sqft
|
built
1973
645 NE 121st St, North Miami, FL 33161
$-679
Cash flow
-13.7%
Cash-on-Cash Return
3.1%
Cap rate
0.8%
Rent to Value Ratio

Active
$290,000
2
bds
|
2
ba
|
963
sqft
|
built
1969
2020 NE 135th St, North Miami, FL 33181
$-1,010
Cash flow
-18.2%
Cash-on-Cash Return
2.1%
Cap rate
0.8%
Rent to Value Ratio
Active
$600,000
2
bds
|
1
ba
|
840
sqft
|
built
1940
1220 NE 128th St, North Miami, FL 33161
$-1,385
Cash flow
-12.0%
Cash-on-Cash Return
3.5%
Cap rate
0.5%
Rent to Value Ratio
Active
$300,000
2
bds
|
2
ba
|
1,190
sqft
|
built
1972
2450 NE 135th St, North Miami, FL 33181
$-199
Cash flow
-3.5%
Cash-on-Cash Return
5.5%
Cap rate
0.9%
Rent to Value Ratio

Active
$315,000
2
bds
|
2
ba
|
963
sqft
|
built
1969
2000 NE 135th St, North Miami, FL 33181
$-386
Cash flow
-6.4%
Cash-on-Cash Return
4.8%
Cap rate
0.7%
Rent to Value Ratio
Active
$320,000
2
bds
|
2
ba
|
963
sqft
|
built
1969
2000 NE 135th St, North Miami, FL 33181
$-336
Cash flow
-5.5%
Cash-on-Cash Return
5.0%
Cap rate
0.8%
Rent to Value Ratio
Active
$290,000
2
bds
|
2
ba
|
963
sqft
|
built
1969
2000 NE 135th St, North Miami, FL 33181
$-229
Cash flow
-4.1%
Cash-on-Cash Return
5.3%
Cap rate
0.8%
Rent to Value Ratio
Active
$315,000
2
bds
|
2
ba
|
963
sqft
|
built
1969
2020 NE 135th St, North Miami, FL 33181
$-303
Cash flow
-5.0%
Cash-on-Cash Return
5.1%
Cap rate
0.8%
Rent to Value Ratio

Active
$265,000
2
bds
|
2
ba
|
954
sqft
|
built
1971
1805 Sans Souci Blvd, North Miami, FL 33181
$-876
Cash flow
-17.2%
Cash-on-Cash Return
2.3%
Cap rate
0.9%
Rent to Value Ratio
Active
$270,000
2
bds
|
2
ba
|
1,250
sqft
|
built
1963
11840 NE 19th Dr, North Miami, FL 33181
$-801
Cash flow
-15.5%
Cash-on-Cash Return
2.7%
Cap rate
0.9%
Rent to Value Ratio

Active
$270,000
2
bds
|
2
ba
|
1,023
sqft
|
built
1971
1800 Sans Souci Blvd, North Miami, FL 33181
$-922
Cash flow
-17.8%
Cash-on-Cash Return
2.2%
Cap rate
0.9%
Rent to Value Ratio

Active
$98,900
1
bds
|
1
ba
|
725
sqft
|
built
1969
12590 NE 16th Ave, North Miami, FL 33161
$-780
Cash flow
-41.1%
Cash-on-Cash Return
-3.2%
Cap rate
1.7%
Rent to Value Ratio

Active
$97,500
1
bds
|
2
ba
|
882
sqft
|
built
1969
12590 NE 16th Ave, North Miami, FL 33161
$-685
Cash flow
-36.7%
Cash-on-Cash Return
-2.2%
Cap rate
1.8%
Rent to Value Ratio
Active
$265,000
2
bds
|
2
ba
|
1,260
sqft
|
built
1981
1470 NE 123rd St, North Miami, FL 33161
$-895
Cash flow
-17.6%
Cash-on-Cash Return
2.2%
Cap rate
1.0%
Rent to Value Ratio