North Miami, FL Investment Properties for Sale
Browse homes for sale and investment properties in North Miami, FL. Refine your search by price, property type, or more.
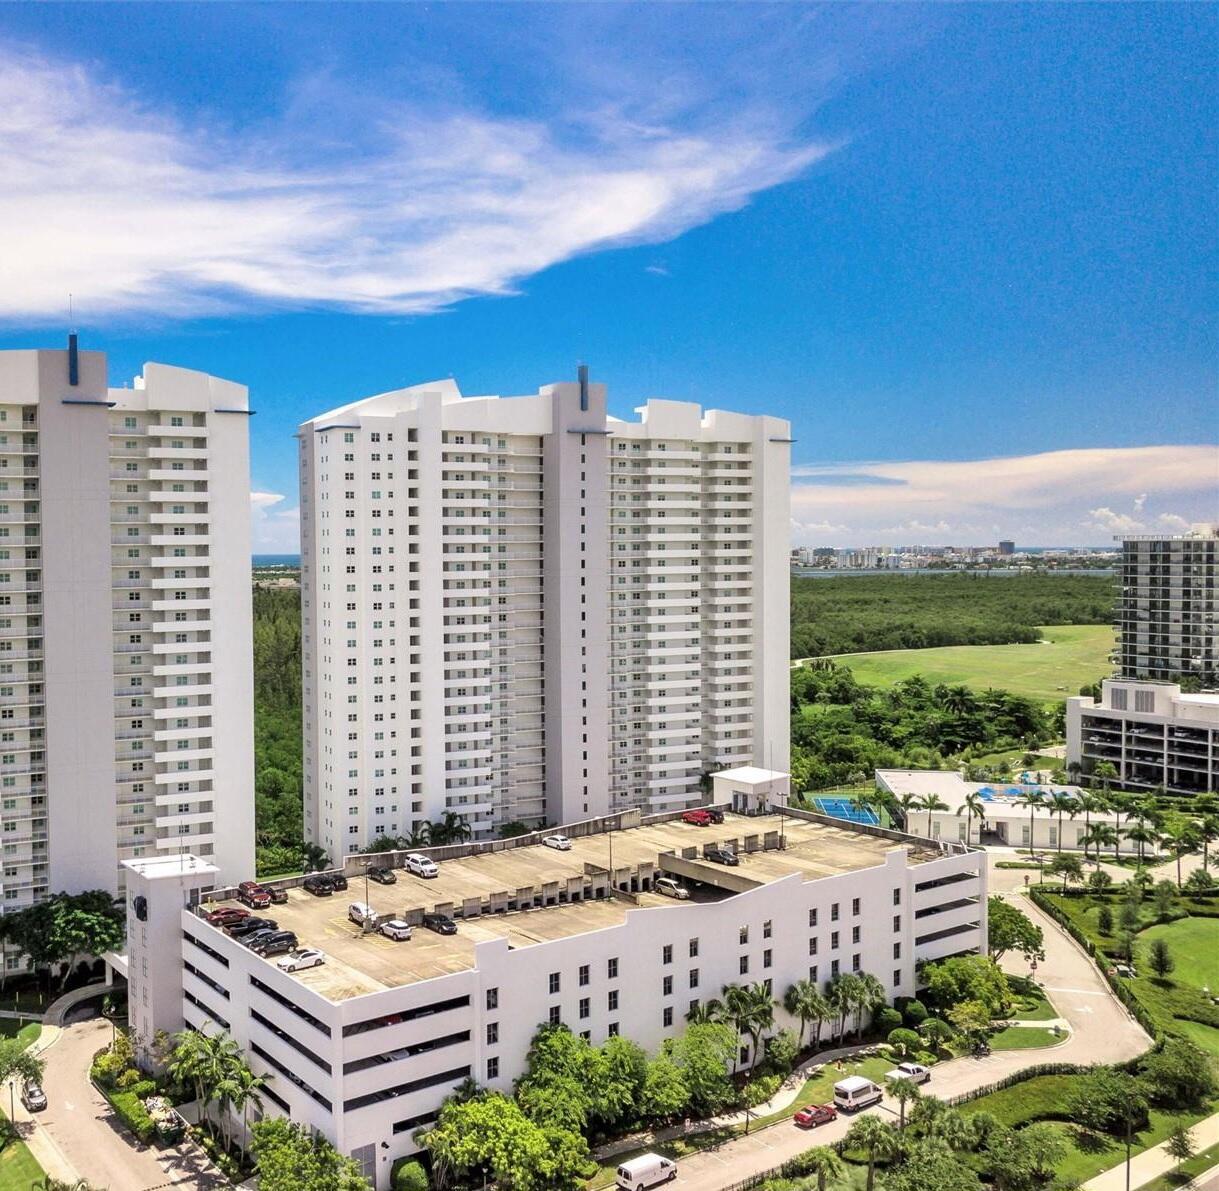
Best cash flowing properties in North Miami, FL
Active
$340,000
2
bds
|
2
ba
|
1,146
sqft
|
built
1962
11930 NE 19th Dr, North Miami, FL 33181
$-191
Cash flow
-2.9%
Cash-on-Cash Return
5.6%
Cap rate
0.9%
Rent to Value Ratio

Active
$300,000
2
bds
|
2
ba
|
1,190
sqft
|
built
1972
2450 NE 135th St, North Miami, FL 33181
$-204
Cash flow
-3.5%
Cash-on-Cash Return
5.5%
Cap rate
0.9%
Rent to Value Ratio
337 out of 357 properties for sale in North Miami, FL
Limited Results Shown
Create a free account, or log in to reveal all property listings and enjoy the complete experience.
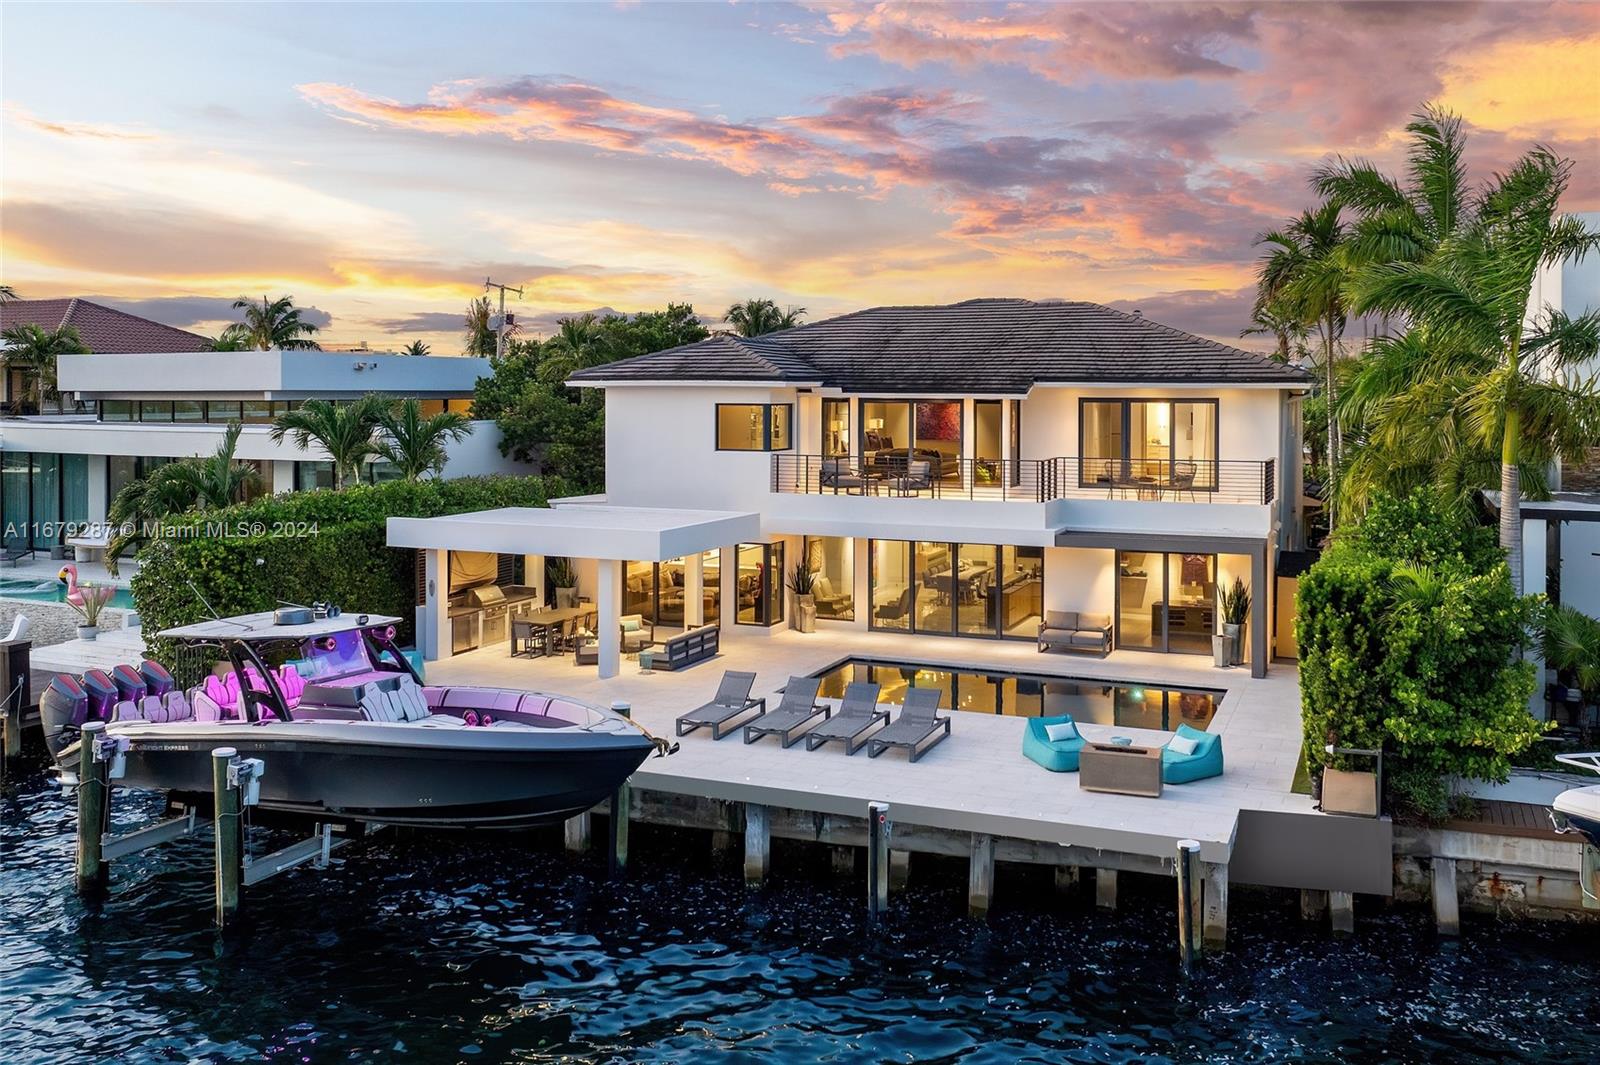
Active
$9,450,000
6
bds
|
7
ba
|
5,750
sqft
|
built
1956
2370 Bayview Ln, North Miami, FL 33181
$-46,957
Cash flow
-25.9%
Cash-on-Cash Return
0.3%
Cap rate
0.1%
Rent to Value Ratio
Active
$229,900
2
bds
|
2
ba
|
1,050
sqft
|
built
1973
13499 Biscayne Blvd, North Miami, FL 33181
$-1,095
Cash flow
-24.9%
Cash-on-Cash Return
0.6%
Cap rate
0.9%
Rent to Value Ratio

Active
$314,990
2
bds
|
2
ba
|
1,224
sqft
|
built
1962
11960 NE 19th Dr, North Miami, FL 33181
$-695
Cash flow
-11.5%
Cash-on-Cash Return
3.6%
Cap rate
0.8%
Rent to Value Ratio
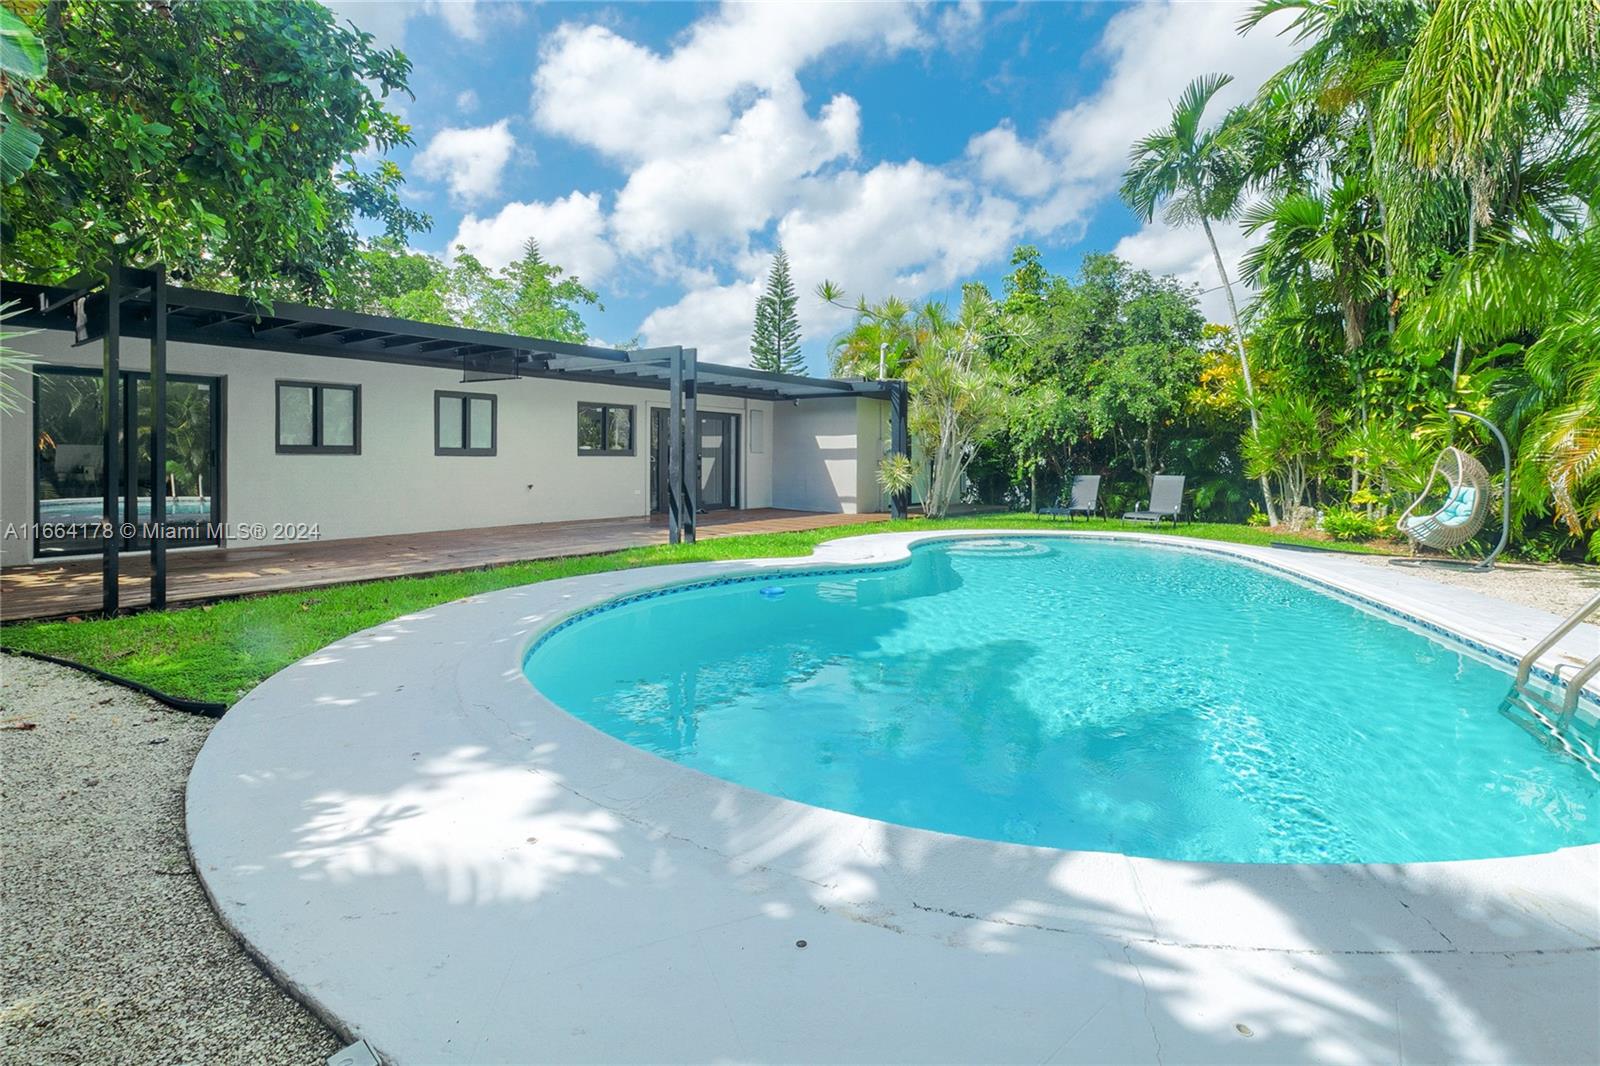
Active
$1,590,000
4
bds
|
3
ba
|
1,665
sqft
|
built
1950
1955 Alamanda Dr, North Miami, FL 33181
$-4,082
Cash flow
-13.4%
Cash-on-Cash Return
3.2%
Cap rate
0.6%
Rent to Value Ratio

Active
$199,000
1
bds
|
2
ba
|
714
sqft
|
built
1971
1800 Sans Souci Blvd, North Miami, FL 33181
$-500
Cash flow
-13.1%
Cash-on-Cash Return
3.3%
Cap rate
0.9%
Rent to Value Ratio
Active
$989,000
bds
|
0
ba
|
1,943
sqft
|
built
1953
540 NE 142nd St, North Miami, FL 33161
$-1,627
Cash flow
-8.6%
Cash-on-Cash Return
4.3%
Cap rate
0.6%
Rent to Value Ratio

Active
$1,475,000
4
bds
|
2
ba
|
2,028
sqft
|
built
1950
1910 N Hibiscus Dr, North Miami, FL 33181
$-3,732
Cash flow
-13.2%
Cash-on-Cash Return
3.2%
Cap rate
0.4%
Rent to Value Ratio
Active
$392,500
2
bds
|
2
ba
|
1,743
sqft
|
built
2007
14951 Royal Oaks Ln, North Miami, FL 33181
$-2,155
Cash flow
-28.6%
Cash-on-Cash Return
-0.3%
Cap rate
0.8%
Rent to Value Ratio

Pending
$299,000
2
bds
|
2
ba
|
1,148
sqft
|
built
1973
2500 NE 135th St, North Miami, FL 33181
$-905
Cash flow
-15.8%
Cash-on-Cash Return
2.7%
Cap rate
0.9%
Rent to Value Ratio

Active
$239,000
2
bds
|
2
ba
|
1,050
sqft
|
built
1973
13499 Biscayne Blvd, North Miami, FL 33181
$-781
Cash flow
-17.0%
Cash-on-Cash Return
2.4%
Cap rate
1.0%
Rent to Value Ratio
Active
$1,648,000
3
bds
|
3
ba
|
2,388
sqft
|
built
1963
11445 N Bayshore Dr, North Miami, FL 33181
$-3,200
Cash flow
-10.1%
Cash-on-Cash Return
4.0%
Cap rate
0.6%
Rent to Value Ratio

Active
$395,000
2
bds
|
1
ba
|
768
sqft
|
built
1951
1225 NW 127th St, North Miami, FL 33167
$-690
Cash flow
-9.1%
Cash-on-Cash Return
4.2%
Cap rate
0.6%
Rent to Value Ratio

Active
$1,349,000
4
bds
|
2
ba
|
2,238
sqft
|
built
1952
2070 Alamanda Dr, North Miami, FL 33181
$-2,577
Cash flow
-10.0%
Cash-on-Cash Return
4.0%
Cap rate
0.5%
Rent to Value Ratio
Active
$239,000
2
bds
|
2
ba
|
900
sqft
|
built
1973
13499 Biscayne Blvd, North Miami, FL 33181
$-660
Cash flow
-14.4%
Cash-on-Cash Return
3.0%
Cap rate
1.0%
Rent to Value Ratio

Active
$239,000
2
bds
|
2
ba
|
1,050
sqft
|
built
1973
13499 Biscayne Blvd, North Miami, FL 33181
$-650
Cash flow
-14.2%
Cash-on-Cash Return
3.0%
Cap rate
1.0%
Rent to Value Ratio

Active
$239,000
2
bds
|
2
ba
|
1,050
sqft
|
built
1973
13499 Biscayne Blvd, North Miami, FL 33181
$-801
Cash flow
-17.5%
Cash-on-Cash Return
2.3%
Cap rate
1.0%
Rent to Value Ratio

Active
$100,000
1
bds
|
1
ba
|
878
sqft
|
built
1969
12590 NE 16th Ave, North Miami, FL 33161
$-1,265
Cash flow
-66.0%
Cash-on-Cash Return
-8.9%
Cap rate
1.7%
Rent to Value Ratio
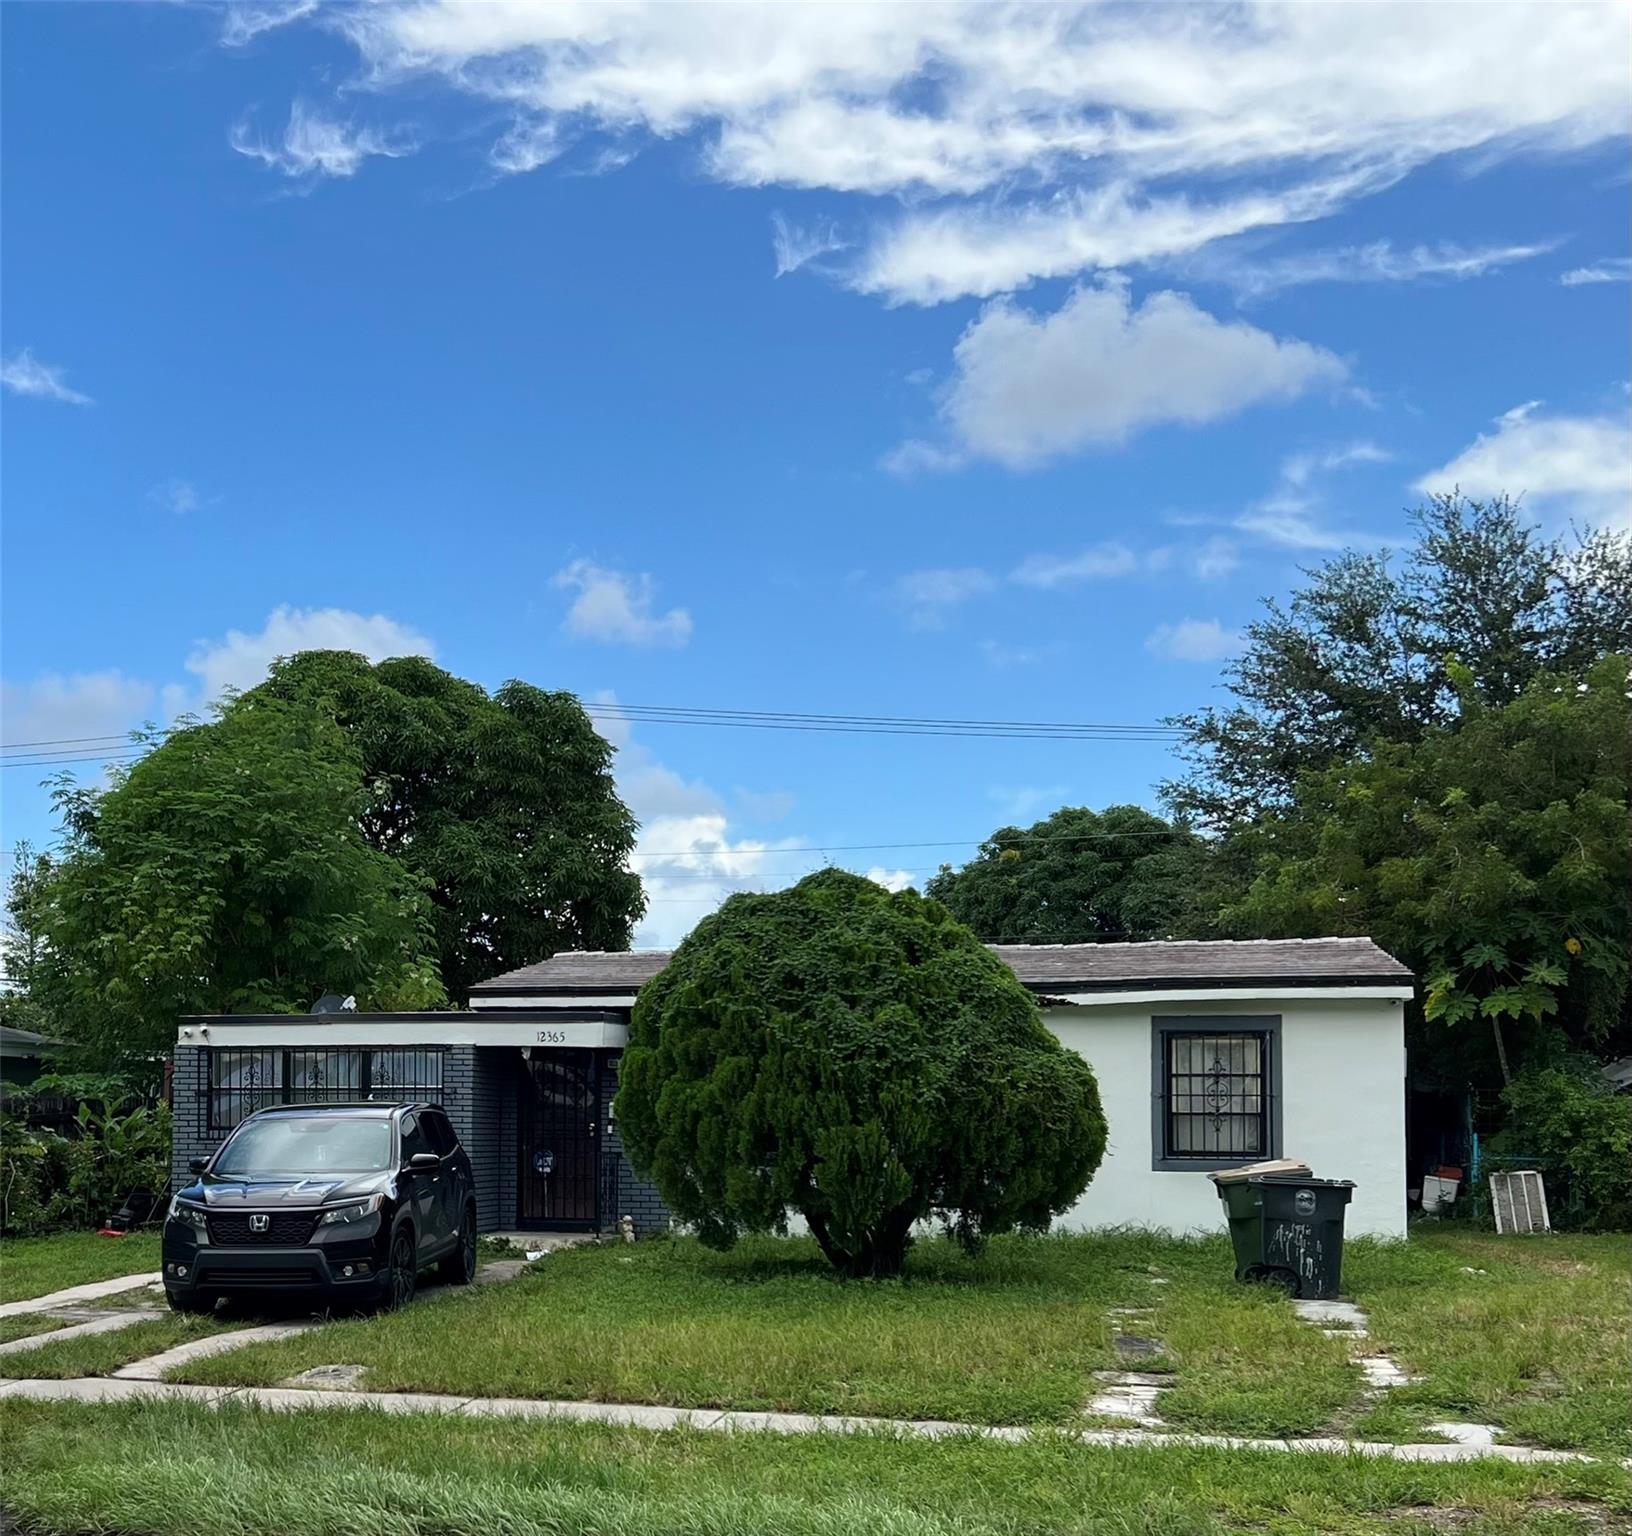
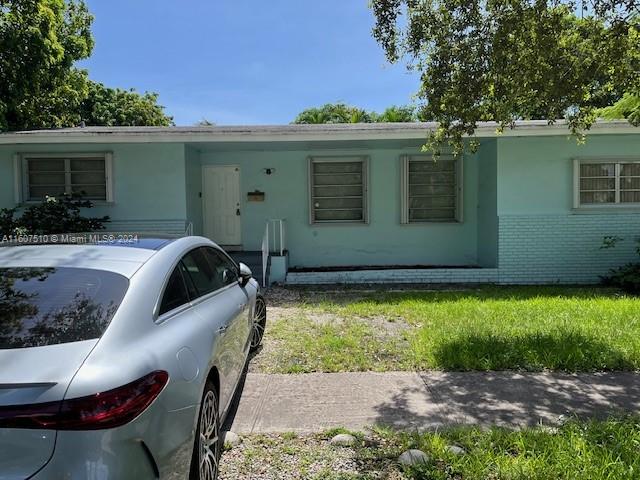
Active
$500,000
2
bds
|
1
ba
|
1,084
sqft
|
built
1950
12365 NW 2nd Ave, North Miami, FL 33168
$-749
Cash flow
-7.8%
Cash-on-Cash Return
4.5%
Cap rate
0.6%
Rent to Value Ratio

Active
$429,000
2
bds
|
2
ba
|
1,304
sqft
|
built
1972
2150 Sans Souci Blvd, North Miami, FL 33181
$-1,348
Cash flow
-16.4%
Cash-on-Cash Return
2.5%
Cap rate
0.8%
Rent to Value Ratio
Active
$845,000
5
bds
|
2
ba
|
2,366
sqft
|
built
1963
12905 NE 4th Ave, North Miami, FL 33161
$-1,941
Cash flow
-12.0%
Cash-on-Cash Return
3.5%
Cap rate
0.4%
Rent to Value Ratio

Active
$137,000
1
bds
|
1
ba
|
0
sqft
|
built
1972
12500 NE 15th Ave, North Miami, FL 33161
$-233
Cash flow
-8.9%
Cash-on-Cash Return
4.2%
Cap rate
1.3%
Rent to Value Ratio
Active
$199,000
2
bds
|
2
ba
|
1,050
sqft
|
built
1973
13499 Biscayne Blvd, North Miami, FL 33181
$-1,183
Cash flow
-31.0%
Cash-on-Cash Return
-0.9%
Cap rate
1.0%
Rent to Value Ratio

Active
$210,000
1
bds
|
2
ba
|
673
sqft
|
built
1971
1805 Sans Souci Blvd, North Miami, FL 33181
$-685
Cash flow
-17.0%
Cash-on-Cash Return
2.4%
Cap rate
0.8%
Rent to Value Ratio
Active
$259,000
2
bds
|
2
ba
|
1,311
sqft
|
built
1963
11855 NE 19th Dr, North Miami, FL 33181
$-730
Cash flow
-14.7%
Cash-on-Cash Return
2.9%
Cap rate
0.9%
Rent to Value Ratio

Active
$279,000
2
bds
|
2
ba
|
1,287
sqft
|
built
1963
11855 NE 19th Dr, North Miami, FL 33181
$-820
Cash flow
-15.3%
Cash-on-Cash Return
2.8%
Cap rate
0.8%
Rent to Value Ratio
Active
$340,000
2
bds
|
2
ba
|
1,146
sqft
|
built
1962
11930 NE 19th Dr, North Miami, FL 33181
$-191
Cash flow
-2.9%
Cash-on-Cash Return
5.6%
Cap rate
0.9%
Rent to Value Ratio
Active
$395,900
2
bds
|
3
ba
|
1,603
sqft
|
built
2007
15051 Royal Oaks Ln, North Miami, FL 33181
$-2,363
Cash flow
-31.1%
Cash-on-Cash Return
-0.9%
Cap rate
0.7%
Rent to Value Ratio

Active
$698,900
5
bds
|
3
ba
|
2,460
sqft
|
built
1947
761 NE 139th St, North Miami, FL 33161
$-1,403
Cash flow
-10.5%
Cash-on-Cash Return
3.9%
Cap rate
0.6%
Rent to Value Ratio

Active
$119,900
1
bds
|
1
ba
|
878
sqft
|
built
1969
12590 NE 16th Ave, North Miami, FL 33161
$-1,018
Cash flow
-44.3%
Cash-on-Cash Return
-3.9%
Cap rate
1.5%
Rent to Value Ratio
Active
$119,900
1
bds
|
2
ba
|
882
sqft
|
built
1969
12590 NE 16th Ave, North Miami, FL 33161
$-942
Cash flow
-41.0%
Cash-on-Cash Return
-3.1%
Cap rate
1.3%
Rent to Value Ratio

Active
$119,900
1
bds
|
1
ba
|
882
sqft
|
built
1969
12590 NE 16th Ave, North Miami, FL 33161
$-1,049
Cash flow
-45.6%
Cash-on-Cash Return
-4.2%
Cap rate
1.3%
Rent to Value Ratio
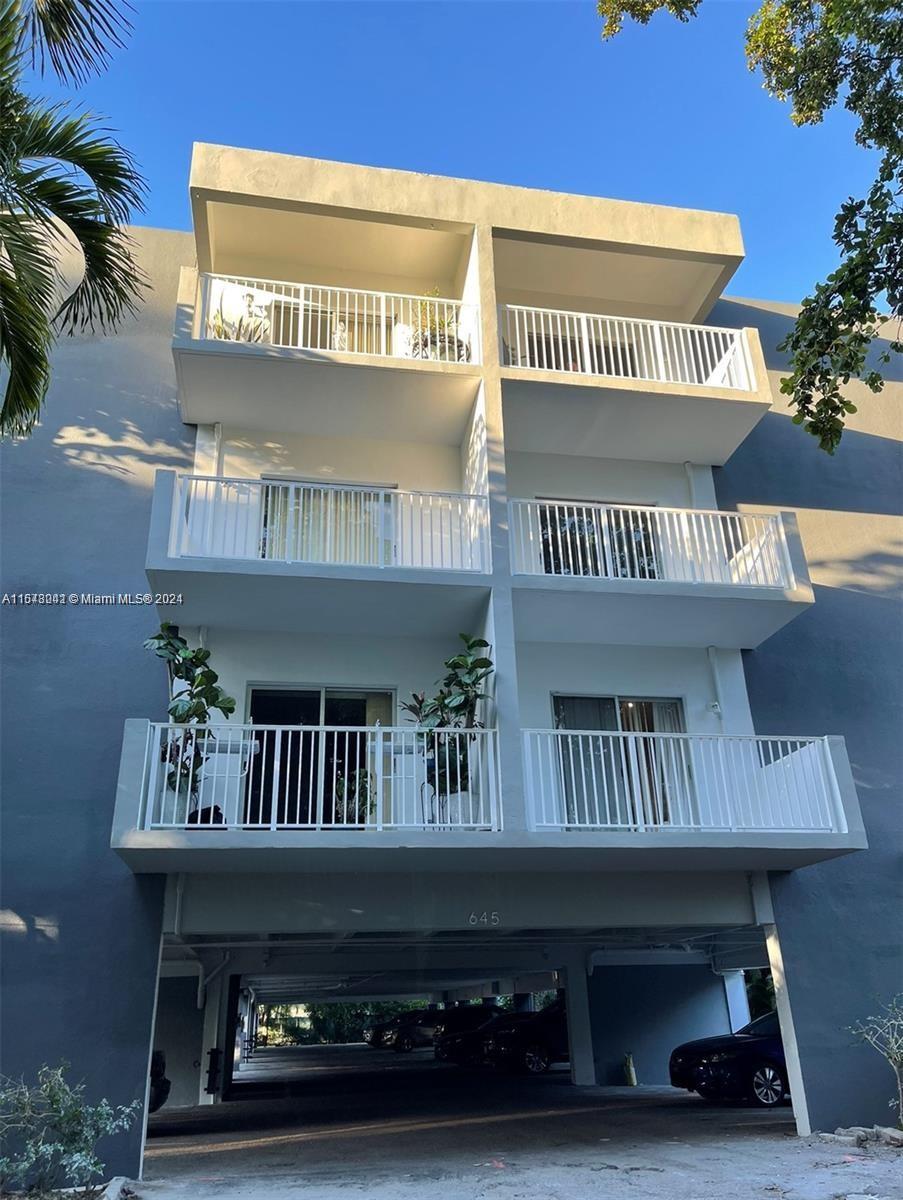
Active
$259,000
1
bds
|
1
ba
|
666
sqft
|
built
1973
645 NE 121st St, North Miami, FL 33161
$-683
Cash flow
-13.8%
Cash-on-Cash Return
3.1%
Cap rate
0.8%
Rent to Value Ratio

Active
$299,000
2
bds
|
2
ba
|
963
sqft
|
built
1969
2020 NE 135th St, North Miami, FL 33181
$-1,062
Cash flow
-18.5%
Cash-on-Cash Return
2.0%
Cap rate
0.8%
Rent to Value Ratio
Active
$600,000
2
bds
|
1
ba
|
840
sqft
|
built
1940
1220 NE 128th St, North Miami, FL 33161
$-1,395
Cash flow
-12.1%
Cash-on-Cash Return
3.5%
Cap rate
0.5%
Rent to Value Ratio
Active
$300,000
2
bds
|
2
ba
|
1,190
sqft
|
built
1972
2450 NE 135th St, North Miami, FL 33181
$-204
Cash flow
-3.5%
Cash-on-Cash Return
5.5%
Cap rate
0.9%
Rent to Value Ratio

Active
$315,000
2
bds
|
2
ba
|
963
sqft
|
built
1969
2000 NE 135th St, North Miami, FL 33181
$-391
Cash flow
-6.5%
Cash-on-Cash Return
4.8%
Cap rate
0.7%
Rent to Value Ratio
Active
$320,000
2
bds
|
2
ba
|
963
sqft
|
built
1969
2000 NE 135th St, North Miami, FL 33181
$-341
Cash flow
-5.6%
Cash-on-Cash Return
5.0%
Cap rate
0.8%
Rent to Value Ratio
Active
$290,000
2
bds
|
2
ba
|
963
sqft
|
built
1969
2000 NE 135th St, North Miami, FL 33181
$-234
Cash flow
-4.2%
Cash-on-Cash Return
5.3%
Cap rate
0.8%
Rent to Value Ratio
Active
$315,000
2
bds
|
2
ba
|
963
sqft
|
built
1969
2020 NE 135th St, North Miami, FL 33181
$-308
Cash flow
-5.1%
Cash-on-Cash Return
5.1%
Cap rate
0.8%
Rent to Value Ratio
Active
$265,000
2
bds
|
2
ba
|
954
sqft
|
built
1971
1805 Sans Souci Blvd, North Miami, FL 33181
$-881
Cash flow
-17.3%
Cash-on-Cash Return
2.3%
Cap rate
0.9%
Rent to Value Ratio