Nevada Investment Properties for Sale
Browse homes for sale and investment properties in Nevada. Refine your search by price, property type, or more.
Best cash flowing properties in Nevada
Active
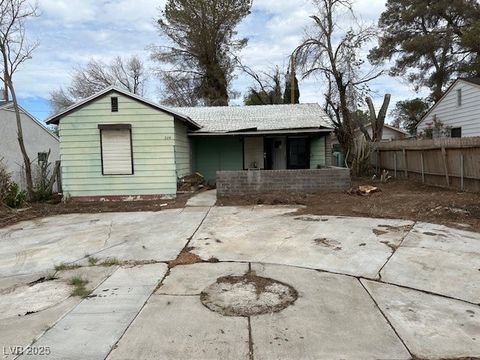
$249,900
2
bds
|
1
ba
|
1,256
sqft
|
built
1945
524 5th St, Boulder City, NV 89005
$-134
Cash flow
-2.8%
Cash-on-Cash Return
5.6%
Cap rate
0.7%
Rent to Value Ratio

Active
$119,000
1
bds
|
1
ba
|
572
sqft
|
built
1990
3550 Bay Sands Dr, Laughlin, NV 89029
$-262
Cash flow
-11.5%
Cash-on-Cash Return
3.6%
Cap rate
0.8%
Rent to Value Ratio
8,710 out of 9,114 properties for sale in Nevada
Limited Results Shown
Create a free account, or log in to reveal all property listings and enjoy the complete experience.

Active
$319,900
3
bds
|
3
ba
|
1,369
sqft
|
built
1985
3008 Soledad Dr, Laughlin, NV 89029
$-669
Cash flow
-10.9%
Cash-on-Cash Return
3.8%
Cap rate
0.5%
Rent to Value Ratio
Active
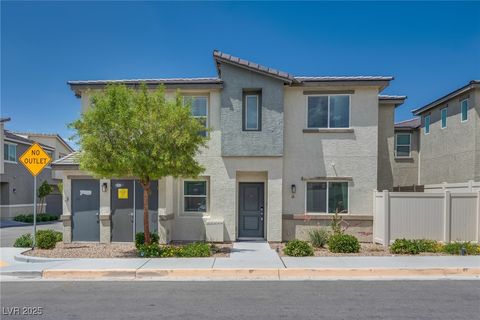
$350,000
3
bds
|
2
ba
|
1,273
sqft
|
built
2020
12110 Midnight Pine Rd, Las Vegas, NV 89183
$-1,068
Cash flow
-15.9%
Cash-on-Cash Return
2.6%
Cap rate
0.5%
Rent to Value Ratio
Active
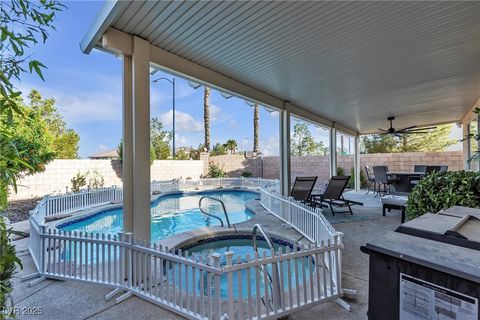
$559,000
4
bds
|
3
ba
|
1,957
sqft
|
built
2000
3194 Lapis Beach Dr, Las Vegas, NV 89117
$-1,463
Cash flow
-13.7%
Cash-on-Cash Return
3.1%
Cap rate
0.4%
Rent to Value Ratio
Active
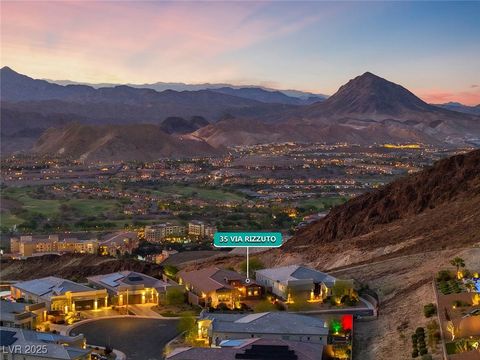
$1,299,000
4
bds
|
4
ba
|
3,123
sqft
|
built
2018
35 Via Rizzuto, Henderson, NV 89011
$-4,845
Cash flow
-19.5%
Cash-on-Cash Return
1.8%
Cap rate
0.3%
Rent to Value Ratio
Active
$600,000
4
bds
|
4
ba
|
3,078
sqft
|
built
2021
1213 Granite Falls Pl, North Las Vegas, NV 89084
$-1,826
Cash flow
-15.9%
Cash-on-Cash Return
2.6%
Cap rate
0.5%
Rent to Value Ratio

Active
$425,000
4
bds
|
3
ba
|
2,247
sqft
|
built
1997
4507 Golden Palomino Ln, North Las Vegas, NV 89032
$-867
Cash flow
-10.6%
Cash-on-Cash Return
3.8%
Cap rate
0.5%
Rent to Value Ratio
Active
$650,000
4
bds
|
3
ba
|
2,100
sqft
|
built
2000
1200 Dream Bridge Dr, Las Vegas, NV 89144
$-1,559
Cash flow
-12.5%
Cash-on-Cash Return
3.4%
Cap rate
0.5%
Rent to Value Ratio

Active
$7,650,000
2
bds
|
3
ba
|
1,894
sqft
|
built
2021
11665 Summit Club Dr, Las Vegas, NV 89135
$-41,078
Cash flow
-28.0%
Cash-on-Cash Return
-0.2%
Cap rate
0.1%
Rent to Value Ratio

Active
$519,000
5
bds
|
3
ba
|
2,643
sqft
|
built
2022
3815 Corellia Ave, North Las Vegas, NV 89084
$-1,484
Cash flow
-14.9%
Cash-on-Cash Return
2.8%
Cap rate
0.5%
Rent to Value Ratio

Active
$2,798,000
5
bds
|
9
ba
|
7,340
sqft
|
built
1997
2338 Dolphin Ct, Henderson, NV 89074
$-10,647
Cash flow
-19.9%
Cash-on-Cash Return
1.7%
Cap rate
0.3%
Rent to Value Ratio

Active
$380,000
2
bds
|
2
ba
|
1,220
sqft
|
built
1972
3077 Pinehurst Dr, Las Vegas, NV 89109
$-1,088
Cash flow
-14.9%
Cash-on-Cash Return
2.8%
Cap rate
0.5%
Rent to Value Ratio
Active
$2,999,999
7
bds
|
7
ba
|
6,433
sqft
|
built
2006
2780 El Camino Rd, Las Vegas, NV 89146
$-8,780
Cash flow
-15.3%
Cash-on-Cash Return
2.8%
Cap rate
0.4%
Rent to Value Ratio

Active
$159,900
1
bds
|
1
ba
|
668
sqft
|
built
1989
5114 S Jones Blvd, Las Vegas, NV 89118
$-444
Cash flow
-14.5%
Cash-on-Cash Return
2.9%
Cap rate
0.7%
Rent to Value Ratio
Active
$525,000
3
bds
|
3
ba
|
1,792
sqft
|
built
1987
2716 Knightsbridge Rd, Henderson, NV 89074
$-1,233
Cash flow
-12.3%
Cash-on-Cash Return
3.4%
Cap rate
0.5%
Rent to Value Ratio
Active
$214,999
2
bds
|
2
ba
|
934
sqft
|
built
1997
7885 W Flamingo Rd, Las Vegas, NV 89147
$-632
Cash flow
-15.3%
Cash-on-Cash Return
2.7%
Cap rate
0.7%
Rent to Value Ratio
Active
$512,000
5
bds
|
3
ba
|
3,113
sqft
|
built
2009
41 Stablewood Ct, North Las Vegas, NV 89084
$-1,206
Cash flow
-12.3%
Cash-on-Cash Return
3.4%
Cap rate
0.5%
Rent to Value Ratio
Active
$225,000
2
bds
|
2
ba
|
920
sqft
|
built
1989
5162 S Jones Blvd, Las Vegas, NV 89118
$-558
Cash flow
-12.9%
Cash-on-Cash Return
3.3%
Cap rate
0.6%
Rent to Value Ratio

Active
$599,900
5
bds
|
3
ba
|
2,703
sqft
|
built
1995
3646 Billman Ave, Las Vegas, NV 89121
$-1,608
Cash flow
-14.0%
Cash-on-Cash Return
3.0%
Cap rate
0.4%
Rent to Value Ratio

Active
$200,000
2
bds
|
2
ba
|
912
sqft
|
built
1986
809 Rock Springs Dr, Las Vegas, NV 89128
$-410
Cash flow
-10.7%
Cash-on-Cash Return
3.8%
Cap rate
0.7%
Rent to Value Ratio

Active
$410,500
2
bds
|
2
ba
|
1,410
sqft
|
built
2000
10710 Destination Ln, Las Vegas, NV 89144
$-1,215
Cash flow
-15.4%
Cash-on-Cash Return
2.7%
Cap rate
0.5%
Rent to Value Ratio
Active
$439,000
3
bds
|
3
ba
|
1,680
sqft
|
built
2013
1185 Via Dimartini, Henderson, NV 89052
$-1,258
Cash flow
-15.0%
Cash-on-Cash Return
2.8%
Cap rate
0.5%
Rent to Value Ratio
Active
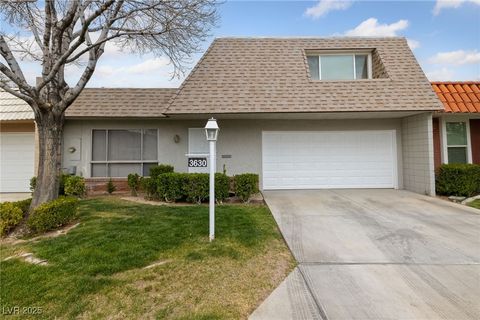
$385,000
3
bds
|
2
ba
|
1,650
sqft
|
built
1971
3630 Mc Kinley Ave, Las Vegas, NV 89121
$-1,090
Cash flow
-14.8%
Cash-on-Cash Return
2.9%
Cap rate
0.5%
Rent to Value Ratio
Active
$250,000
2
bds
|
2
ba
|
1,004
sqft
|
built
1983
2212 Sunfish Dr, Henderson, NV 89014
$-735
Cash flow
-15.3%
Cash-on-Cash Return
2.7%
Cap rate
0.6%
Rent to Value Ratio

Active
$265,500
2
bds
|
2
ba
|
938
sqft
|
built
2003
45 Maleena Mesa St, Henderson, NV 89074
$-681
Cash flow
-13.4%
Cash-on-Cash Return
3.2%
Cap rate
0.5%
Rent to Value Ratio
Active
$199,900
2
bds
|
2
ba
|
897
sqft
|
built
1982
1303 Darlene Way, Boulder City, NV 89005
$-430
Cash flow
-11.2%
Cash-on-Cash Return
3.7%
Cap rate
0.7%
Rent to Value Ratio
Active
$249,900
2
bds
|
1
ba
|
1,256
sqft
|
built
1945
524 5th St, Boulder City, NV 89005
$-134
Cash flow
-2.8%
Cash-on-Cash Return
5.6%
Cap rate
0.7%
Rent to Value Ratio
Active
$579,000
3
bds
|
2
ba
|
2,120
sqft
|
built
2015
766 Topocoba St, Las Vegas, NV 89178
$-1,689
Cash flow
-15.2%
Cash-on-Cash Return
2.8%
Cap rate
0.4%
Rent to Value Ratio
Active
$315,000
3
bds
|
2
ba
|
1,533
sqft
|
built
2016
5338 Lignum Ave, Pahrump, NV 89061
$-562
Cash flow
-9.3%
Cash-on-Cash Return
4.1%
Cap rate
0.6%
Rent to Value Ratio
Active
$485,000
4
bds
|
2
ba
|
1,851
sqft
|
built
1996
8217 Ashkum Ave, Las Vegas, NV 89149
$-1,146
Cash flow
-12.3%
Cash-on-Cash Return
3.4%
Cap rate
0.5%
Rent to Value Ratio
Active
$119,000
1
bds
|
1
ba
|
572
sqft
|
built
1990
3550 Bay Sands Dr, Laughlin, NV 89029
$-262
Cash flow
-11.5%
Cash-on-Cash Return
3.6%
Cap rate
0.8%
Rent to Value Ratio

Active
$435,000
4
bds
|
3
ba
|
1,892
sqft
|
built
2021
4109 Cloudless Ave, North Las Vegas, NV 89081
$-955
Cash flow
-11.5%
Cash-on-Cash Return
3.6%
Cap rate
0.5%
Rent to Value Ratio

Active
$259,000
2
bds
|
3
ba
|
1,440
sqft
|
built
1980
1312 Rawhide St, Las Vegas, NV 89119
$-567
Cash flow
-11.4%
Cash-on-Cash Return
3.6%
Cap rate
0.6%
Rent to Value Ratio

Active
$375,000
2
bds
|
2
ba
|
1,305
sqft
|
built
1997
8737 Red Brook Dr, Las Vegas, NV 89128
$-1,119
Cash flow
-15.6%
Cash-on-Cash Return
2.7%
Cap rate
0.5%
Rent to Value Ratio
Active
$244,500
2
bds
|
1
ba
|
969
sqft
|
built
1996
1830 N Buffalo Dr, Las Vegas, NV 89128
$-488
Cash flow
-10.4%
Cash-on-Cash Return
3.9%
Cap rate
0.7%
Rent to Value Ratio

Active
$424,750
3
bds
|
3
ba
|
1,646
sqft
|
built
2021
2924 Sunday Silence Rd, North Las Vegas, NV 89086
$-1,194
Cash flow
-14.7%
Cash-on-Cash Return
2.9%
Cap rate
0.5%
Rent to Value Ratio

Active
$375,000
3
bds
|
3
ba
|
1,665
sqft
|
built
2021
2682 Weathered Copper Ave, North Las Vegas, NV 89086
$-1,083
Cash flow
-15.1%
Cash-on-Cash Return
2.8%
Cap rate
0.5%
Rent to Value Ratio
Active
$495,000
4
bds
|
4
ba
|
2,044
sqft
|
built
2020
105 Campbelltown Ave, Henderson, NV 89015
$-1,374
Cash flow
-14.5%
Cash-on-Cash Return
2.9%
Cap rate
0.5%
Rent to Value Ratio

Active
$385,000
4
bds
|
3
ba
|
1,603
sqft
|
built
2019
369 Stone Fly Rd, North Las Vegas, NV 89032
$-1,014
Cash flow
-13.7%
Cash-on-Cash Return
3.1%
Cap rate
0.5%
Rent to Value Ratio
Active
$249,999
2
bds
|
2
ba
|
912
sqft
|
built
1991
7961 Lions Rock Way, Las Vegas, NV 89128
$-683
Cash flow
-14.3%
Cash-on-Cash Return
3.0%
Cap rate
0.5%
Rent to Value Ratio
Active
$549,000
4
bds
|
3
ba
|
2,309
sqft
|
built
2014
7246 Spring Flower Ave, Las Vegas, NV 89117
$-1,599
Cash flow
-15.2%
Cash-on-Cash Return
2.8%
Cap rate
0.5%
Rent to Value Ratio