Nevada Investment Properties for Sale
Browse homes for sale and investment properties in Nevada. Refine your search by price, property type, or more.
Best cash flowing properties in Nevada

Active
$175,000
2
bds
|
2
ba
|
1,208
sqft
|
built
1994
3550 Bay Sands Dr, Laughlin, NV 89029
$-255
Cash flow
-7.6%
Cash-on-Cash Return
3.9%
Cap rate
0.8%
Rent to Value Ratio

Active
$154,900
2
bds
|
1
ba
|
999
sqft
|
built
2011
3550 Bay Sands Dr, Laughlin, NV 89029
$-281
Cash flow
-9.5%
Cash-on-Cash Return
3.5%
Cap rate
0.8%
Rent to Value Ratio
7,675 out of 8,025 properties for sale in Nevada
Limited Results Shown
Create a free account, or log in to reveal all property listings and enjoy the complete experience.
Active
$1,149,498
4
bds
|
3
ba
|
2,559
sqft
|
built
1989
8610 Mohawk St, Las Vegas, NV 89139
$-3,290
Cash flow
-14.9%
Cash-on-Cash Return
2.2%
Cap rate
0.3%
Rent to Value Ratio

Active
$9,650,000
5
bds
|
7
ba
|
10,948
sqft
|
built
2011
34 Meadowhawk Ln, Las Vegas, NV 89135
$-42,964
Cash flow
-23.2%
Cash-on-Cash Return
0.3%
Cap rate
0.1%
Rent to Value Ratio
Active
$1,250,000
3
bds
|
2
ba
|
1,820
sqft
|
built
1973
1595 E Camero Ave, Las Vegas, NV 89123
$-3,667
Cash flow
-15.3%
Cash-on-Cash Return
2.2%
Cap rate
0.3%
Rent to Value Ratio
Active
$899,999
4
bds
|
3
ba
|
2,578
sqft
|
built
2017
426 Port Reggio St, Las Vegas, NV 89138
$-1,601
Cash flow
-9.3%
Cash-on-Cash Return
3.5%
Cap rate
0.5%
Rent to Value Ratio
Pending
$1,425,000
4
bds
|
3
ba
|
3,626
sqft
|
built
2015
10433 Ember Rose Ave, Las Vegas, NV 89135
$-3,310
Cash flow
-12.1%
Cash-on-Cash Return
2.9%
Cap rate
0.4%
Rent to Value Ratio

Active
$1,185,000
4
bds
|
4
ba
|
3,794
sqft
|
built
1997
3290 Vicki Ave, Las Vegas, NV 89139
$-3,209
Cash flow
-14.1%
Cash-on-Cash Return
2.4%
Cap rate
0.3%
Rent to Value Ratio

Active
$1,049,000
4
bds
|
4
ba
|
3,036
sqft
|
built
1975
8970 W Lone Mountain Rd, Las Vegas, NV 89129
$-3,076
Cash flow
-15.3%
Cash-on-Cash Return
2.2%
Cap rate
0.3%
Rent to Value Ratio

Active
$1,250,000
4
bds
|
5
ba
|
4,275
sqft
|
built
2006
3662 Riley Ann Ave, Las Vegas, NV 89139
$-3,001
Cash flow
-12.5%
Cash-on-Cash Return
2.8%
Cap rate
0.4%
Rent to Value Ratio

Active
$28,000,000
6
bds
|
9
ba
|
11,974
sqft
|
built
2022
10911 Discovery Peak Ct, Las Vegas, NV 89135
$-132,230
Cash flow
-24.6%
Cash-on-Cash Return
0.0%
Cap rate
0.0%
Rent to Value Ratio

Active
$1,275,000
3
bds
|
3
ba
|
2,497
sqft
|
built
2006
9201 Tesoras Dr, Las Vegas, NV 89144
$-2,986
Cash flow
-12.2%
Cash-on-Cash Return
2.9%
Cap rate
0.5%
Rent to Value Ratio

Active
$2,147,000
4
bds
|
4
ba
|
3,355
sqft
|
built
2020
10004 Terrastone Dr, Las Vegas, NV 89148
$-5,012
Cash flow
-12.2%
Cash-on-Cash Return
2.9%
Cap rate
0.4%
Rent to Value Ratio
Active
$1,999,888
5
bds
|
6
ba
|
4,512
sqft
|
built
2021
212 Harris Peak St, Las Vegas, NV 89138
$-5,674
Cash flow
-14.8%
Cash-on-Cash Return
2.3%
Cap rate
0.4%
Rent to Value Ratio
Active
$2,799,000
4
bds
|
4
ba
|
4,693
sqft
|
built
2004
11503 Glowing Sunset Ln, Las Vegas, NV 89135
$-5,880
Cash flow
-11.0%
Cash-on-Cash Return
3.2%
Cap rate
0.4%
Rent to Value Ratio
Active
$1,395,000
3
bds
|
4
ba
|
3,923
sqft
|
built
1996
2705 Crystal Beach Dr, Las Vegas, NV 89128
$-2,685
Cash flow
-10.0%
Cash-on-Cash Return
3.4%
Cap rate
0.5%
Rent to Value Ratio
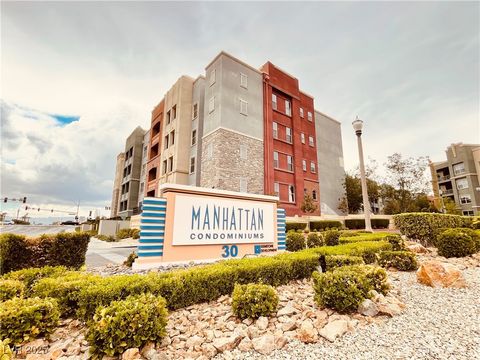
Active
$310,000
1
bds
|
1
ba
|
867
sqft
|
built
2006
200 W Sahara Ave, Las Vegas, NV 89102
$-867
Cash flow
-14.6%
Cash-on-Cash Return
2.3%
Cap rate
0.7%
Rent to Value Ratio

Active
$396,000
3
bds
|
2
ba
|
1,942
sqft
|
built
2005
3567 Cottage Stream Ct, Laughlin, NV 89029
$-795
Cash flow
-10.5%
Cash-on-Cash Return
3.3%
Cap rate
0.5%
Rent to Value Ratio

Active
$415,000
3
bds
|
3
ba
|
1,544
sqft
|
built
1989
823 Schooner Dr, Henderson, NV 89015
$-439
Cash flow
-5.5%
Cash-on-Cash Return
4.4%
Cap rate
0.6%
Rent to Value Ratio
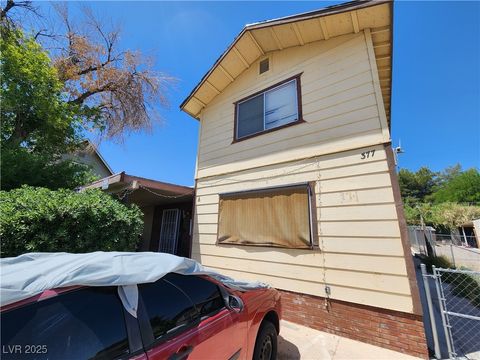
Active
$525,000
bds
|
0
ba
|
2,964
sqft
|
built
1946
377 N 16th St, Las Vegas, NV 89101
$-1,800
Cash flow
-17.9%
Cash-on-Cash Return
1.6%
Cap rate
0.2%
Rent to Value Ratio
Active
$328,000
3
bds
|
2
ba
|
1,200
sqft
|
built
1989
709 Jonathan Glen Way, Las Vegas, NV 89145
$-586
Cash flow
-9.3%
Cash-on-Cash Return
3.5%
Cap rate
0.5%
Rent to Value Ratio

Active
$519,990
3
bds
|
3
ba
|
2,380
sqft
|
built
2004
3439 Cottage Canyon St, Laughlin, NV 89029
$-1,167
Cash flow
-11.7%
Cash-on-Cash Return
3.0%
Cap rate
0.4%
Rent to Value Ratio

Active
$328,999
3
bds
|
3
ba
|
1,320
sqft
|
built
1997
1201 Dusty Creek St, Las Vegas, NV 89128
$-569
Cash flow
-9.0%
Cash-on-Cash Return
3.6%
Cap rate
0.5%
Rent to Value Ratio
Active
$467,000
4
bds
|
2
ba
|
1,725
sqft
|
built
1996
441 Daylin Ct, Henderson, NV 89015
$-762
Cash flow
-8.5%
Cash-on-Cash Return
3.7%
Cap rate
0.5%
Rent to Value Ratio
Active
$175,000
2
bds
|
2
ba
|
1,208
sqft
|
built
1994
3550 Bay Sands Dr, Laughlin, NV 89029
$-255
Cash flow
-7.6%
Cash-on-Cash Return
3.9%
Cap rate
0.8%
Rent to Value Ratio

Active
$429,500
3
bds
|
2
ba
|
1,553
sqft
|
built
1989
6432 Jean Lee Dr, Las Vegas, NV 89108
$-839
Cash flow
-10.2%
Cash-on-Cash Return
3.3%
Cap rate
0.4%
Rent to Value Ratio

Active
$176,000
2
bds
|
2
ba
|
985
sqft
|
built
1984
3740 Desert Marina Dr, Laughlin, NV 89029
$-464
Cash flow
-13.8%
Cash-on-Cash Return
2.5%
Cap rate
0.7%
Rent to Value Ratio
Active
$309,999
2
bds
|
2
ba
|
1,243
sqft
|
built
2006
62 E Serene Ave, Las Vegas, NV 89123
$-986
Cash flow
-16.6%
Cash-on-Cash Return
1.9%
Cap rate
0.6%
Rent to Value Ratio

Active
$353,000
3
bds
|
3
ba
|
1,411
sqft
|
built
2022
100 Eton St, Pahrump, NV 89048
$-644
Cash flow
-9.5%
Cash-on-Cash Return
3.5%
Cap rate
0.5%
Rent to Value Ratio
Active
$415,000
3
bds
|
2
ba
|
1,648
sqft
|
built
1980
532 Greenbriar Pl, Boulder City, NV 89005
$-931
Cash flow
-11.7%
Cash-on-Cash Return
3.0%
Cap rate
0.5%
Rent to Value Ratio
Active
$154,900
2
bds
|
1
ba
|
999
sqft
|
built
2011
3550 Bay Sands Dr, Laughlin, NV 89029
$-281
Cash flow
-9.5%
Cash-on-Cash Return
3.5%
Cap rate
0.8%
Rent to Value Ratio
Active
$560,000
5
bds
|
3
ba
|
2,946
sqft
|
built
2023
1885 Vass Springs Pl, North Las Vegas, NV 89084
$-1,486
Cash flow
-13.8%
Cash-on-Cash Return
2.5%
Cap rate
0.4%
Rent to Value Ratio
Active
$675,500
4
bds
|
3
ba
|
2,562
sqft
|
built
2004
6712 Tattler Dr, North Las Vegas, NV 89084
$-1,667
Cash flow
-12.9%
Cash-on-Cash Return
2.7%
Cap rate
0.4%
Rent to Value Ratio
Active
$749,999
5
bds
|
3
ba
|
3,014
sqft
|
built
2000
977 Courtney Valley St, Henderson, NV 89052
$-1,621
Cash flow
-11.3%
Cash-on-Cash Return
3.1%
Cap rate
0.4%
Rent to Value Ratio

Active
$167,000
2
bds
|
2
ba
|
900
sqft
|
built
1989
2171 Bay Club Dr, Laughlin, NV 89029
$-345
Cash flow
-10.8%
Cash-on-Cash Return
3.2%
Cap rate
0.7%
Rent to Value Ratio
Active
$1,249,900
6
bds
|
5
ba
|
5,329
sqft
|
built
1980
1427 San Felipe Dr, Boulder City, NV 89005
$-4,434
Cash flow
-18.5%
Cash-on-Cash Return
1.4%
Cap rate
0.2%
Rent to Value Ratio
Active
$510,000
4
bds
|
4
ba
|
2,044
sqft
|
built
2019
156 Campbelltown Ave, Henderson, NV 89015
$-1,040
Cash flow
-10.6%
Cash-on-Cash Return
3.2%
Cap rate
0.5%
Rent to Value Ratio
Active
$1,999,000
4
bds
|
3
ba
|
3,864
sqft
|
built
1990
1813 Skyline Dr, Las Vegas, NV 89117
$-4,769
Cash flow
-12.4%
Cash-on-Cash Return
2.8%
Cap rate
0.4%
Rent to Value Ratio
Active
$1,145,000
5
bds
|
3
ba
|
4,434
sqft
|
built
2006
5872 Revital Ct, Las Vegas, NV 89131
$-2,552
Cash flow
-11.6%
Cash-on-Cash Return
3.0%
Cap rate
0.4%
Rent to Value Ratio
Active
$2,499,999
6
bds
|
5
ba
|
7,042
sqft
|
built
1989
2131 Diamond Bar Dr, Las Vegas, NV 89117
$-6,457
Cash flow
-13.5%
Cash-on-Cash Return
2.6%
Cap rate
0.4%
Rent to Value Ratio
Active
$509,000
3
bds
|
3
ba
|
1,808
sqft
|
built
1985
8932 Beach Front Dr, Las Vegas, NV 89117
$-795
Cash flow
-8.1%
Cash-on-Cash Return
3.8%
Cap rate
0.6%
Rent to Value Ratio
Active
$579,700
5
bds
|
3
ba
|
2,467
sqft
|
built
2020
2785 Donatello Manor Pl, Henderson, NV 89044
$-1,434
Cash flow
-12.9%
Cash-on-Cash Return
2.7%
Cap rate
0.4%
Rent to Value Ratio