Nevada Investment Properties for Sale
Browse homes for sale and investment properties in Nevada. Refine your search by price, property type, or more.
Best cash flowing properties in Nevada
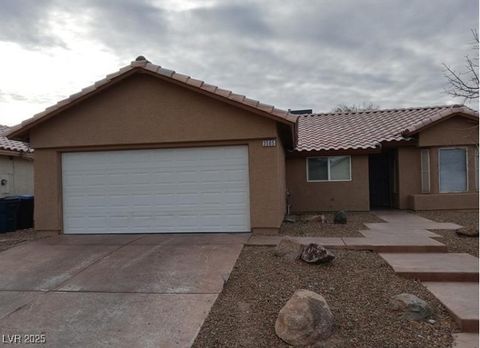
Active
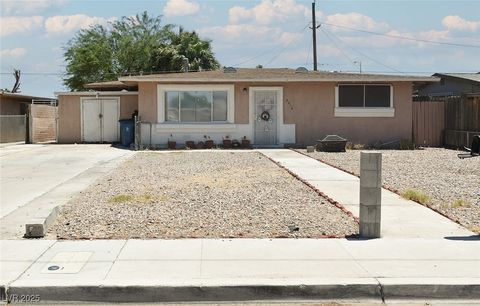
$292,990
3
bds
|
1
ba
|
1,016
sqft
|
built
1954
2616 Spear St, North Las Vegas, NV 89030
$-318
Cash flow
-5.7%
Cash-on-Cash Return
4.4%
Cap rate
0.5%
Rent to Value Ratio
Active
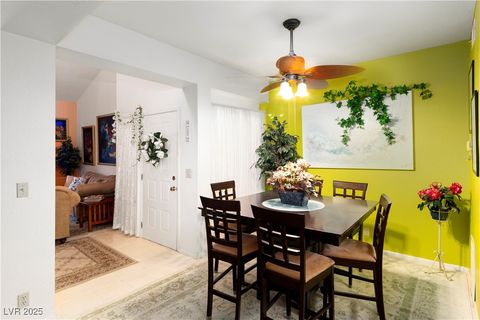
$239,000
2
bds
|
3
ba
|
1,634
sqft
|
built
1989
3859 Desert Marina Dr, Laughlin, NV 89029
$-368
Cash flow
-8.0%
Cash-on-Cash Return
3.8%
Cap rate
0.8%
Rent to Value Ratio
5,126 out of 5,399 properties for sale in Nevada
Limited Results Shown
Create a free account, or log in to reveal all property listings and enjoy the complete experience.

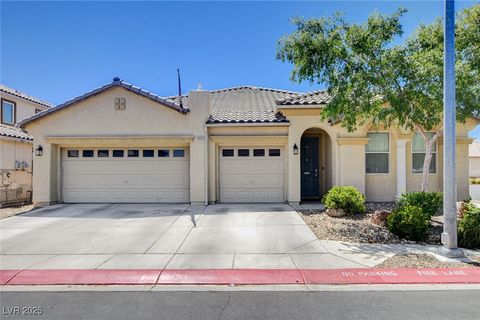
Active
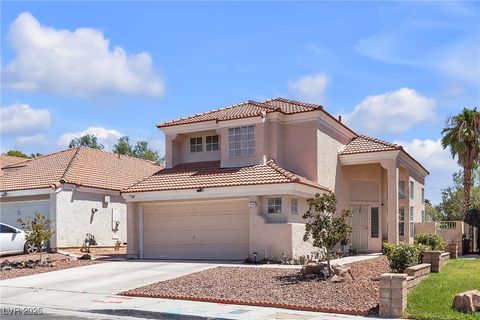
$258,900
2
bds
|
2
ba
|
1,080
sqft
|
built
1993
8452 Boseck Dr, Las Vegas, NV 89145
$-616
Cash flow
-12.4%
Cash-on-Cash Return
2.8%
Cap rate
0.5%
Rent to Value Ratio

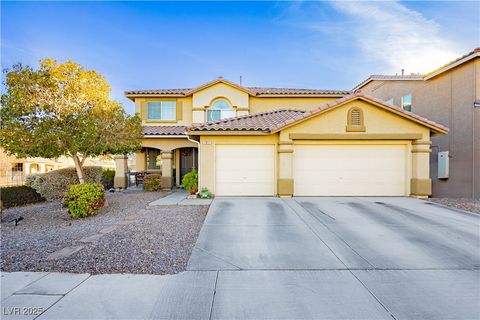
Active
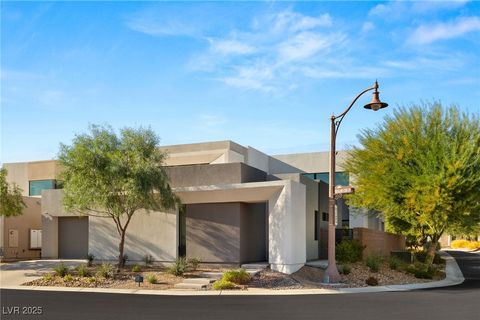
$279,000
3
bds
|
2
ba
|
1,437
sqft
|
built
2003
7135 S Durango Dr, Las Vegas, NV 89113
$-672
Cash flow
-12.6%
Cash-on-Cash Return
2.8%
Cap rate
0.6%
Rent to Value Ratio

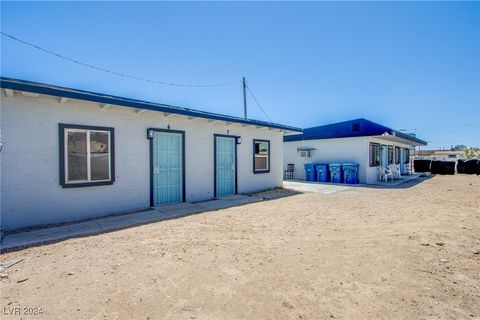
Active
$789,000
4
bds
|
3
ba
|
2,494
sqft
|
built
2019
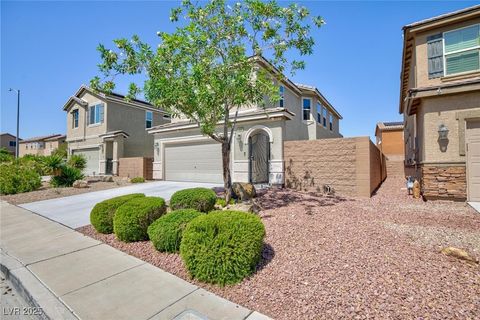
9860 Mariposa Lily Ave, Las Vegas, NV 89149
$-1,487
Cash flow
-9.8%
Cash-on-Cash Return
3.4%
Cap rate
0.5%
Rent to Value Ratio
Active
$450,000
3
bds
|
3
ba
|
1,710
sqft
|
built
1988
3016 Cloverbrook St, Las Vegas, NV 89117
$-956
Cash flow
-11.1%
Cash-on-Cash Return
3.1%
Cap rate
0.4%
Rent to Value Ratio

Active
$375,000
3
bds
|
3
ba
|
1,939
sqft
|
built
2019
1040 Via Panfilo Ave, Henderson, NV 89011
$-646
Cash flow
-9.0%
Cash-on-Cash Return
3.6%
Cap rate
0.7%
Rent to Value Ratio
Active
$2,177,000
3
bds
|
4
ba
|
4,692
sqft
|
built
2021
21 Highland Cove Ln, Henderson, NV 89011
$-5,155
Cash flow
-12.4%
Cash-on-Cash Return
2.8%
Cap rate
0.5%
Rent to Value Ratio
Active
$3,450,000
5
bds
|
6
ba
|
4,690
sqft
|
built
2020
12637 Penfield Ave, Las Vegas, NV 89138
$-13,181
Cash flow
-19.9%
Cash-on-Cash Return
1.1%
Cap rate
0.2%
Rent to Value Ratio
Active
$612,000
4
bds
|
3
ba
|
2,604
sqft
|
built
2021
7456 Tinley Creek Ave, Las Vegas, NV 89113
$-1,196
Cash flow
-10.2%
Cash-on-Cash Return
3.3%
Cap rate
0.5%
Rent to Value Ratio
Active
$429,000
3
bds
|
2
ba
|
1,583
sqft
|
built
2019
984 Brilliant Meadow Ave, North Las Vegas, NV 89086
$-1,080
Cash flow
-13.1%
Cash-on-Cash Return
2.7%
Cap rate
0.5%
Rent to Value Ratio
Active
$529,000
8
bds
|
0
ba
|
3,112
sqft
|
built
1984
2685 Bryandouglas Dr, Las Vegas, NV 89121
$-1,652
Cash flow
-16.3%
Cash-on-Cash Return
1.9%
Cap rate
0.3%
Rent to Value Ratio
Active
$567,000
3
bds
|
2
ba
|
1,933
sqft
|
built
2016
10742 Cowlite Ave, Las Vegas, NV 89166
$-1,340
Cash flow
-12.3%
Cash-on-Cash Return
2.8%
Cap rate
0.5%
Rent to Value Ratio
Active
$727,000
5
bds
|
3
ba
|
2,467
sqft
|
built
2020
2787 Donatello Manor Pl, Henderson, NV 89044
$-1,754
Cash flow
-12.6%
Cash-on-Cash Return
2.8%
Cap rate
0.4%
Rent to Value Ratio
Active
$465,000
5
bds
|
3
ba
|
1,892
sqft
|
built
1966
904 Rockaway St, Las Vegas, NV 89145
$-370
Cash flow
-4.2%
Cash-on-Cash Return
4.7%
Cap rate
0.6%
Rent to Value Ratio
Active
$514,900
5
bds
|
0
ba
|
1,796
sqft
|
built
1954
1317 Exley Ave, Las Vegas, NV 89104
$-1,660
Cash flow
-16.8%
Cash-on-Cash Return
1.8%
Cap rate
0.3%
Rent to Value Ratio
Active
$474,900
3
bds
|
3
ba
|
1,843
sqft
|
built
2013
1037 Water Cove St, Henderson, NV 89011
$-1,154
Cash flow
-12.7%
Cash-on-Cash Return
2.8%
Cap rate
0.4%
Rent to Value Ratio
Active
$500,000
4
bds
|
3
ba
|
2,384
sqft
|
built
2018
412 Gracious Way, Henderson, NV 89011
$-840
Cash flow
-8.8%
Cash-on-Cash Return
3.7%
Cap rate
0.6%
Rent to Value Ratio
Active
$499,900
3
bds
|
2
ba
|
1,264
sqft
|
built
1999
529 Quail Bird Pl, Henderson, NV 89052
$-1,296
Cash flow
-13.5%
Cash-on-Cash Return
2.6%
Cap rate
0.4%
Rent to Value Ratio
Active
$640,000
5
bds
|
3
ba
|
3,225
sqft
|
built
1994
6 High Sierra Dr, Henderson, NV 89074
$-818
Cash flow
-6.7%
Cash-on-Cash Return
4.1%
Cap rate
0.6%
Rent to Value Ratio
Active
$439,000
4
bds
|
3
ba
|
2,230
sqft
|
built
1997
3359 Commendation Dr, Las Vegas, NV 89117
$-786
Cash flow
-9.3%
Cash-on-Cash Return
3.5%
Cap rate
0.5%
Rent to Value Ratio
Active
$385,000
3
bds
|
2
ba
|
1,459
sqft
|
built
1999
641 Bay Bridge Dr, North Las Vegas, NV 89032
$-771
Cash flow
-10.4%
Cash-on-Cash Return
3.3%
Cap rate
0.5%
Rent to Value Ratio
Active
$399,999
3
bds
|
2
ba
|
1,243
sqft
|
built
1990
849 Brahma Ln, Henderson, NV 89002
$-425
Cash flow
-5.5%
Cash-on-Cash Return
4.4%
Cap rate
0.6%
Rent to Value Ratio
Active
$365,000
3
bds
|
2
ba
|
1,812
sqft
|
built
1956
812 Pyramid Dr, Las Vegas, NV 89107
$-419
Cash flow
-6.0%
Cash-on-Cash Return
4.3%
Cap rate
0.5%
Rent to Value Ratio
Active
$498,000
4
bds
|
3
ba
|
2,044
sqft
|
built
2005
1011 Pecos River Ave, Henderson, NV 89002
$-764
Cash flow
-8.0%
Cash-on-Cash Return
3.8%
Cap rate
0.5%
Rent to Value Ratio
Active
$750,000
5
bds
|
3
ba
|
3,724
sqft
|
built
2001
4116 Villa Flora St, Las Vegas, NV 89130
$-1,777
Cash flow
-12.4%
Cash-on-Cash Return
2.8%
Cap rate
0.4%
Rent to Value Ratio
Active
$570,000
5
bds
|
3
ba
|
3,040
sqft
|
built
2001
1306 Big Tree Ave, North Las Vegas, NV 89031
$-796
Cash flow
-7.3%
Cash-on-Cash Return
4.0%
Cap rate
0.5%
Rent to Value Ratio

Active
$1,126,000
5
bds
|
4
ba
|
5,193
sqft
|
built
1995
7761 Cowboy Trl, Las Vegas, NV 89131
$-2,838
Cash flow
-13.2%
Cash-on-Cash Return
2.7%
Cap rate
0.4%
Rent to Value Ratio

Active
$565,000
4
bds
|
3
ba
|
2,776
sqft
|
built
1998
9469 Coral Shine Ct, Las Vegas, NV 89123
$-1,108
Cash flow
-10.2%
Cash-on-Cash Return
3.3%
Cap rate
0.5%
Rent to Value Ratio
Active
$574,000
3
bds
|
3
ba
|
1,582
sqft
|
built
1995
1805 Derbyshire Dr, Las Vegas, NV 89117
$-1,068
Cash flow
-9.7%
Cash-on-Cash Return
3.4%
Cap rate
0.5%
Rent to Value Ratio
Active
$860,000
5
bds
|
3
ba
|
3,496
sqft
|
built
2007
8547 Benidorm Ave, Las Vegas, NV 89178
$-1,514
Cash flow
-9.2%
Cash-on-Cash Return
3.6%
Cap rate
0.5%
Rent to Value Ratio

Active
$624,900
4
bds
|
4
ba
|
3,486
sqft
|
built
2005
10013 Scenic Walk Ave, Las Vegas, NV 89149
$-1,271
Cash flow
-10.6%
Cash-on-Cash Return
3.2%
Cap rate
0.5%
Rent to Value Ratio
Active
$724,900
5
bds
|
4
ba
|
3,025
sqft
|
built
1993
8113 Blue Cascade Ave, Las Vegas, NV 89128
$-1,564
Cash flow
-11.3%
Cash-on-Cash Return
3.1%
Cap rate
0.4%
Rent to Value Ratio
Active
$3,750,000
6
bds
|
6
ba
|
5,933
sqft
|
built
1975
3455 Five Pennies Ln, Las Vegas, NV 89120
$-15,276
Cash flow
-21.3%
Cash-on-Cash Return
0.8%
Cap rate
0.1%
Rent to Value Ratio
Active
$529,999
4
bds
|
3
ba
|
2,069
sqft
|
built
1991
5517 Rock Creek Ln, Las Vegas, NV 89130
$-1,125
Cash flow
-11.1%
Cash-on-Cash Return
3.1%
Cap rate
0.4%
Rent to Value Ratio
Active
$479,900
3
bds
|
2
ba
|
1,208
sqft
|
built
1995
3505 Benson Ln, North Las Vegas, NV 89032
$-1,116
Cash flow
-12.1%
Cash-on-Cash Return
2.9%
Cap rate
0.4%
Rent to Value Ratio

Active
$910,000
3
bds
|
4
ba
|
2,389
sqft
|
built
2005
1223 Casa Palermo Cir, Henderson, NV 89011
$-2,745
Cash flow
-15.7%
Cash-on-Cash Return
2.1%
Cap rate
0.4%
Rent to Value Ratio
Active
$485,000
4
bds
|
2
ba
|
2,155
sqft
|
built
2007
5929 Caddy Ridge St, North Las Vegas, NV 89031
$-1,020
Cash flow
-11.0%
Cash-on-Cash Return
3.2%
Cap rate
0.5%
Rent to Value Ratio
Active
$699,900
5
bds
|
4
ba
|
3,320
sqft
|
built
2003
7317 Wild Roar Ave, Las Vegas, NV 89129
$-1,214
Cash flow
-9.0%
Cash-on-Cash Return
3.6%
Cap rate
0.5%
Rent to Value Ratio
Active
$649,888
2
bds
|
0
ba
|
1,610
sqft
|
built
1958
612 W Washington Ave, Las Vegas, NV 89106
$-1,945
Cash flow
-15.6%
Cash-on-Cash Return
2.1%
Cap rate
0.3%
Rent to Value Ratio