Nevada Investment Properties for Sale
Browse homes for sale and investment properties in Nevada. Refine your search by price, property type, or more.
Best cash flowing properties in Nevada
Active
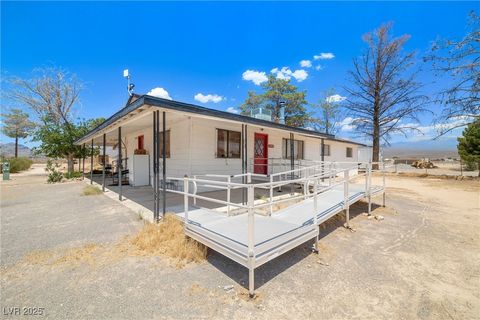
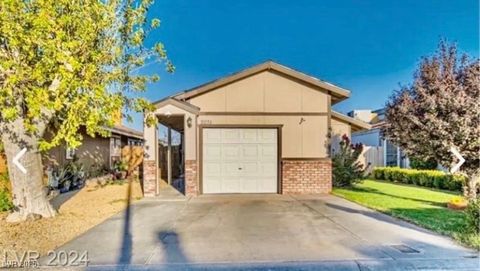
$285,000
4
bds
|
3
ba
|
1,932
sqft
|
built
1978
2580 Sunset St, Pahrump, NV 89060
$28
Cash flow
0.5%
Cash-on-Cash Return
5.8%
Cap rate
0.7%
Rent to Value Ratio
Active
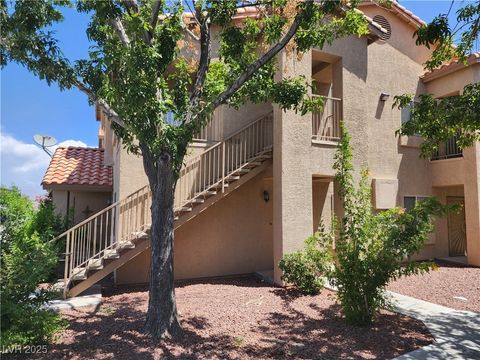
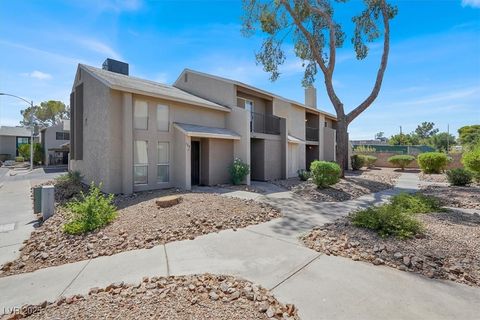
$130,000
1
bds
|
1
ba
|
598
sqft
|
built
1999
2110 Los Feliz St, Las Vegas, NV 89156
$-166
Cash flow
-6.7%
Cash-on-Cash Return
4.1%
Cap rate
0.8%
Rent to Value Ratio
5,260 out of 5,500 properties for sale in Nevada
Limited Results Shown
Create a free account, or log in to reveal all property listings and enjoy the complete experience.
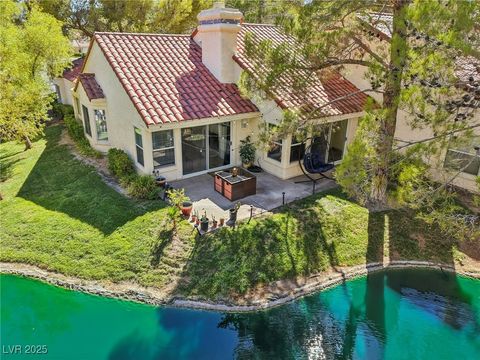
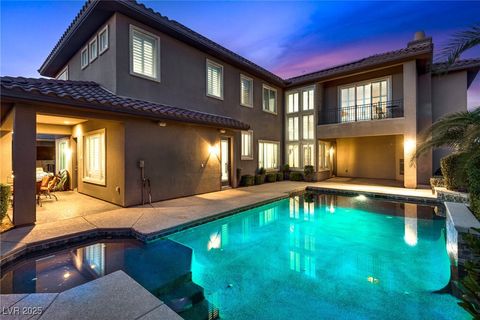
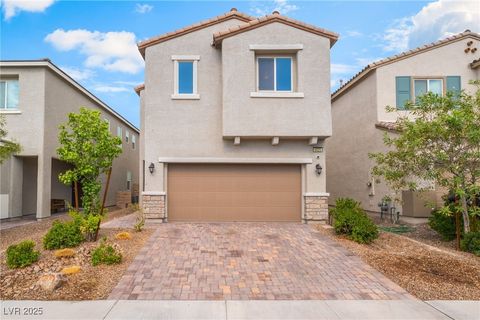
Active
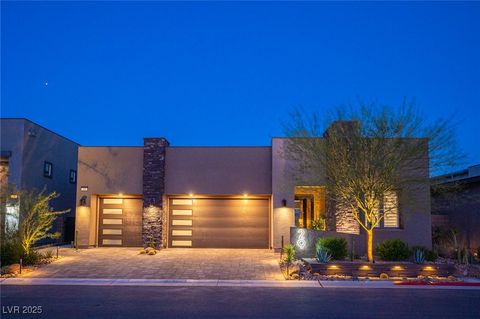
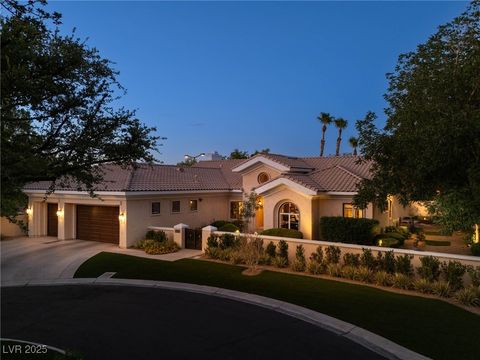
$1,035,000
4
bds
|
3
ba
|
2,281
sqft
|
built
2022
29 Reverie Heights Ave, Henderson, NV 89011
$-3,786
Cash flow
-19.1%
Cash-on-Cash Return
1.3%
Cap rate
0.3%
Rent to Value Ratio

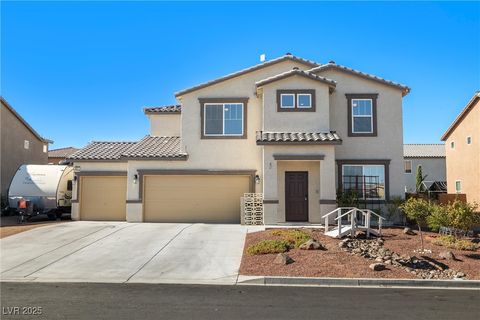
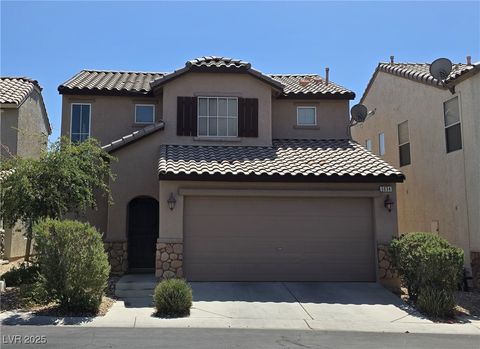
Active
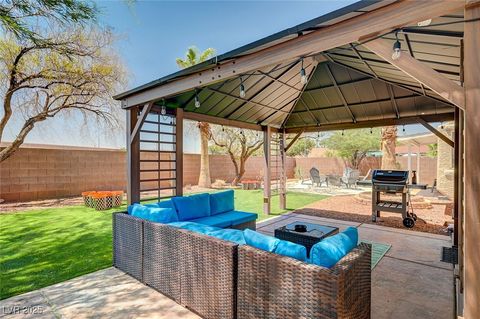
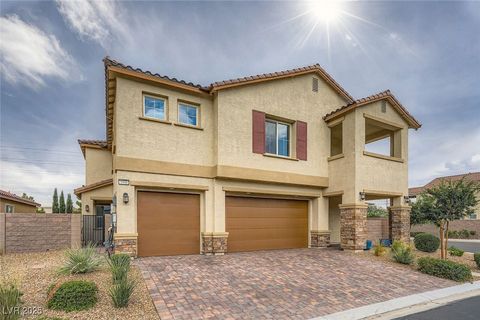
$439,999
3
bds
|
3
ba
|
1,940
sqft
|
built
2013
7919 Bartlett Peak St, Las Vegas, NV 89166
$-946
Cash flow
-11.2%
Cash-on-Cash Return
3.1%
Cap rate
0.5%
Rent to Value Ratio
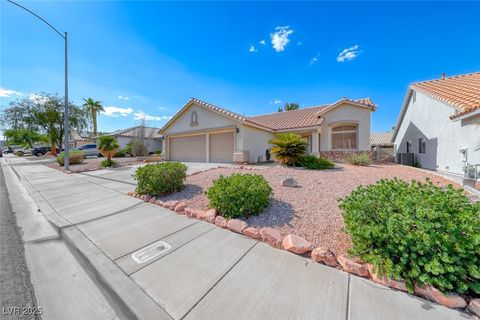
Active
$580,000
4
bds
|
3
ba
|
2,154
sqft
|
built
2002
7735 Maggie Belle Ct, Las Vegas, NV 89123
$-1,118
Cash flow
-10.1%
Cash-on-Cash Return
3.4%
Cap rate
0.5%
Rent to Value Ratio
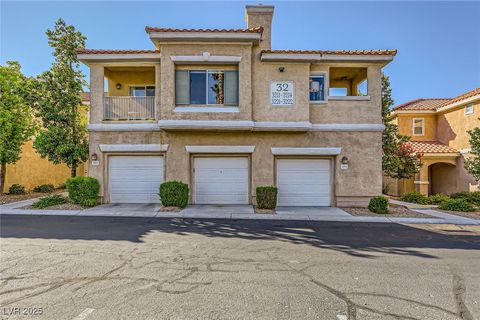
Active
$412,000
2
bds
|
2
ba
|
1,173
sqft
|
built
1986
6921 Emerald Springs Ln, Las Vegas, NV 89113
$-1,373
Cash flow
-17.4%
Cash-on-Cash Return
1.7%
Cap rate
0.5%
Rent to Value Ratio
Active
$374,900
5
bds
|
3
ba
|
2,563
sqft
|
built
2018
3821 E Summit Ave, Pahrump, NV 89061
$-335
Cash flow
-4.7%
Cash-on-Cash Return
4.6%
Cap rate
0.7%
Rent to Value Ratio
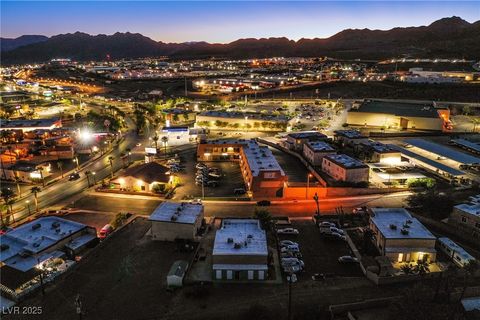
Active
$699,900
8
bds
|
0
ba
|
3,592
sqft
|
built
1982
523 Fir St, Boulder City, NV 89005
$-2,209
Cash flow
-16.5%
Cash-on-Cash Return
1.9%
Cap rate
0.3%
Rent to Value Ratio
Active
$385,000
3
bds
|
3
ba
|
1,541
sqft
|
built
2022
7326 S Decatur Blvd, Las Vegas, NV 89139
$-973
Cash flow
-13.2%
Cash-on-Cash Return
2.6%
Cap rate
0.5%
Rent to Value Ratio
Active
$380,000
3
bds
|
2
ba
|
1,726
sqft
|
built
1962
604 Mayfield St, Las Vegas, NV 89107
$-609
Cash flow
-8.4%
Cash-on-Cash Return
3.8%
Cap rate
0.5%
Rent to Value Ratio
Active
$249,000
3
bds
|
2
ba
|
1,097
sqft
|
built
1973
1500 Hialeah Dr, Las Vegas, NV 89119
$-554
Cash flow
-11.6%
Cash-on-Cash Return
3.0%
Cap rate
0.6%
Rent to Value Ratio
Active
$580,000
4
bds
|
3
ba
|
2,791
sqft
|
built
2003
7908 Morning Gallop Ct, Las Vegas, NV 89131
$-1,094
Cash flow
-9.8%
Cash-on-Cash Return
3.4%
Cap rate
0.5%
Rent to Value Ratio
Active
$460,000
2
bds
|
3
ba
|
1,653
sqft
|
built
1988
2516 Cove Rd, Las Vegas, NV 89128
$-1,121
Cash flow
-12.7%
Cash-on-Cash Return
2.8%
Cap rate
0.4%
Rent to Value Ratio
Active
$350,000
3
bds
|
2
ba
|
1,306
sqft
|
built
1979
2031 San Simeon St, Las Vegas, NV 89108
$-475
Cash flow
-7.1%
Cash-on-Cash Return
4.0%
Cap rate
0.5%
Rent to Value Ratio
Active
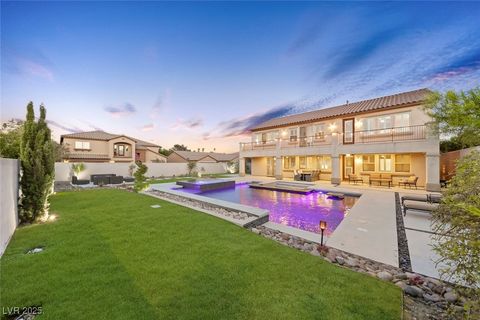
$1,299,000
2
bds
|
3
ba
|
3,041
sqft
|
built
1993
9004 Rolling Knoll Ct, Las Vegas, NV 89134
$-3,571
Cash flow
-14.3%
Cash-on-Cash Return
2.4%
Cap rate
0.4%
Rent to Value Ratio
Active
$950,000
5
bds
|
5
ba
|
3,338
sqft
|
built
2022
5990 Viscaya Grove St, Las Vegas, NV 89118
$-1,370
Cash flow
-7.5%
Cash-on-Cash Return
3.9%
Cap rate
0.6%
Rent to Value Ratio
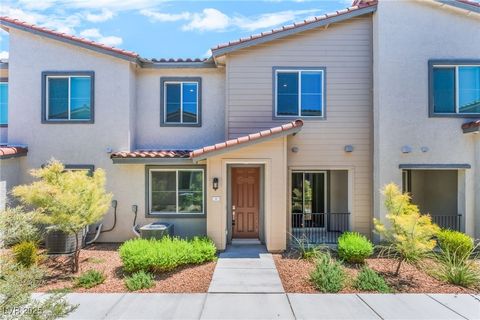
Active
$224,000
2
bds
|
2
ba
|
984
sqft
|
built
1983
566 Sellers Pl, Henderson, NV 89011
$-411
Cash flow
-9.6%
Cash-on-Cash Return
3.5%
Cap rate
0.6%
Rent to Value Ratio
Active
$1,200,000
5
bds
|
4
ba
|
4,685
sqft
|
built
1993
1225 Kover Ct, Henderson, NV 89002
$-3,294
Cash flow
-14.3%
Cash-on-Cash Return
2.4%
Cap rate
0.3%
Rent to Value Ratio
Active
$1,989,000
4
bds
|
5
ba
|
3,917
sqft
|
built
1984
3185 S Monte Cristo Way, Las Vegas, NV 89117
$-6,306
Cash flow
-16.5%
Cash-on-Cash Return
1.9%
Cap rate
0.3%
Rent to Value Ratio

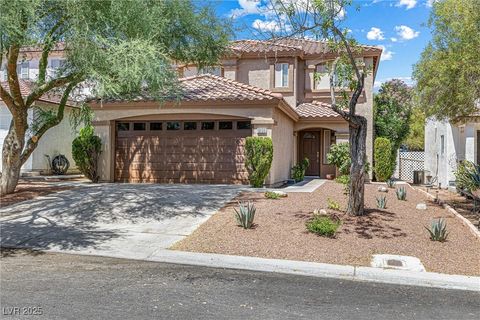
Active
$425,000
4
bds
|
3
ba
|
1,686
sqft
|
built
2007
9984 Big Sur Mountain St, Las Vegas, NV 89178
$-796
Cash flow
-9.8%
Cash-on-Cash Return
3.4%
Cap rate
0.5%
Rent to Value Ratio
Active
$610,000
5
bds
|
3
ba
|
3,068
sqft
|
built
2021
4417 Cityscape Glen Ct, North Las Vegas, NV 89084
$-1,591
Cash flow
-13.6%
Cash-on-Cash Return
2.5%
Cap rate
0.5%
Rent to Value Ratio
Active
$305,000
2
bds
|
2
ba
|
1,196
sqft
|
built
2006
8324 W Charleston Blvd, Las Vegas, NV 89117
$-688
Cash flow
-11.8%
Cash-on-Cash Return
3.0%
Cap rate
0.5%
Rent to Value Ratio
Active
$1,545,000
3
bds
|
4
ba
|
3,746
sqft
|
built
2006
712 Tandoori Ln, Las Vegas, NV 89138
$-3,363
Cash flow
-11.4%
Cash-on-Cash Return
3.1%
Cap rate
0.5%
Rent to Value Ratio

Active
$429,999
3
bds
|
3
ba
|
1,977
sqft
|
built
2007
10082 Sand Key St, Las Vegas, NV 89178
$-735
Cash flow
-8.9%
Cash-on-Cash Return
3.6%
Cap rate
0.6%
Rent to Value Ratio
Active
$979,000
5
bds
|
4
ba
|
3,381
sqft
|
built
2022
225 Abbey Hill St, Henderson, NV 89012
$-2,683
Cash flow
-14.3%
Cash-on-Cash Return
2.4%
Cap rate
0.4%
Rent to Value Ratio
Active
$325,000
2
bds
|
2
ba
|
1,276
sqft
|
built
1982
2544 Malabar Ave, Las Vegas, NV 89121
$-771
Cash flow
-12.4%
Cash-on-Cash Return
2.8%
Cap rate
0.5%
Rent to Value Ratio
Active
$469,999
3
bds
|
2
ba
|
1,358
sqft
|
built
1987
1275 White Dr, Las Vegas, NV 89119
$-1,284
Cash flow
-14.3%
Cash-on-Cash Return
2.4%
Cap rate
0.3%
Rent to Value Ratio

Active
$415,000
3
bds
|
3
ba
|
1,776
sqft
|
built
2007
7864 Solid Horn Ct, Las Vegas, NV 89149
$-783
Cash flow
-9.8%
Cash-on-Cash Return
3.4%
Cap rate
0.5%
Rent to Value Ratio
Active
$875,000
5
bds
|
5
ba
|
4,148
sqft
|
built
2008
8505 Mayport Dr, Las Vegas, NV 89131
$-2,449
Cash flow
-14.6%
Cash-on-Cash Return
2.3%
Cap rate
0.4%
Rent to Value Ratio
Active
$1,275,000
6
bds
|
5
ba
|
4,970
sqft
|
built
2013
7148 White Bloom Ave, Las Vegas, NV 89117
$-857
Cash flow
-3.5%
Cash-on-Cash Return
4.9%
Cap rate
0.7%
Rent to Value Ratio
Active
$455,000
4
bds
|
3
ba
|
1,575
sqft
|
built
2001
10133 Rice Paper St, Las Vegas, NV 89183
$-954
Cash flow
-10.9%
Cash-on-Cash Return
3.2%
Cap rate
0.4%
Rent to Value Ratio
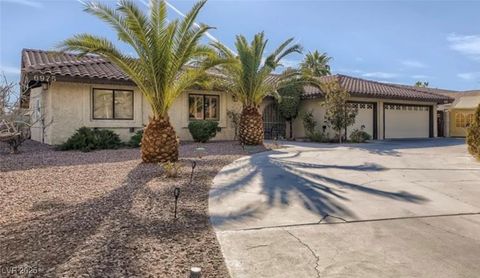
Active
$950,000
5
bds
|
4
ba
|
2,955
sqft
|
built
1979
6975 Obannon Dr, Las Vegas, NV 89117
$-1,465
Cash flow
-8.0%
Cash-on-Cash Return
3.8%
Cap rate
0.5%
Rent to Value Ratio
Active
$399,900
3
bds
|
3
ba
|
1,769
sqft
|
built
2020
6625 Evander St, North Las Vegas, NV 89086
$-774
Cash flow
-10.1%
Cash-on-Cash Return
3.4%
Cap rate
0.6%
Rent to Value Ratio
Active
$380,000
2
bds
|
3
ba
|
1,224
sqft
|
built
2005
5634 Moccasin Point St, Las Vegas, NV 89148
$-765
Cash flow
-10.5%
Cash-on-Cash Return
3.3%
Cap rate
0.5%
Rent to Value Ratio
Active
$470,000
3
bds
|
2
ba
|
1,800
sqft
|
built
1998
1146 Light Sky Ave, Henderson, NV 89074
$-890
Cash flow
-9.9%
Cash-on-Cash Return
3.4%
Cap rate
0.5%
Rent to Value Ratio
Active
$305,000
1
bds
|
1
ba
|
824
sqft
|
built
1997
251 S Green Valley Pkwy, Henderson, NV 89012
$-656
Cash flow
-11.2%
Cash-on-Cash Return
3.1%
Cap rate
0.6%
Rent to Value Ratio
Active
$900,000
4
bds
|
3
ba
|
2,002
sqft
|
built
2022
11861 Pelican Butte Ave, Las Vegas, NV 89138
$-1,825
Cash flow
-10.6%
Cash-on-Cash Return
3.2%
Cap rate
0.5%
Rent to Value Ratio
Active
$1,350,000
4
bds
|
5
ba
|
3,800
sqft
|
built
2007
2805 Molinard Ct, Henderson, NV 89044
$-4,611
Cash flow
-17.8%
Cash-on-Cash Return
1.6%
Cap rate
0.3%
Rent to Value Ratio
Active
$465,000
3
bds
|
3
ba
|
1,976
sqft
|
built
2009
1161 Cactus Rock St, Henderson, NV 89011
$-710
Cash flow
-8.0%
Cash-on-Cash Return
3.8%
Cap rate
0.5%
Rent to Value Ratio

Active
$899,000
5
bds
|
4
ba
|
3,887
sqft
|
built
1964
1900 S 15th St, Las Vegas, NV 89104
$-1,715
Cash flow
-10.0%
Cash-on-Cash Return
3.4%
Cap rate
0.4%
Rent to Value Ratio