Nevada Investment Properties for Sale
Browse homes for sale and investment properties in Nevada. Refine your search by price, property type, or more.
Best cash flowing properties in Nevada
Active
$168,000
1
bds
|
1
ba
|
568
sqft
|
built
1989
4730 Nara Vista Way, Las Vegas, NV 89103
$-282
Cash flow
-8.8%
Cash-on-Cash Return
3.7%
Cap rate
0.7%
Rent to Value Ratio
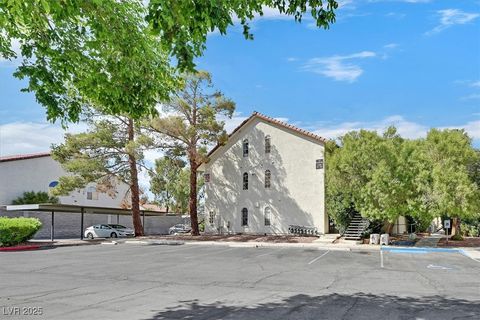
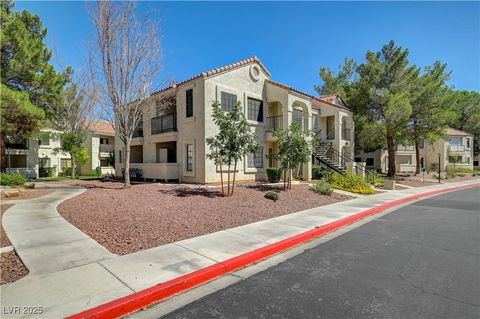
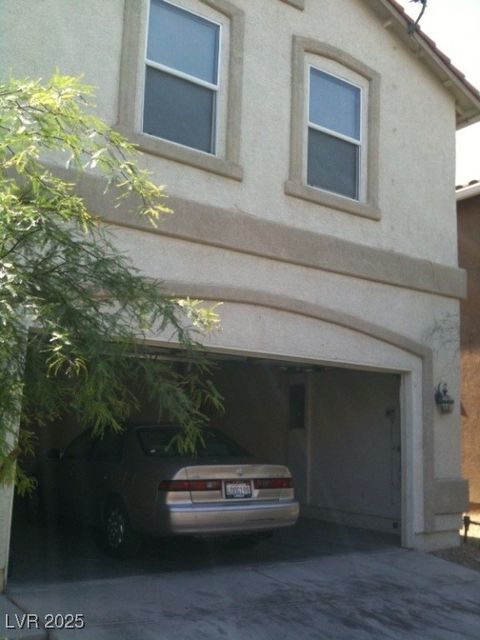
Active
$199,900
2
bds
|
2
ba
|
848
sqft
|
built
1984
3974 Bushnell Dr, Las Vegas, NV 89103
$-330
Cash flow
-8.6%
Cash-on-Cash Return
3.7%
Cap rate
0.7%
Rent to Value Ratio
5,259 out of 5,499 properties for sale in Nevada
Limited Results Shown
Create a free account, or log in to reveal all property listings and enjoy the complete experience.

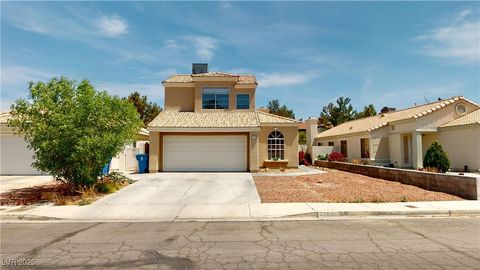
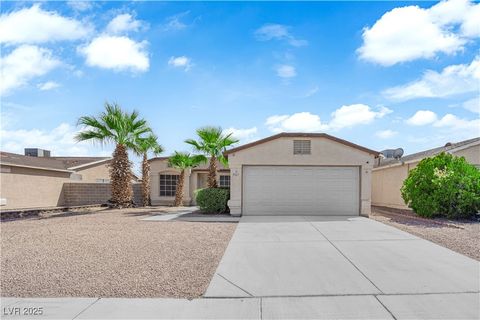
Active
$315,000
4
bds
|
1
ba
|
1,242
sqft
|
built
1963
3204 Osage Ave, Las Vegas, NV 89101
$-442
Cash flow
-7.3%
Cash-on-Cash Return
4.0%
Cap rate
0.5%
Rent to Value Ratio
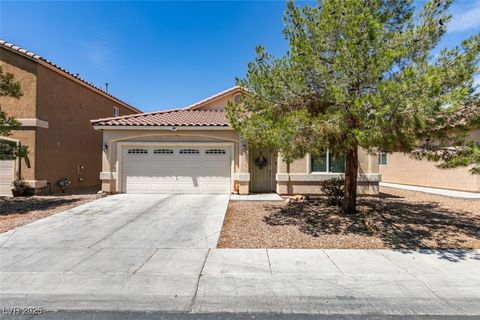
Active
$440,000
3
bds
|
3
ba
|
1,576
sqft
|
built
1993
7164 Paradise Bay Dr, Las Vegas, NV 89119
$-816
Cash flow
-9.7%
Cash-on-Cash Return
3.5%
Cap rate
0.5%
Rent to Value Ratio

Active
$975,000
4
bds
|
4
ba
|
3,235
sqft
|
built
2004
5832 Farnsworth Pond Ave, Las Vegas, NV 89130
$-2,713
Cash flow
-14.5%
Cash-on-Cash Return
2.3%
Cap rate
0.4%
Rent to Value Ratio

Active
$499,990
3
bds
|
3
ba
|
1,734
sqft
|
built
1990
4969 Jeremy Dr, Las Vegas, NV 89113
$-1,825
Cash flow
-19.0%
Cash-on-Cash Return
1.3%
Cap rate
0.5%
Rent to Value Ratio

Active
$340,000
2
bds
|
2
ba
|
1,268
sqft
|
built
2003
10001 Peace Way, Las Vegas, NV 89147
$-712
Cash flow
-10.9%
Cash-on-Cash Return
3.2%
Cap rate
0.5%
Rent to Value Ratio

Active
$675,000
5
bds
|
4
ba
|
3,005
sqft
|
built
2015
6005 Crown Palms Ave, Las Vegas, NV 89139
$-1,648
Cash flow
-12.7%
Cash-on-Cash Return
2.7%
Cap rate
0.4%
Rent to Value Ratio

Active
$979,900
3
bds
|
3
ba
|
2,578
sqft
|
built
2001
3212 Wisteria Tree St, Las Vegas, NV 89135
$-2,142
Cash flow
-11.4%
Cash-on-Cash Return
3.1%
Cap rate
0.4%
Rent to Value Ratio

Active
$215,000
2
bds
|
2
ba
|
1,029
sqft
|
built
1998
5710 E Tropicana Ave, Las Vegas, NV 89122
$-411
Cash flow
-10.0%
Cash-on-Cash Return
3.4%
Cap rate
0.6%
Rent to Value Ratio

Active
$430,000
3
bds
|
2
ba
|
2,751
sqft
|
built
1968
4444 Denia Cir, Las Vegas, NV 89108
$-489
Cash flow
-5.9%
Cash-on-Cash Return
4.3%
Cap rate
0.6%
Rent to Value Ratio
Active
$380,000
3
bds
|
2
ba
|
1,597
sqft
|
built
2010
2363 Rock Slide Cir, Las Vegas, NV 89115
$-798
Cash flow
-11.0%
Cash-on-Cash Return
3.2%
Cap rate
0.5%
Rent to Value Ratio

Active
$900,000
5
bds
|
4
ba
|
3,971
sqft
|
built
2017
9621 Paraiso Springs St, Las Vegas, NV 89139
$-1,397
Cash flow
-8.1%
Cash-on-Cash Return
3.8%
Cap rate
0.5%
Rent to Value Ratio

Active
$530,000
3
bds
|
2
ba
|
1,833
sqft
|
built
1995
5213 Red Glory Dr, Las Vegas, NV 89130
$-1,202
Cash flow
-11.8%
Cash-on-Cash Return
3.0%
Cap rate
0.4%
Rent to Value Ratio

Active
$475,000
4
bds
|
2
ba
|
1,742
sqft
|
built
1968
3318 Bancroft Cir, Las Vegas, NV 89121
$-743
Cash flow
-8.2%
Cash-on-Cash Return
3.8%
Cap rate
0.5%
Rent to Value Ratio

Active
$549,900
4
bds
|
3
ba
|
1,922
sqft
|
built
1963
6233 Elton Ave, Las Vegas, NV 89107
$-774
Cash flow
-7.3%
Cash-on-Cash Return
4.0%
Cap rate
0.5%
Rent to Value Ratio

Active
$361,000
3
bds
|
2
ba
|
1,354
sqft
|
built
1964
4317 Hanford Ave, Las Vegas, NV 89107
$-663
Cash flow
-9.6%
Cash-on-Cash Return
3.5%
Cap rate
0.4%
Rent to Value Ratio
Active
$355,000
3
bds
|
3
ba
|
1,622
sqft
|
built
2006
1947 Joyful St, Las Vegas, NV 89115
$-599
Cash flow
-8.8%
Cash-on-Cash Return
3.7%
Cap rate
0.5%
Rent to Value Ratio

Active
$675,000
4
bds
|
4
ba
|
3,375
sqft
|
built
2003
7816 Red Leaf Dr, Las Vegas, NV 89131
$-1,166
Cash flow
-9.0%
Cash-on-Cash Return
3.6%
Cap rate
0.5%
Rent to Value Ratio

Active
$380,000
3
bds
|
3
ba
|
1,405
sqft
|
built
2004
7438 Grizzly Giant St, Las Vegas, NV 89139
$-696
Cash flow
-9.6%
Cash-on-Cash Return
3.5%
Cap rate
0.5%
Rent to Value Ratio

Active
$490,000
3
bds
|
2
ba
|
1,586
sqft
|
built
1998
7824 Indian Cloud Ave, Las Vegas, NV 89129
$-1,180
Cash flow
-12.6%
Cash-on-Cash Return
2.8%
Cap rate
0.4%
Rent to Value Ratio

Active
$415,000
3
bds
|
3
ba
|
1,565
sqft
|
built
2003
5954 Varese Dr, Las Vegas, NV 89141
$-806
Cash flow
-10.1%
Cash-on-Cash Return
3.3%
Cap rate
0.5%
Rent to Value Ratio

Active
$699,900
3
bds
|
3
ba
|
2,577
sqft
|
built
1995
1725 Tesara Vista Pl, Las Vegas, NV 89128
$-1,154
Cash flow
-8.6%
Cash-on-Cash Return
3.7%
Cap rate
0.6%
Rent to Value Ratio

Active
$424,900
4
bds
|
3
ba
|
2,038
sqft
|
built
2005
9144 Spirit Canyon Ave, Las Vegas, NV 89149
$-734
Cash flow
-9.0%
Cash-on-Cash Return
3.6%
Cap rate
0.5%
Rent to Value Ratio

Active
$465,000
3
bds
|
3
ba
|
1,763
sqft
|
built
2011
8306 Stillhouse Ct, Las Vegas, NV 89113
$-893
Cash flow
-10.0%
Cash-on-Cash Return
3.4%
Cap rate
0.5%
Rent to Value Ratio

Active
$375,000
2
bds
|
2
ba
|
1,302
sqft
|
built
2002
712 Peachy Canyon Cir, Las Vegas, NV 89144
$-989
Cash flow
-13.8%
Cash-on-Cash Return
2.5%
Cap rate
0.5%
Rent to Value Ratio

Active
$539,999
5
bds
|
3
ba
|
2,781
sqft
|
built
1976
4269 Cartegena Way, Las Vegas, NV 89121
$-747
Cash flow
-7.2%
Cash-on-Cash Return
4.0%
Cap rate
0.5%
Rent to Value Ratio

Active
$364,900
3
bds
|
3
ba
|
1,400
sqft
|
built
2006
9443 Hot Breeze St, Las Vegas, NV 89178
$-660
Cash flow
-9.4%
Cash-on-Cash Return
3.5%
Cap rate
0.5%
Rent to Value Ratio
Active
$345,000
3
bds
|
2
ba
|
1,148
sqft
|
built
1995
3767 Toothwood Ln, Las Vegas, NV 89115
$-452
Cash flow
-6.8%
Cash-on-Cash Return
4.1%
Cap rate
0.5%
Rent to Value Ratio

Active
$470,000
3
bds
|
3
ba
|
1,722
sqft
|
built
2021
10357 Toasted Acorn Dr, Las Vegas, NV 89166
$-1,126
Cash flow
-12.5%
Cash-on-Cash Return
2.8%
Cap rate
0.5%
Rent to Value Ratio

Active
$490,000
4
bds
|
3
ba
|
1,690
sqft
|
built
2023
9054 Tangerine Tree Ct, Las Vegas, NV 89113
$-1,330
Cash flow
-14.2%
Cash-on-Cash Return
2.4%
Cap rate
0.4%
Rent to Value Ratio

Active
$365,000
3
bds
|
2
ba
|
2,082
sqft
|
built
1979
3947 Landsdown Pl, Las Vegas, NV 89121
$-778
Cash flow
-11.1%
Cash-on-Cash Return
3.1%
Cap rate
0.5%
Rent to Value Ratio

Active
$365,000
3
bds
|
2
ba
|
1,226
sqft
|
built
1981
147 N Christy Ln, Las Vegas, NV 89110
$-533
Cash flow
-7.6%
Cash-on-Cash Return
3.9%
Cap rate
0.5%
Rent to Value Ratio

Active
$157,000
1
bds
|
1
ba
|
480
sqft
|
built
1963
3718 Hazelwood St, Las Vegas, NV 89119
$-516
Cash flow
-17.1%
Cash-on-Cash Return
1.7%
Cap rate
0.4%
Rent to Value Ratio

Active
$659,900
6
bds
|
3
ba
|
3,050
sqft
|
built
1996
1846 Autumn Gold Ave, Las Vegas, NV 89123
$-1,505
Cash flow
-11.9%
Cash-on-Cash Return
2.9%
Cap rate
0.4%
Rent to Value Ratio

Active
$349,900
3
bds
|
2
ba
|
1,485
sqft
|
built
1983
5705 Pearldrop Ave, Las Vegas, NV 89107
$-603
Cash flow
-9.0%
Cash-on-Cash Return
3.6%
Cap rate
0.6%
Rent to Value Ratio

Active
$420,000
4
bds
|
4
ba
|
1,977
sqft
|
built
2008
8685 Estrella Bonita Ct, Las Vegas, NV 89147
$-686
Cash flow
-8.5%
Cash-on-Cash Return
3.7%
Cap rate
0.5%
Rent to Value Ratio

Active
$469,900
3
bds
|
2
ba
|
1,372
sqft
|
built
1996
4856 Minturn Ave, Las Vegas, NV 89130
$-1,236
Cash flow
-13.7%
Cash-on-Cash Return
2.5%
Cap rate
0.4%
Rent to Value Ratio

Active
$364,999
3
bds
|
3
ba
|
1,510
sqft
|
built
2001
10151 Tumbling Tree St, Las Vegas, NV 89183
$-578
Cash flow
-8.3%
Cash-on-Cash Return
3.8%
Cap rate
0.5%
Rent to Value Ratio

Active
$550,000
5
bds
|
3
ba
|
2,467
sqft
|
built
2019
5548 Anshan St, Las Vegas, NV 89148
$-1,202
Cash flow
-11.4%
Cash-on-Cash Return
3.1%
Cap rate
0.5%
Rent to Value Ratio