Nevada Investment Properties for Sale
Browse homes for sale and investment properties in Nevada. Refine your search by price, property type, or more.
Best cash flowing properties in Nevada
Active
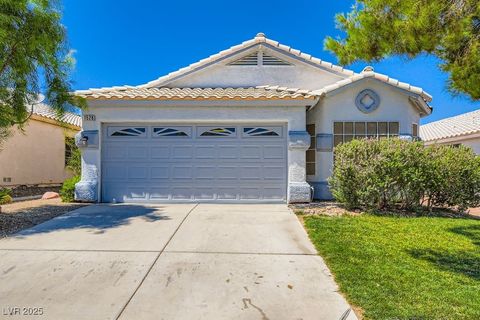
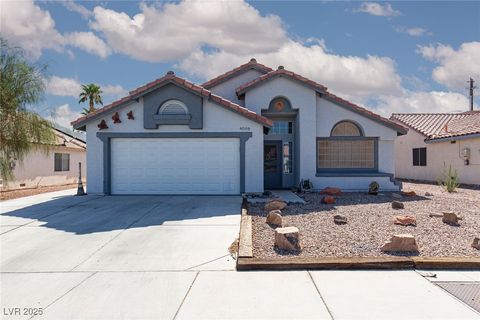
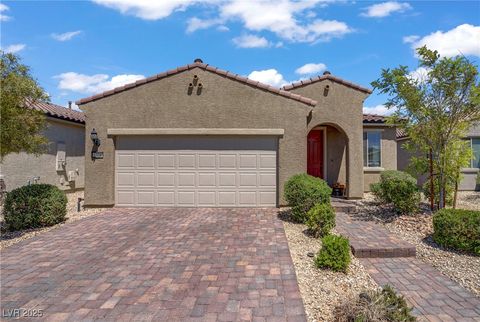
$379,500
3
bds
|
2
ba
|
1,434
sqft
|
built
1996
1528 Gaber Ct, North Las Vegas, NV 89032
$-327
Cash flow
-4.5%
Cash-on-Cash Return
4.6%
Cap rate
0.6%
Rent to Value Ratio
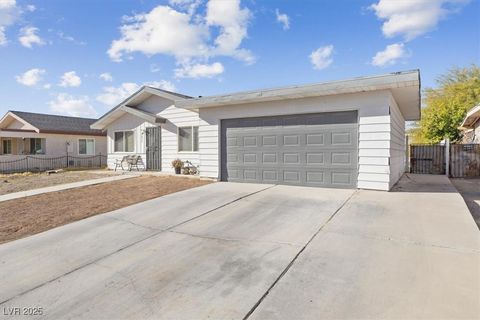
Active
$350,000
3
bds
|
2
ba
|
1,196
sqft
|
built
1980
4027 Boratko St, Las Vegas, NV 89115
$-331
Cash flow
-4.9%
Cash-on-Cash Return
4.5%
Cap rate
0.6%
Rent to Value Ratio
5,259 out of 5,499 properties for sale in Nevada
Limited Results Shown
Create a free account, or log in to reveal all property listings and enjoy the complete experience.

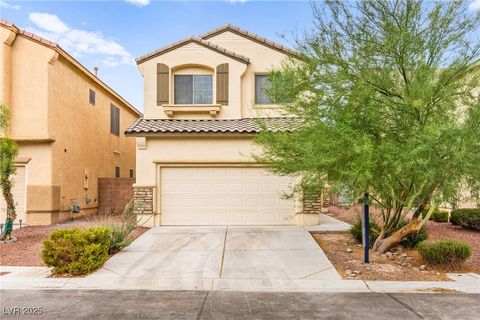
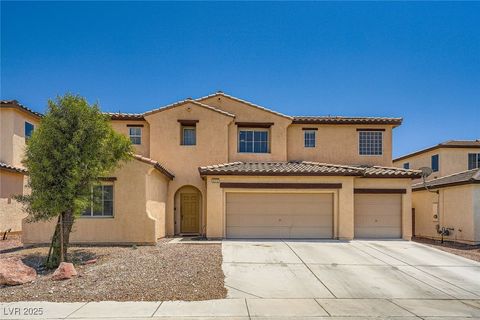
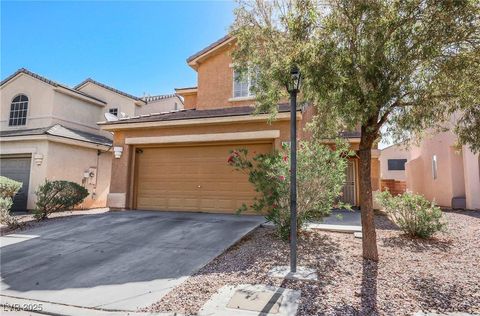
Active
$500,000
3
bds
|
3
ba
|
2,153
sqft
|
built
2003
5421 Copper Sand Ct, North Las Vegas, NV 89031
$-1,010
Cash flow
-10.5%
Cash-on-Cash Return
3.3%
Cap rate
0.5%
Rent to Value Ratio

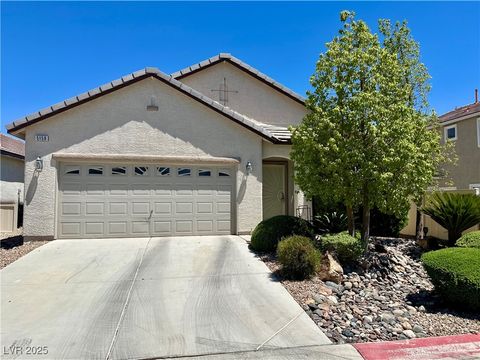
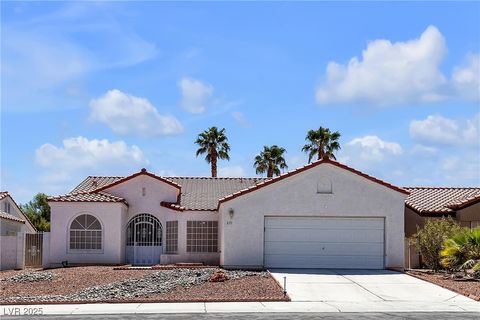
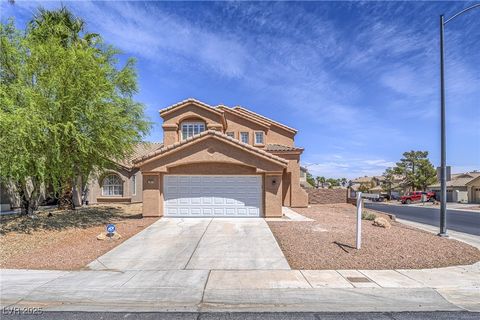
Active
$377,000
3
bds
|
3
ba
|
1,751
sqft
|
built
2006
121 Snow Dome Ave, North Las Vegas, NV 89031
$-660
Cash flow
-9.1%
Cash-on-Cash Return
3.6%
Cap rate
0.5%
Rent to Value Ratio

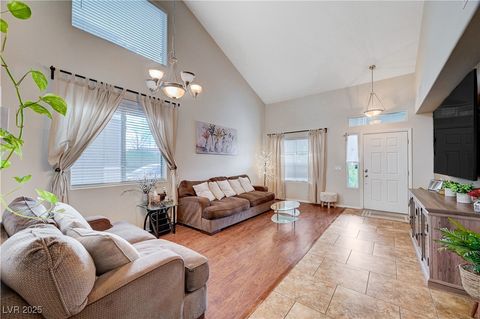
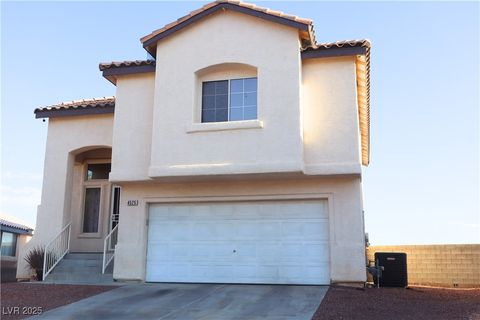
Active
$525,000
5
bds
|
3
ba
|
2,696
sqft
|
built
2004
6440 Giant Oak St, North Las Vegas, NV 89084
$-1,170
Cash flow
-11.6%
Cash-on-Cash Return
3.0%
Cap rate
0.4%
Rent to Value Ratio

Active
$385,000
3
bds
|
2
ba
|
1,401
sqft
|
built
2001
2610 Gardenia Flower Ave, North Las Vegas, NV 89031
$-672
Cash flow
-9.1%
Cash-on-Cash Return
3.6%
Cap rate
0.5%
Rent to Value Ratio
Active
$424,000
5
bds
|
3
ba
|
2,123
sqft
|
built
2005
6266 Copper Light St, North Las Vegas, NV 89081
$-740
Cash flow
-9.1%
Cash-on-Cash Return
3.6%
Cap rate
0.5%
Rent to Value Ratio

Active
$509,888
4
bds
|
3
ba
|
2,459
sqft
|
built
2019
137 Thorntree Ave, North Las Vegas, NV 89031
$-1,092
Cash flow
-11.2%
Cash-on-Cash Return
3.1%
Cap rate
0.5%
Rent to Value Ratio
Active
$390,000
3
bds
|
2
ba
|
1,615
sqft
|
built
2007
5150 Cross Ranch St, North Las Vegas, NV 89081
$-689
Cash flow
-9.2%
Cash-on-Cash Return
3.6%
Cap rate
0.5%
Rent to Value Ratio

Active
$499,999
4
bds
|
3
ba
|
2,790
sqft
|
built
2007
6569 Cedar Waxwing St, North Las Vegas, NV 89084
$-896
Cash flow
-9.3%
Cash-on-Cash Return
3.5%
Cap rate
0.5%
Rent to Value Ratio
Active
$390,000
3
bds
|
2
ba
|
1,513
sqft
|
built
1992
4008 Laurel Hill Dr, North Las Vegas, NV 89032
$-662
Cash flow
-8.9%
Cash-on-Cash Return
3.6%
Cap rate
0.5%
Rent to Value Ratio

Active
$460,000
4
bds
|
2
ba
|
2,179
sqft
|
built
2004
4204 Autumndale Ave, North Las Vegas, NV 89031
$-887
Cash flow
-10.1%
Cash-on-Cash Return
3.4%
Cap rate
0.5%
Rent to Value Ratio

Active
$360,000
2
bds
|
2
ba
|
1,301
sqft
|
built
2009
5209 Mountain Garland Ln, North Las Vegas, NV 89081
$-633
Cash flow
-9.2%
Cash-on-Cash Return
3.6%
Cap rate
0.5%
Rent to Value Ratio

Active
$375,000
3
bds
|
2
ba
|
1,186
sqft
|
built
1996
4822 Con Carne Ct, North Las Vegas, NV 89031
$-634
Cash flow
-8.8%
Cash-on-Cash Return
3.7%
Cap rate
0.5%
Rent to Value Ratio
Active
$497,995
4
bds
|
3
ba
|
2,702
sqft
|
built
2004
6216 Sterling Ranch Way, North Las Vegas, NV 89081
$-989
Cash flow
-10.4%
Cash-on-Cash Return
3.3%
Cap rate
0.5%
Rent to Value Ratio

Active
$390,000
3
bds
|
2
ba
|
1,500
sqft
|
built
1990
4540 Strato Jet Way, North Las Vegas, NV 89031
$-466
Cash flow
-6.2%
Cash-on-Cash Return
4.2%
Cap rate
0.6%
Rent to Value Ratio
Active
$395,000
3
bds
|
2
ba
|
1,507
sqft
|
built
1998
631 Kings Center Ave, North Las Vegas, NV 89032
$-604
Cash flow
-8.0%
Cash-on-Cash Return
3.8%
Cap rate
0.5%
Rent to Value Ratio
Active
$419,000
4
bds
|
3
ba
|
1,960
sqft
|
built
2005
6223 Legend Falls St, North Las Vegas, NV 89081
$-843
Cash flow
-10.5%
Cash-on-Cash Return
3.3%
Cap rate
0.5%
Rent to Value Ratio
Active
$429,900
3
bds
|
2
ba
|
1,727
sqft
|
built
2021
6324 Conlon St, North Las Vegas, NV 89081
$-993
Cash flow
-12.1%
Cash-on-Cash Return
2.9%
Cap rate
0.5%
Rent to Value Ratio

Active
$630,000
4
bds
|
3
ba
|
2,576
sqft
|
built
2003
6703 Tufted Duck Way, North Las Vegas, NV 89084
$-1,624
Cash flow
-13.4%
Cash-on-Cash Return
2.6%
Cap rate
0.4%
Rent to Value Ratio

Active
$425,000
3
bds
|
2
ba
|
1,674
sqft
|
built
2000
623 Dry Valley Ave, North Las Vegas, NV 89031
$-763
Cash flow
-9.4%
Cash-on-Cash Return
3.5%
Cap rate
0.5%
Rent to Value Ratio

Active
$794,000
5
bds
|
4
ba
|
4,382
sqft
|
built
2006
7024 Geese Gathering St, North Las Vegas, NV 89084
$-1,268
Cash flow
-8.3%
Cash-on-Cash Return
3.8%
Cap rate
0.6%
Rent to Value Ratio
Active
$355,000
3
bds
|
3
ba
|
1,451
sqft
|
built
2001
4130 Neighborly Ct, North Las Vegas, NV 89032
$-531
Cash flow
-7.8%
Cash-on-Cash Return
3.9%
Cap rate
0.6%
Rent to Value Ratio
Active
$429,995
3
bds
|
3
ba
|
1,708
sqft
|
built
1995
1822 Trigger Way, North Las Vegas, NV 89032
$-873
Cash flow
-10.6%
Cash-on-Cash Return
3.2%
Cap rate
0.5%
Rent to Value Ratio

Active
$410,000
3
bds
|
3
ba
|
1,556
sqft
|
built
2020
7710 Wishbone Falls St, North Las Vegas, NV 89084
$-979
Cash flow
-12.5%
Cash-on-Cash Return
2.8%
Cap rate
0.5%
Rent to Value Ratio

Active
$550,000
4
bds
|
4
ba
|
2,749
sqft
|
built
2006
8017 Pink Desert St, North Las Vegas, NV 89085
$-1,069
Cash flow
-10.1%
Cash-on-Cash Return
3.3%
Cap rate
0.5%
Rent to Value Ratio

Active
$340,000
3
bds
|
2
ba
|
1,336
sqft
|
built
2021
7411 Sunray Point St, North Las Vegas, NV 89084
$-689
Cash flow
-10.6%
Cash-on-Cash Return
3.2%
Cap rate
0.5%
Rent to Value Ratio
Active
$410,000
4
bds
|
2
ba
|
1,753
sqft
|
built
2002
4525 Ranch Foreman Rd, North Las Vegas, NV 89032
$-721
Cash flow
-9.2%
Cash-on-Cash Return
3.6%
Cap rate
0.5%
Rent to Value Ratio

Active
$400,000
3
bds
|
2
ba
|
1,674
sqft
|
built
2001
6670 Montezuma Castle Ln, North Las Vegas, NV 89084
$-737
Cash flow
-9.6%
Cash-on-Cash Return
3.5%
Cap rate
0.5%
Rent to Value Ratio

Active
$649,900
5
bds
|
4
ba
|
3,790
sqft
|
built
2005
6405 Sea Swallow St, North Las Vegas, NV 89084
$-1,290
Cash flow
-10.4%
Cash-on-Cash Return
3.3%
Cap rate
0.5%
Rent to Value Ratio

Active
$650,000
3
bds
|
3
ba
|
2,244
sqft
|
built
1988
5401 Painted Sunrise Dr, Las Vegas, NV 89149
$-1,726
Cash flow
-13.9%
Cash-on-Cash Return
2.5%
Cap rate
0.4%
Rent to Value Ratio

Active
$319,000
3
bds
|
3
ba
|
1,792
sqft
|
built
1976
3453 Del Marino Dr, Las Vegas, NV 89121
$-557
Cash flow
-9.1%
Cash-on-Cash Return
3.6%
Cap rate
0.5%
Rent to Value Ratio

Active
$406,000
3
bds
|
2
ba
|
1,358
sqft
|
built
1971
6812 White Sands Ave, Las Vegas, NV 89145
$-814
Cash flow
-10.5%
Cash-on-Cash Return
3.3%
Cap rate
0.4%
Rent to Value Ratio

Active
$515,000
3
bds
|
2
ba
|
1,736
sqft
|
built
1942
3871 Mountain Trl, Las Vegas, NV 89108
$-1,150
Cash flow
-11.7%
Cash-on-Cash Return
3.0%
Cap rate
0.4%
Rent to Value Ratio

Active
$385,000
3
bds
|
3
ba
|
1,689
sqft
|
built
2007
7878 Carysford Ave, Las Vegas, NV 89178
$-811
Cash flow
-11.0%
Cash-on-Cash Return
3.2%
Cap rate
0.5%
Rent to Value Ratio

Active
$3,950,000
5
bds
|
7
ba
|
6,703
sqft
|
built
2001
9717 Winter Palace Dr, Las Vegas, NV 89145
$-18,446
Cash flow
-24.4%
Cash-on-Cash Return
0.1%
Cap rate
0.1%
Rent to Value Ratio

Active
$427,000
3
bds
|
2
ba
|
1,576
sqft
|
built
1996
7272 Golden Star Ave, Las Vegas, NV 89130
$-927
Cash flow
-11.3%
Cash-on-Cash Return
3.1%
Cap rate
0.4%
Rent to Value Ratio

Active
$2,125,000
5
bds
|
5
ba
|
4,444
sqft
|
built
2006
716 Chervil Valley Dr, Las Vegas, NV 89138
$-4,150
Cash flow
-10.2%
Cash-on-Cash Return
3.3%
Cap rate
0.5%
Rent to Value Ratio

Active
$493,000
3
bds
|
2
ba
|
1,630
sqft
|
built
2001
10301 George Hart Ct, Las Vegas, NV 89129
$-1,087
Cash flow
-11.5%
Cash-on-Cash Return
3.0%
Cap rate
0.4%
Rent to Value Ratio
Active
$825,000
4
bds
|
4
ba
|
2,475
sqft
|
built
1997
9917 Dusty Winds Ave, Las Vegas, NV 89117
$-2,125
Cash flow
-13.4%
Cash-on-Cash Return
2.6%
Cap rate
0.4%
Rent to Value Ratio